echarts-radar雷达图

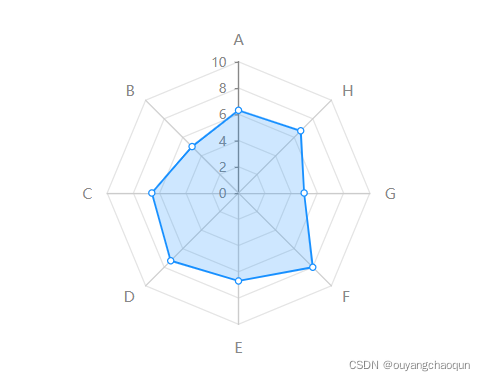
本文介绍了一个使用SVG渲染的雷达图实例,通过ECharts库实现,详细配置了雷达图的各项属性,如字体样式、米轴、分割线等,并展示了如何设置数据系列。

在这里插入图片描述

<div id="radar-chart" style="width: 400px;"></div>
<script>
export default{
	data(){
		return {}
	},
	mounted(){
		this.init()
	},
	methods:{
		init () {
      	  const radarChart = this.$echarts.init(document.getElementById('radar-chart'), null, {renderer: 'svg'})
	      let option = {
	        radar: [{
	          center:['50%','50%'],
	          radius: '75%',
	          //图外名称
	          name: {
	            formatter: '{value}',
	            // 字体样式
	            textStyle: {
	              fontSize: 12,
	              color: '#888'
	            }
	          },
	          indicator: [
	            { name: "A", max: 10 ,axisLine:{lineStyle:{color:'#888'}}},
	            { name: "B", max: 10 ,axisLabel:{show:false},axisTick:{show:false}},
	            { name: "C", max: 10 ,axisLabel:{show:false},axisTick:{show:false}},
	            { name: "D", max: 10 ,axisLabel:{show:false},axisTick:{show:false}},
	            { name: "E", max: 10 ,axisLabel:{show:false},axisTick:{show:false}},
	            { name: "F", max: 10 ,axisLabel:{show:false},axisTick:{show:false}},
	            { name: "G", max: 10 ,axisLabel:{show:false},axisTick:{show:false}},
	            { name: "H", max: 10 ,axisLabel:{show:false},axisTick:{show:false}}
	          ],
	          nameGap: 12,
	          axisLine: { //米轴
	            show: true,
	            lineStyle: {
	              color: '#ccc',
	            },
	          },
	          axisTick:{
	            show:true,
	            length:3
	          },
	          splitNumber: 5, //轴的分割段数
	          axisLabel: { // 显示刻度值
	            show:true,
	            color:'#888',
	            fontSize:10,
	            margin:10
	          },
	          splitLine: {
	            lineStyle: {
	              color:"#e4e4e4"
	            }
	          },
	          splitArea: {
	            areaStyle: {
	              color: ['#fff'],  //雷达背景
	            }
	          }
	        }],
	        series: [{
	          name: "评估",
	          type: "radar",
	          data: [{
	            value: [7.7, 5, 6.6, 7.3, 6.7, 8, 5, 6.7],
	            name: "评估",
	            symbolSize:5,
	            itemStyle: { // 拐点
	              normal: {
	                borderColor: '#1890FF',
	                borderWidth: 1,
	                color: "#fff"
	              }
	            },
	            lineStyle:{  // 折线
	              color:'#1890FF',
	              width:1.5
	            },
	            areaStyle: { // 区域填充
	              normal: {
	                color: 'rgba(24,144,255,0.3)'
	              }
	            }
	          }],
	        }]
	      }
	      radarChart.clear();
	      setTimeout(()=>{radarChart.setOption(option)},100)
       }
	}
}
</script>

### 雷达显示不完整问题的解决方案 在 ECharts 中,雷达显示不完整的问题通常与配置项、数据格式或容器尺寸有关。以下是可能的原因及对应的解决方案: #### 1. 容器尺寸不足 如果 ECharts 表的容器尺寸过小,可能会导致表内容无法完全显示。确保容器的宽度和高度足够大以容纳表内容[^1]。 ```css #radarChart { width: 600px; height: 400px; } ``` #### 2. 数据格式错误 雷达的数据格式需要严格遵循 ECharts 的规范。如果数据格式不符合要求,可能导致表显示异常。确保 `indicator` 和 `data` 的格式正确[^2]。 ```javascript option = { radar: { indicator: [ { name: '指标1', max: 100 }, { name: '指标2', max: 100 }, { name: '指标3', max: 100 } ] }, series: [{ type: 'radar', data: [ { value: [80, 70, 60], name: '示例数据' } ] }] }; ``` #### 3. 配置项调整 有时需要调整雷达的配置项以优化显示效果。例如,通过设置 `radius` 或 `center` 来调整雷达的大小和位置[^3]。 ```javascript option = { radar: { radius: '80%', // 调整雷达半径 center: ['50%', '50%'] // 调整雷达中心位置 }, series: [{ type: 'radar' }] }; ``` #### 4. Tooltip 显示问题 如果 Tooltip 在某些情况下显示不完整,可以通过自定义 `formatter` 来解决[^4]。 ```javascript tooltip: { trigger: 'item', formatter: function (params) { return `${params.name}: ${params.value}%`; } }, ``` #### 5. 溢出问题 当文本内容过长时,可能会导致溢出问题。可以尝试使用以下方法处理溢出。 ```javascript label: { overflow: 'truncate', width: 100, ellipsis: '...' } ``` 如果上述方法无效,可以考虑通过 CSS 控制容器样式来避免溢出。 ```css .text-overflow { white-space: nowrap; overflow: hidden; text-overflow: ellipsis; max-width: 100px; } ``` ### 注意事项 确保所有依赖库版本一致,避免因版本差异导致的功能失效。同时,检查浏览器控制台是否有相关错误信息,以便快速定位问题。 ---
评论
成就一亿技术人!
拼手气红包6.0元
还能输入1000个字符
 
红包 添加红包
表情包 插入表情
 条评论被折叠 查看
添加红包

请填写红包祝福语或标题

红包个数最小为10个

红包金额最低5元

当前余额3.43前往充值 >
需支付:10.00
成就一亿技术人!
领取后你会自动成为博主和红包主的粉丝 规则
hope_wisdom
发出的红包
实付
使用余额支付
点击重新获取
扫码支付
钱包余额 0

抵扣说明:

1.余额是钱包充值的虚拟货币,按照1:1的比例进行支付金额的抵扣。
2.余额无法直接购买下载,可以购买VIP、付费专栏及课程。

余额充值