


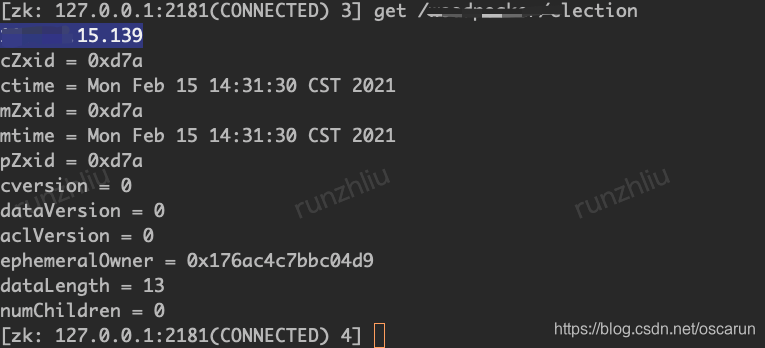
需求就是希望能在 Grafana 的 Dashboard 直接看到选主的信息,也就是 Znode 对应的值,因为考虑到 ZK 里存的值可能是字符串,而且 Prometheus 的指标都是数值型的,所以用 Counter, Summary 之类的难以实现把 ZK 的值直接通过 Metrics 直接 Export 出来,但是我们可以通过 Label 的方式,把 Znode 的值打到指标上,在 Grafana 展示的时候通过指标的标签来构造图表就可以了。
代码很简单,本地通过 curl localhost:8000 就可以看到效果了。
import os
import time

from kazoo.client import KazooClient
from prometheus_client import Info
from prometheus_client import start_http_server

hosts = os.getenv('ZK_HOSTS', '127.0.0.1:2181')
master_path = os.getenv('MASTER_PATH', '/xxx/election')
exporter_port = os.getenv('EXPORTER_PORT', '8000')


# get master election ip
def get_master_ip():
  zk = KazooClient(hosts=hosts)
  zk.start()
  node = zk.get(master_path)[0]
  zk.stop()
  # tag master ip to metrics
  i = Info('election', 'master ip')
  i.info({'election_master_ip': node})


if __name__ == '__main__':
  # Start up the server to expose the metrics.
  get_master_ip()
  start_http_server(int(exporter_port))
  # Generate some requests.
  while True:
    time.sleep(30)
指标例子。
# HELP election_info woodpeckserver master ip
# TYPE election_info gauge
election_info{election_master_ip="xx.xx.15.139"} 1.0
# HELP python_info Python platform information
# TYPE python_info gauge
python_info{implementation="CPython",major="2",minor="7",patchlevel="5",version="2.7.5"} 1.0
图就不做了,领悟一下就好了~


 619
619

 被折叠的 条评论
为什么被折叠?
被折叠的 条评论
为什么被折叠?
 到【灌水乐园】发言


