


当前有效matplotlib版本为:3.4.1。
概述
subplots函数的功能是创建一个figure对象和一组子图。
函数的定义签名为:matplotlib.pyplot.subplots(nrows=1, ncols=1, *, sharex=False, sharey=False, squeeze=True, subplot_kw=None, gridspec_kw=None, **fig_kw)
函数的参数为:
nrows, ncols: 子图网格的行/列数。可选参数。整数,默认值为1。sharex, sharey: 控制子图共享x或y轴的行为。布尔值或{'none', 'all', 'row', 'col'},默认值为False。Trueor'all':所有子图共享x/y轴Falseor'none':所有子图的x/y轴都是独立的。'row':每行子图共享x/y轴'col':每列子图共享x/y轴
squeeze:控制函数返回值中子图元组的维度。可选参数。布尔值,默认值为True。- 值为
False:函数返回值为Axes对象二维数组。 - 值为
True:压缩函数返回值中~matplotlib.axes.Axes对象的维度。- 子图数量为
1,返回一个单独的Axes对象(标量)。 - 子图结构为
Nx1或1xM,返回一个Axes对象的一维数组。 - 子图结构为
NxM,返回一个Axes对象的二维数组。
- 子图数量为
- 值为
num:用于设置figure对象的编号或标签,属于.pyplot.figure的关键字参数。可选参数。整数或字符串。默认值为None。subplot_kw:用于向创建子图时的底层函数~matplotlib.figure.Figure.add_subplot传递关键字参数。可选参数。字典。gridspec_kw:用于向创建子图网格时用到的~matplotlib.gridspec.GridSpec类的构造函数传递关键字参数。可选参数。字典。**fig_kw:用于向.pyplot.figure传递关键字参数。可选参数。字典。
函数的返回值为二元组,构成元素为:
fig:~.figure.Figure对象ax:.axes.Axes对象或Axes对象数组。
subplots函数其实是Figure.subplots方法的封装。源码为:
def subplots(nrows=1, ncols=1, sharex=False, sharey=False, squeeze=True,
             subplot_kw=None, gridspec_kw=None, **fig_kw):
    fig = figure(**fig_kw)
    axs = fig.subplots(nrows=nrows, ncols=ncols, sharex=sharex, sharey=sharey,
                       squeeze=squeeze, subplot_kw=subplot_kw,
                       gridspec_kw=gridspec_kw)
    return fig, axs
案例:演示squeeze参数对函数返回值的影响
import matplotlib.pyplot as plt

# 绘制1个子图
r1=plt.subplots()
print(r1)
# 绘制1个子图,但squeeze为False
# 子图部分为1个Axes对象二维数组,形状为(1, 1)。
r2=plt.subplots(squeeze=False)
print(r2)
# 绘制3行2列6个子图
# 子图部分为1个Axes对象二维数组,形状为(3, 2)。
r3=plt.subplots(nrows=3,ncols=2,facecolor='r',subplot_kw=dict(facecolor="b"))
print(r3)

plt.show()
输出为:
# 子图部分为1个单独的Axes对象。
(<Figure size 432x288 with 1 Axes>, <AxesSubplot:>)
# 子图部分为1个Axes对象二维数组,形状为(1, 1)。
(<Figure size 432x288 with 1 Axes>, array([[<AxesSubplot:>]], dtype=object))
# 子图部分为1个Axes对象二维数组,形状为(3, 2)
(<Figure size 432x288 with 6 Axes>, array([[<AxesSubplot:>, <AxesSubplot:>],
       [<AxesSubplot:>, <AxesSubplot:>],
       [<AxesSubplot:>, <AxesSubplot:>]], dtype=object))
案例:演示函数返回值的应用
这部分内容其实与matplotlib无关,应该属于Python和numpy的基础知识。
subplots函数的返回值为2元组,一个元素为figure对象,一个元素为Axes对象。
典型应用方式如下,函数返回值中Axes对象结构不同导致了这些不同写法。
# ax为标量
fig, ax = plt.subplots()
# (ax1, ax2)构成元组
fig, (ax1, ax2) = plt.subplots(1, 2)
# axes为二维数组
fig, axes = plt.subplots(2, 2)
axes[0, 0].plot(x, y)
axes[1, 1].scatter(x, y)
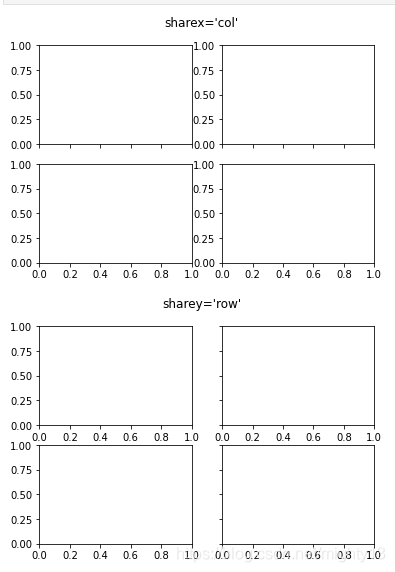
案例:演示sharex、sharey参数的取值
import matplotlib.pyplot as plt
# Share a X axis with each column of subplots
plt.subplots(2, 2, sharex='col')
plt.suptitle("sharex='col'")
# Share a Y axis with each row of subplots
plt.subplots(2, 2, sharey='row')
plt.suptitle("sharey='row'")
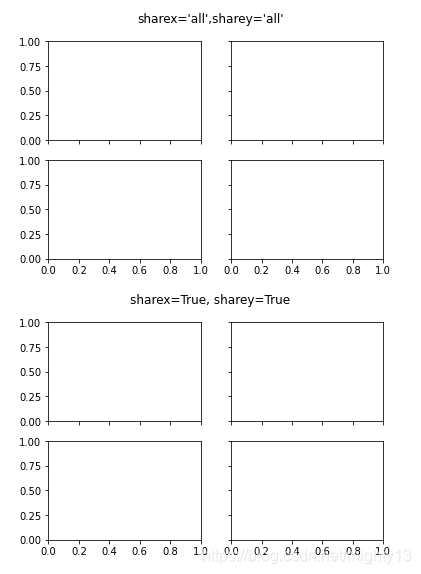
# Share both X and Y axes with all subplots
plt.subplots(2, 2, sharex='all', sharey='all')
plt.suptitle("sharex='all',sharey='all'")
# Note that this is the same as
plt.subplots(2, 2, sharex=True, sharey=True)
plt.suptitle("sharex=True, sharey=True")
plt.show()
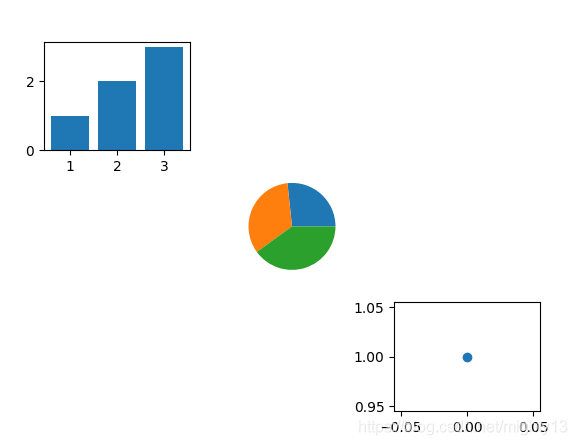
案例:subplots函数简易用法
import matplotlib.pyplot as plt

# 添加3行3列子图9个子图
fig, axes = plt.subplots(3, 3)
# 为第1个子图绘制图形
axes[0, 0].bar(range(1, 4), range(1, 4))
# 为第5个子图绘制图形
axes[1, 1].pie([4, 5, 6])
# 为第9个子图绘制图形
axes[2, 2].plot([1], 'o')

# 删除没有用到的子图
for i in range(3):
    for j in range(3):
        if i != j:
            axes[i, j].remove()

plt.show()
subplot函数与subplots函数的对比
功能:
subplot函数:每次绘制1个子图,多次调用可根据网格生成子图集合。subplots函数:每次绘制1组子图,生成一个figure对象(独立的图像)。
返回值:
subplot函数:一个单独的Axes对象。subplots函数:元组结构,figure对象和Axes对象数组或Axes对象。


 2万+
2万+


 到【灌水乐园】发言


