


最近学习使用了多种DETR系列算法模型训练与测试,如DETR、RT-DETR、DINO、D-FINE等,发现与YOLO系列模型展示结果不同,DETR系列模型训练后的输出并不是按照类别展示精度的,而是统一展示,如图所示:
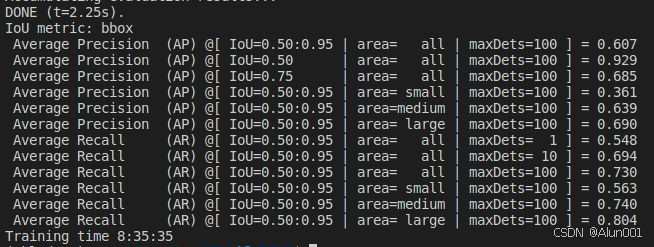
这样当我们想统计某些具体类别的检测结果时就很不方便,因此本文分享一个有关于DETR系列模型按照类别展示具体检测结果的方法。
首先查询相关资料后,发现DETR类模型精度值计算输出主要是由Conda环境中的py文件控制的,主要是pycocotools的cocoeval.py,可按照以下步骤修改,具体过程参考了这篇文章:DETR-like模型输出各类别AP值_51CTO博客_dea模型输出结果分析:
1.
定位到
/home/×××/anaconda3/envs/detr环境名称/lib/python3.8/site-packages/pycocotools/coco.py
修改__init__(),主要是为了输出结果前,展示具体的类别名称:
def __init__(self, annotation_file=None):
        """
        Constructor of Microsoft COCO helper class for reading and visualizing annotations.
        :param annotation_file (str): location of annotation file
        :param image_folder (str): location to the folder that hosts images.
        :return:
        """
        # load dataset
        self.dataset,self.anns,self.cats,self.imgs = dict(),dict(),dict(),dict()
        self.imgToAnns, self.catToImgs = defaultdict(list), defaultdict(list)
        if not annotation_file == None:
            print('loading annotations into memory...')
            tic = time.time()
            with open(annotation_file, 'r') as f:
                dataset = json.load(f)
            assert type(dataset)==dict, 'annotation file format {} not supported'.format(type(dataset))
            print('Done (t={:0.2f}s)'.format(time.time()- tic))
            print(
                "catefory names: {}".format([e["name"] for e in sorted(dataset["categories"], key=lambda x: x["id"])]))
            self.dataset = dataset
            self.createIndex()
2.
定位到
/home/×××/anaconda3/envs/detr环境名称/lib/python3.8/site-packages/pycocotools/cocoeval.py,修改def summarize(self)为:
def summarize(self):
        '''
        Compute and display summary metrics for evaluation results.
        Note this functin can *only* be applied on the default parameter setting
        '''
        def _summarize( ap=1, iouThr=None, areaRng='all', maxDets=100 ):
            p = self.params
            iStr = ' {:<18} {} @[ IoU={:<9} | area={:>6s} | maxDets={:>3d} ] = {:0.3f}'
            titleStr = 'Average Precision' if ap == 1 else 'Average Recall'
            typeStr = '(AP)' if ap==1 else '(AR)'
            iouStr = '{:0.2f}:{:0.2f}'.format(p.iouThrs[0], p.iouThrs[-1]) \
                if iouThr is None else '{:0.2f}'.format(iouThr)

            aind = [i for i, aRng in enumerate(p.areaRngLbl) if aRng == areaRng]
            mind = [i for i, mDet in enumerate(p.maxDets) if mDet == maxDets]
            if ap == 1:
                # dimension of precision: [TxRxKxAxM]
                s = self.eval['precision']
                # IoU
                if iouThr is not None:
                    t = np.where(iouThr == p.iouThrs)[0]
                    s = s[t]
                s = s[:,:,:,aind,mind]
            else:
                # dimension of recall: [TxKxAxM]
                s = self.eval['recall']
                if iouThr is not None:
                    t = np.where(iouThr == p.iouThrs)[0]
                    s = s[t]
                s = s[:,:,aind,mind]
            if len(s[s>-1])==0:
                mean_s = -1
            else:
                mean_s = np.mean(s[s>-1])
            #print(iStr.format(titleStr, typeStr, iouStr, areaRng, maxDets, mean_s))
            category_dimension = 1 + int(ap)
            if s.shape[category_dimension] > 1:

                iStr += ", per category = {}"
                mean_axis = (0,)
                if ap == 1:
                    mean_axis = (0, 1)
                per_category_mean_s = np.mean(s, axis=mean_axis).flatten()
                with np.printoptions(precision=3, suppress=True, sign=" ", floatmode="fixed"):
                    print(iStr.format(titleStr, typeStr, iouStr, areaRng, maxDets, mean_s, per_category_mean_s))
            else:
                print(iStr.format(titleStr, typeStr, iouStr, areaRng, maxDets, mean_s, ""))
            return mean_s
执行完上面两步之后,在此执行eval.py,查看结果:
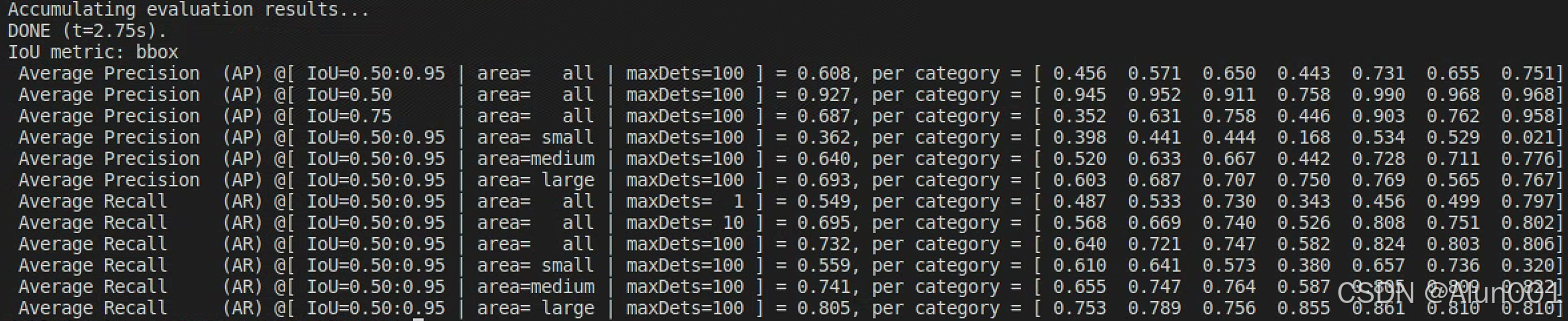
可以看到在总AP值后面,按照类别展示了对应的AP值。


 8437
8437

 被折叠的 条评论
为什么被折叠?
被折叠的 条评论
为什么被折叠?
 到【灌水乐园】发言


