


综合练习(二)
一、选择
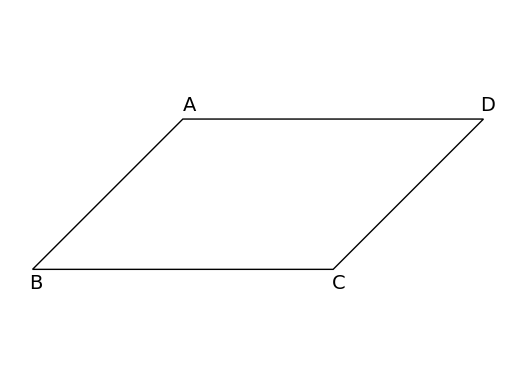
- 如图,▱ABCD中,∠B=64▱ABCD 中,\angle B = 64▱ABCD中,∠B=64°,则 ∠D=\angle D =∠D= ( C )
A. 26∘26^\circ26∘ B. 32∘32^\circ32∘ C. 64∘64^\circ64∘ D. 116∘116^\circ116∘
平行四边形的对角相等, 因为四边形 ABCD 是平行四边形,∠B\angle B∠B 与 ∠D\angle D∠D 是对角,所以 ∠B=∠D=64∘\angle B = \angle D = 64^\circ∠B=∠D=64∘
import matplotlib.pyplot as plt
from matplotlib.patches import Polygon
# 创建一个图形和子图
fig, ax = plt.subplots()

# 定义平行四边形四个顶点的坐标
vertices = [
    [0, 0], # 左下 B
    [2, 0], # 右下 C
    [3, 1], # 右上 D
    [1, 1]  # 左上 A
]

# 绘制平行四边形
ax.add_patch(Polygon(vertices, closed=True, fill=False, ec='k'))

# 顶点标记
vertex_labels = ['B', 'C', 'D', 'A']

# 标记
for i, (x, y) in enumerate(vertices):
    label_offset_x = 0.08
    label_offset_y = 0.08
    offset_var = 0.01
    match vertex_labels[i]:
        case 'B':
            ax.annotate(vertex_labels[i], (x-offset_var*2, y-label_offset_y-offset_var*5), fontsize=14)
        case 'C':
            ax.annotate(vertex_labels[i], (x-offset_var, y-label_offset_y-offset_var*5), fontsize=14)
        case 'D':
            ax.annotate(vertex_labels[i], (x-offset_var*2, y+label_offset_y-offset_var*2), fontsize=14)
        case 'A':
            ax.annotate(vertex_labels[i], (x, y+label_offset_y-offset_var*2), fontsize=14)

ax.axis('equal')
ax.axis('off')

plt.show()
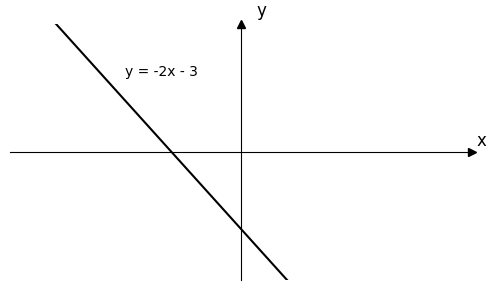
- 一次函数 y=−2x−3y = -2x - 3y=−2x−3 的图像 不⋅经⋅过⋅\underset{\cdot}{不}\underset{\cdot}{经}\underset{\cdot}{过}⋅不⋅经⋅过(A)
A. 第一象限 \quad B. 第二象限 \quad C. 第三象限 \quad D. 第四象限
Solution: 绘制一次函数 y=−2x−3y = -2x - 3y=−2x−3 的图像,不经过 第一象限
import matplotlib.pyplot as plt
import numpy as np

# 创建一个图形和子图
fig, ax = plt.subplots(figsize=(5, 3))

# 定义 x 的取值范围
x = np.linspace(-5, 5, 100)

# 定义函数式
k = -2
b = -3
y = k * x + b
# 绘制函数图像
plt.plot(x, y, lw=1.5, color='k')

# 轴范围
ax.set_xlim(-5, 5)
ax.set_ylim(-5, 5)

# 轴放置在中心
ax.spines['left'].set_position('center')
ax.spines['bottom'].set_position('center')
ax.spines['right'].set_color('none')
ax.spines['top'].set_color('none')

# 设置坐标轴标签
ax.set_xlabel('x', fontsize=12, labelpad=-15, x=1.02)
ax.set_ylabel('y', fontsize=12, labelpad=-15, y=1.02, rotation=0)


# 设置坐标轴箭头
ax.plot(1, 0, '>k', transform=ax.get_yaxis_transform(), clip_on=False)
ax.plot(0, 1, '^k', transform=ax.get_xaxis_transform(), clip_on=False)
# 不显示刻度
ax.set_xticks([])
ax.set_yticks([])

# 标记函数图像
ax.annotate(
    f'y = -2x - 3',
    xy=(-2.5, 3),
)

plt.tight_layout()
plt.show()
二、填空题
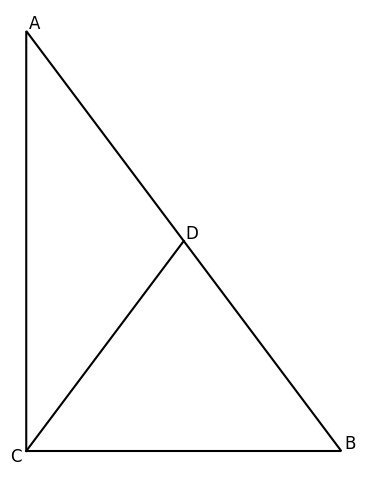
- 如图,在 △ABC\triangle ABC△ABC中, ∠ACB=90∘,∠A=40∘\angle ACB = 90^\circ, \angle A = 40^\circ∠ACB=90∘,∠A=40∘, D 为线段 AB 的中点,则∠BCD=50‾∘\angle BCD = \underline{\quad 50 \quad } ^\circ∠BCD=50∘
在 △ABC\triangle ABC△ABC中,∠ACB=90∘\angle ACB = 90^\circ∠ACB=90∘, ∠A=40∘\angle A = 40^\circ∠A=40∘, 根据三角形内角和为 180 °,可得 ∠B=180∘−∠ACB−∠A=180∘−90∘−40∘=50∘\angle B = 180^{\circ}-\angle ACB - \angle A = 180^{\circ}- 90^{\circ}- 40^{\circ}= 50^{\circ}∠B=180∘−∠ACB−∠A=180∘−90∘−40∘=50∘。
利用直角三角形斜边中线的性质, 因为 ∠ACB=90∘\angle ACB = 90^{\circ}∠ACB=90∘,D为线段AB的中点,根据直角三角形斜边中线定理:直角三角形斜边的中线等于斜边的一半 ,所以 CD=BD=12ABCD = BD=\frac{1}{2}ABCD=BD=21AB。
由于 CD=BD,所以△BCDCD = BD,所以\triangle BCDCD=BD,所以△BCD是等腰三角形,根据等腰三角形两底角相等,可得∠BCD=∠B=50∘\angle BCD = \angle B = 50^{\circ}∠BCD=∠B=50∘
import matplotlib.pyplot as plt
from matplotlib.patches import Polygon

# points
C = ( 0, 0)
B = ( 3, 0)
A = ( 0, 4)
D = ( 1.5, 2)


fig, ax = plt.subplots(figsize=(8,6))

triangle = Polygon([C,B,A], ec='k', fill=False, closed=True, lw=1.5)
ax.add_patch(triangle)
ax.plot([C[0], D[0]], [C[1], D[1]], 'k', lw=1.5)

for name, (x, y) in dict(C=C, B=B, A=A, D=D).items():
    if name == 'C':
        ax.annotate(name, xy=(x-0.1,y-0.1), ha='center', fontsize=12)
    else:
        ax.annotate(name, xy=(x+0.08,y+0.02), ha='center', fontsize=12)

ax.set_aspect('equal')
ax.axis('off')


plt.show()
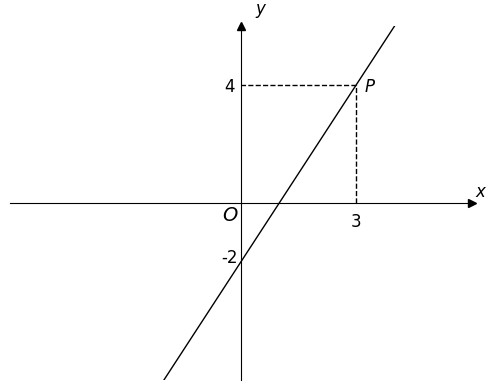
- 如图,点 P(3, 4) 在一次函数 y=kx+b(k≠0)y = kx + b (k\neq0)y=kx+b(k=0) 的图像上, 则关于 x 的不等式 kx+b<4x \text{ 的不等式 } kx + b < 4x 的不等式 kx+b<4 的解集是
solution:由函数图像可知,一次函数 y=kx+b(k≠0)y = kx + b (k\neq0)y=kx+b(k=0) 从左向右单调递增。已知点 P(3,4)P(3,4)P(3,4) 在函数 y=kx+by = kx + by=kx+b 图像上 (当x=3时,y=4x = 3 时,y = 4x=3时,y=4),
不等式 kx+b<4kx + b < 4kx+b<4 即 y < 4。 根据函数单调性,y随x的增大而增大,因此当 y < 4 是, x < 3。不等式 kx + b < 4 的解集是 x < 3。
import matplotlib.pyplot as plt
import matplotlib as mpl
mpl.rcParams['text.usetex'] = False

# 设置画布
fig, ax = plt.subplots(figsize=(5,4))

# points
x = np.linspace(-2, 6, 100)

# 一次函数式
k = 2
b = -2
y = k*x+b

# 轴范围
ax.set_xlim(-6,6)
ax.set_ylim(-6,6)

# 设置轴
ax.spines['left'].set_position('center')
ax.spines['bottom'].set_position('center')
ax.spines['right'].set_color('none')
ax.spines['top'].set_color('none')

# 箭头
ax.plot(1,0, '>k', transform=ax.get_yaxis_transform(), clip_on=False)
ax.plot(0,1, '^k', transform=ax.get_xaxis_transform(), clip_on=False)

ax.plot(x,y,'k', lw=1)

# 标记
ax.annotate(
    r'$\it{O}$',
    xy=(0,0),
    xytext=(-0.5, -0.6),
    fontsize=14,
    ha='left',
)

ax.annotate(
    '-2',
    xy=(0, -2),
    xytext=(-0.5, -2),
    fontsize=12,
    ha='left'
)

ax.annotate(
    '3',
    xy=(3, 0),
    xytext=(2.85, -0.8),
    fontsize=12,
    ha='left'
)

plt.plot(
    [3,3],[0,4],'k--',lw=1
)
plt.plot(
    [3, 0], [4, 4], 'k--', lw=1
)

ax.annotate(
    '4',
    xy=(0,4),
    xytext=(-0.3, 3.8),
    fontsize=12,
    ha='center'
)

ax.annotate(
    r'$P$',
    xy=(3, 4),
    xytext=(3.2, 3.8),
    fontsize=12,
    ha='left'
)

ax.set_xlabel(r'$x$', fontsize=12, labelpad=-15, x=1.02)
ax.set_ylabel(r'$y$', fontsize=12, labelpad=-15, y=1.02, rotation=0)

# ax.set_aspect('equal')
ax.set_xticks([])
ax.set_yticks([])
plt.tight_layout()
plt.show()
三、解答题
- 计算: 12−3+313\displaystyle\sqrt{12}-\sqrt{3}+3\sqrt{\frac{1}{3}}12−3+331
import sympy as sp
solution: 23−3+9×13\displaystyle2\sqrt{3} - \sqrt{3} + \sqrt{9\times\frac{1}{3}}23−3+9×31
23−3+3\displaystyle2\sqrt{3} - \sqrt{3} + \sqrt{3}23−3+3 = 232\sqrt{3}23
from sympy import sqrt, Rational
from IPython.display import display, Math

sqrt_num1 = sp.sqrt(12)
sqrt_num2 = sp.sqrt(3)
sqrt_num3 = sp.sqrt(Rational(1,3))
expr = sqrt_num1 - sqrt_num2 + 3*sqrt_num3
expr
23\displaystyle 2 \sqrt{3}23
6*. 为了解饮料自动售货机的销售情况,有关部门对甲、乙两个城市的饮料自动售货机进行了抽样调查,过程如下,请补充完整。
收集数据: 从两个城市所有的饮料自动售货机中分别随机抽取16台,记录下某一天各自的销售情况(单位:元)如下:
甲:25, 45, 38, 22, 10, 28, 61, 18, 38, 45, 78, 45, 58, 32, 16, 78
乙:48, 52, 21, 25, 33, 12, 42, 39, 41, 42, 33, 44, 33, 18, 68, 72
整理、描述数据: 对销售金额进行分组, 各组的频数如下:
| 销售金额x \ 频数 \ 城市 | 0≤x<200 \leq x < 200≤x<20 | 20≤x<4020 \leq x < 4020≤x<40 | 40≤x<6040 \leq x < 6040≤x<60 | 60≤x<8060 \leq x < 8060≤x<80 |
|---|---|---|---|---|
| 甲 | 3 | 6 | 4 | 3 |
| 乙 | 2 | 6 | 6 | 2 |
分析数据: 两组样本数据的平均数、中位数、众数和方差如下表所示:
| 城市 | 平均数 | 中位数 | 众数 | 方差 |
|---|---|---|---|---|
| 甲 | 39.8 | 38 | 45 | 403 |
| 乙 | 38.9 | 40 | 33 | 252 |
得出结论:
a. 乙城市目前共有饮料自动售货机 2000 台, 估计日销售金额不低于 40 元的数量约为 1000 台;
b. 可以推断出 甲_ 城市的饮料自动售货机销售情况较好,理由为
甲城与乙城均值差为:0.90,甲城均值大于乙城均值
甲城与乙城众数差为:12.00, 甲城众数大于乙城众数
结论:虽然根据离散指标(甲403>乙252甲_{403} > 乙_{252}甲403>乙252),反映出乙城销售情况更稳定,但甲城市的平均数大于乙城市的平均数,且甲城市的众数大于乙城市的众数,说明甲城市饮料自动售货机的销售金额整体更高,基于集中趋势指标判断,甲城市的销售情况更好。
# 乙城市销售数据
# Q_a:
data_Yi = [48, 52, 21, 25, 33, 12, 42, 39, 41, 42, 33, 44, 33, 18, 68, 72]
count_40_60 = sum(1 for num in data_Yi if 40 <= num < 60)
count_60_80 = sum(1 for num in data_Yi if 60 <= num < 80)
total_ge_40_Yi = count_40_60 + count_60_80
total_sampling = 16
perc_Yi = total_ge_40_Yi / total_sampling
total_num_vending_machine = 2000
num_ge_40_Yi = total_num_vending_machine * perc_Yi
print(f'问题a: 乙城市目前共有饮料自动售货机 2000 台, 估计日销售金额不低于 40 元的数量约为: {num_ge_40_Yi}台。')
# Q_b:
data_desc = {
    'city_Jia': {
        'mean': 39.8,
        'median': 38,
        'mode': 45,
        'variance': 403
    },
    'city_Yi': {
        'mean': 38.9,
        'median': 40,
        'mode': 33,
        'variance': 252
    }
}

# matrics_central_tendency
mean_diff = data_desc['city_Jia']['mean'] - data_desc['city_Yi']['mean']
median_diff = data_desc['city_Jia']['median'] - data_desc['city_Yi']['median']
mode_diff = data_desc['city_Jia']['mode'] - data_desc['city_Yi']['mode']

# matrics_discrete
variance_Jia = data_desc['city_Jia']['variance']
variance_Yi = data_desc['city_Yi']['variance']
variance_diff = variance_Jia - variance_Yi

# matrics_higher_value_frequency
perc_Jia = 7 / 16
perc_Yi = 8 / 16
perc_ge_40_diff = (perc_Jia - perc_Yi)*100

# conclusion
mean_compare = "甲城均值大于乙城均值" if mean_diff > 0 else ("甲城均值小于乙城均值" if mean_diff < 0 else "两城均值相等")
mode_compare = "甲城众数大于乙城众数" if mode_diff > 0 else ("甲城众数小于乙城众数" if mode_diff < 0 else "两城众数相等")
print('问题b: ---------集中趋势指标----------------')
print('可以推断出甲城市的饮料自动售货机销售情况较好,结论如下:')
print(f'甲城与乙城均值差为:{mean_diff:.2f},{mean_compare}')
print(f'甲城与乙城众数差为:{mode_diff:.2f}, {mode_compare}')
print('结论:虽然根据离散指标,乙城销售情况更稳定,但甲城市的平均数大于乙城市的平均数,\
且甲城市的众数大于乙城市的众数,说明甲城市饮料自动售货机的销售金额整体更高,基于集中趋势指标判断,甲城市的销售情况更好')
问题a: 乙城市目前共有饮料自动售货机 2000 台, 估计日销售金额不低于 40 元的数量约为: 1000.0台。
问题b: ---------集中趋势指标----------------
可以推断出甲城市的饮料自动售货机销售情况较好,结论如下:
甲城与乙城均值差为:0.90,甲城均值大于乙城均值
甲城与乙城众数差为:12.00, 甲城众数大于乙城众数
结论:虽然根据离散指标,乙城销售情况更稳定,但甲城市的平均数大于乙城市的平均数,且甲城市的众数大于乙城市的众数,说明甲城市饮料自动售货机的销售金额整体更高,基于集中趋势指标判断,甲城市的销售情况更好


 244
244

 被折叠的 条评论
为什么被折叠?
被折叠的 条评论
为什么被折叠?
 到【灌水乐园】发言


