


 本文详细介绍了在CentOS 7.8系统上使用Zabbix 4.2.8监控MySQL 5.7的全过程,包括Python3环境搭建、MySQL安装与配置、Zabbix-agent部署及监控脚本编写,最终实现数据库性能指标如TPS、QPS及流量监控。
zabbix监控mysql5.7—python3版
一、环境要求,及安装相关环境软件
1、服务器及相关软件环境要求
| 操作系统及服务 | 版本 | IP |
|---|---|---|
| linux系统 | centos7.8 | 10.1.1.3 |
| mysql | 5.7.31 | 10.1.1.3 |
| zabbix-server | 4.2.8 | 10.1.1.135 |
| python3 | 3.6.8-18.el7 | 10.1.1.3 |
2、在数据库服务器安装相关软件(python3,mysql5.7,zabbix-agent等)
01、安装python3
yum -y install python3这里是引用
02、安装mysql5.7
wget -i -c http://dev.mysql.com/get/mysql57-community-release-el7-10.noarch.rpm
yum -y install mysql57-community-release-el7-10.noarch.rpm
yum -y install mysql-community-server
systemctl start mysqld.service
systemctl status mysqld.service
查看密码
grep “password” /var/log/mysqld.log
修改密码
mysql -uroot -p
ALTER USER ‘root’@‘localhost’ IDENTIFIED BY ‘XXXXXXX’;
查看密码策略
show variables like ‘%password%’;
修改密码策略
vim /etc/my.cnf
#添加validate_password_policy配置
validate_password_policy=0
#关闭密码策略
重启服务
systemctl restart mysqld
03、zabbix-agent安装
rpm -ivh http://repo.zabbix.com/zabbix/4.2/rhel/7/x86_64/zabbix-release-4.2-2.el7.noarch.rpm
yum install -y zabbix-agent zabbix-sender
vim /etc/zabbix/zabbix_agentd.conf #修改配置文件
Passive checks related 被动监测相关配置项
Server=10.1.1.135 服务端地址或proxy端地址,多个用,隔开
ListenIP=0.0.0.0 监听的地址,默认所有地址
StartAgents=3 启动agent数量,默认3
Active checks related 主动监测相关配置
ServerActive=10.1.1.135 发送到的服务端IP
Hostname=zabbixserver 本机的hostname
其他默认即可
快速修改方式:
sed -i s#‘Server=127.0.0.1’#‘Server=10.1.1.135’#g /etc/zabbix/zabbix_agentd.conf
sed -i s#‘ServerActive=127.0.0.1’#‘ServerActive=10.1.1.135’#g /etc/zabbix/zabbix_agentd.conf
sed -i s#‘Hostname=Zabbix server’#“Hostname=hostname”#g /etc/zabbix/zabbix_agentd.conf
sed -i s/’# HostMetadata=’/‘HostMetadata=yuegowu.com’/g /etc/zabbix/zabbix_agentd.conf
grep -v -E “#|$” /etc/zabbix/zabbix_agentd.conf
systemctl start zabbix-agent
systemctl status zabbix-agent
二、在mysql数据库服务器编写监控数据获取脚本及配置zabbix-agent
1、编写python3脚本,一共三个脚本文件
01、监控需要获取每隔2秒(我这里取得每隔2秒获取一次数据)得数据
#!/usr/bin/env python
# -*- coding:utf-8 -*-
# @Time    : 2021/3/4 11:00
# @Author  : lufei
import re
import subprocess
import time
import sys
import warnings
warnings.filterwarnings('ignore')
def mysql_init():
    return_code = subprocess.check_output("mysqladmin -uroot -p'xxxxxxx' -h'10.1.1.8' extended-status", shell=True)
    return_code = str(return_code)
    return_code_list = return_code.split('---+')
    mysql_status_str = return_code_list[4]
    mysql_status_list = mysql_status_str.split('\\n')

    return mysql_status_list

for nn in mysql_init():
    # 此循环中的数据需要每隔2秒计算一次,然后再将计算后的数值除以2,计算得出每秒的数据,此为第一次循环
    if re.search('Aborted_clients',nn) :
        # Aborted_clients 由于客户没有正确关闭连接已经死掉,已经放弃的连接数量
        # 这个数值需要在2秒后再做一次取值然后让其数值相减算出2秒的取值
        regx = '(\d+) '
        Aborted_clients1 = re.findall(regx,nn)[0]

    if re.search('Aborted_connects',nn):
        # Aborted_connects尝试已经失败的MySQL服务器的连接的次数
        # 这个数值需要在2秒后再做一次取值然后让其数值相减算出2秒的取值
        regx = '(\d+) '
        Aborted_connects1 = re.findall(regx,nn)[0]

    if re.search('Binlog_cache_disk_use',nn):
        # Binlog_cache_disk_use表示因为我们binlog_cache_size设计的内存不足导致缓存二进制日志用到了临时文件的次数(做监控)
        # 这个数值需要在2秒后再做一次取值然后让其数值相减算出2秒的取值
        regx = '(\d+) '
        Binlog_cache_disk_use1 = re.findall(regx,nn)[0]

    if re.search('Bytes_received',nn):
        # 从所有客户端接收到的字节数。结合bytes sent, 可以作为数据库网卡吞吐量的评测指标,单位字节
        # 这个数值需要在2秒后再做一次取值然后让其数值相减算出2秒的取值
        regx = '(\d+) '
        Bytes_received1 = re.findall(regx,nn)[0]

    if re.search('Bytes_sent',nn):
        # 发送给所有客户端的字节数。结合bytes received,可以作为数据库网卡吞吐量的评测指标,单位字节
        # 这个数值需要在2秒后再做一次取值然后让其数值相减算出2秒的取值
        regx = '(\d+) '
        Bytes_sent1 = re.findall(regx,nn)[0]

    if re.search('Com_commit',nn):
        # MySQL提交的事务数量,可以用来统计TPS(每秒事务数),计算公式:Com_commit/S+Com_rollback/S(做监控)
        # 这个数值需要在2秒后再做一次取值然后让其数值相减算出2秒的取值
        regx = '(\d+) '
        Com_commit1 = re.findall(regx,nn)[0]

    if re.search('Com_rollback ',nn):
        # MySQL回滚的事务数量,可以用来统计TPS(每秒事务数),计算公式:Com_commit/S+Com_rollback/S(做监控)
        # 这个数值需要在2秒后再做一次取值然后让其数值相减算出2秒的取值
        regx = '(\d+) '
        Com_rollback1 = re.findall(regx,nn)[0]

    if re.search('Com_delete ',nn):
        # MySQL删除的数量,可以用来统计qps,计算公式:questions / uptime 或者基于com_%计算:Com_select/s + Com_insert/s + Com_update/s + Com_delete/s(做监控)
        # 这个数值需要在2秒后再做一次取值然后让其数值相减算出2秒的取值
        regx = '(\d+) '
        Com_delete1 = re.findall(regx,nn)[0]

    if re.search('Com_insert ',nn):
        # MySQL插入的数量,可以用来统计qps,qps计算公式:questions / uptime 或者基于com_%计算:Com_select/s + Com_insert/s + Com_update/s + Com_delete/s (做监控)
        # 这个数值需要在2秒后再做一次取值然后让其数值相减算出2秒的取值
        regx = '(\d+) '
        Com_insert1 = re.findall(regx,nn)[0]

    if re.search('Com_update ',nn):
        # MySQL更新的数量,可以用来统计qps,qps计算公式:questions / uptime 或者基于com_%计算:Com_select/s + Com_insert/s + Com_update/s + Com_delete/s(监控)
        # 这个数值需要在2秒后再做一次取值然后让其数值相减算出2秒的取值
        regx = '(\d+) '
        Com_update1 = re.findall(regx,nn)[0]

    if re.search('Com_select',nn):
        # MySQL查询的数量,可以用来统计qps,qps计算公式:questions / uptime 或者基于com_%计算:Com_select/s + Com_insert/s + Com_update/s + Com_delete/s(监控)
        # 这个数值需要在2秒后再做一次取值然后让其数值相减算出2秒的取值
        regx = '(\d+) '
        Com_select1 = re.findall(regx,nn)[0]

    if re.search('Handler_delete',nn):
        # 请求从一张表中删除行的次数。(监控)
        # 这个数值需要在2秒后再做一次取值然后让其数值相减算出2秒的取值
        regx = '(\d+) '
        Handler_delete1 = re.findall(regx,nn)[0]

    if re.search('Questions',nn):
        # 发往服务器的查询的数量。(监控),即mysql的QPS
        # 这个数值需要在2秒后再做一次取值然后让其数值相减算出2秒的取值
        regx = '(\d+) '
        Questions1 = re.findall(regx,nn)[0]

time.sleep(2)

for nn in mysql_init():
    # 此循环中的数据需要每隔60秒计算一次,然后再将计算后的数值除以60,计算得出每秒的数据,此为第二次循环
    if re.search('Aborted_clients',nn) :
        # Aborted_clients 由于客户没有正确关闭连接已经死掉,已经放弃的连接数量
        # 这个数值需要在2秒后再做一次取值然后让其数值相减算出2秒的取值
        regx = '(\d+) '
        Aborted_clients2 = re.findall(regx,nn)[0]

    if re.search('Aborted_connects',nn):
        # Aborted_connects尝试已经失败的MySQL服务器的连接的次数
        # 这个数值需要在2秒后再做一次取值然后让其数值相减算出2秒的取值
        regx = '(\d+) '
        Aborted_connects2 = re.findall(regx,nn)[0]

    if re.search('Binlog_cache_disk_use',nn):
        # Binlog_cache_disk_use表示因为我们binlog_cache_size设计的内存不足导致缓存二进制日志用到了临时文件的次数(做监控)
        # 这个数值需要在2秒后再做一次取值然后让其数值相减算出2秒的取值
        regx = '(\d+) '
        Binlog_cache_disk_use2 = re.findall(regx,nn)[0]

    if re.search('Bytes_received',nn):
        # Bytes_received从所有客户端接收到的字节数。结合bytes sent, 可以作为数据库网卡吞吐量的评测指标,单位字节
        # 这个数值需要在2秒后再做一次取值然后让其数值相减算出2秒的取值
        regx = '(\d+) '
        Bytes_received2 = re.findall(regx,nn)[0]

    if re.search('Bytes_sent',nn):
        # Bytes_sent发送给所有客户端的字节数。结合bytes received,可以作为数据库网卡吞吐量的评测指标,单位字节
        # 这个数值需要在2秒后再做一次取值然后让其数值相减算出2秒的取值
        regx = '(\d+) '
        Bytes_sent2 = re.findall(regx,nn)[0]

    if re.search('Com_commit',nn):
        # MySQL提交的事务数量,可以用来统计TPS(每秒事务数),计算公式:Com_commit/S+Com_rollback/S(做监控)
        # 这个数值需要在2秒后再做一次取值然后让其数值相减算出2秒的取值
        regx = '(\d+) '
        Com_commit2 = re.findall(regx,nn)[0]

    if re.search('Com_rollback ',nn):
        # MySQL回滚的事务数量,可以用来统计TPS(每秒事务数),计算公式:Com_commit/S+Com_rollback/S(做监控)
        # 这个数值需要在2秒后再做一次取值然后让其数值相减算出2秒的取值
        regx = '(\d+) '
        Com_rollback2 = re.findall(regx,nn)[0]

    if re.search('Com_delete ',nn):
        # MySQL删除的数量,可以用来统计qps,计算公式:questions / uptime 或者基于com_%计算:Com_select/s + Com_insert/s + Com_update/s + Com_delete/s(做监控)
        # 这个数值需要在2秒后再做一次取值然后让其数值相减算出2秒的取值
        regx = '(\d+) '
        Com_delete2 = re.findall(regx,nn)[0]

    if re.search('Com_insert ',nn):
        # MySQL插入的数量,可以用来统计qps,qps计算公式:questions / uptime 或者基于com_%计算:Com_select/s + Com_insert/s + Com_update/s + Com_delete/s (做监控)
        # 这个数值需要在2秒后再做一次取值然后让其数值相减算出2秒的取值
        regx = '(\d+) '
        Com_insert2 = re.findall(regx,nn)[0]

    if re.search('Com_update ',nn):
        # MySQL更新的数量,可以用来统计qps,qps计算公式:questions / uptime 或者基于com_%计算:Com_select/s + Com_insert/s + Com_update/s + Com_delete/s(监控)
        # 这个数值需要在2秒后再做一次取值然后让其数值相减算出2秒的取值
        regx = '(\d+) '
        Com_update2 = re.findall(regx,nn)[0]

    if re.search('Com_select',nn):
        # MySQL查询的数量,可以用来统计qps,qps计算公式:questions / uptime 或者基于com_%计算:Com_select/s + Com_insert/s + Com_update/s + Com_delete/s(监控)
        # 这个数值需要在2秒后再做一次取值然后让其数值相减算出2秒的取值
        regx = '(\d+) '
        Com_select2 = re.findall(regx,nn)[0]

    if re.search('Handler_delete',nn):
        # 请求从一张表中删除行的次数。(监控)
        # 这个数值需要在2秒后再做一次取值然后让其数值相减算出2秒的取值
        regx = '(\d+) '
        Handler_delete2 = re.findall(regx,nn)[0]

    if re.search('Questions',nn):
        # Questions发往服务器的查询的数量。(监控),即mysql的QPS
        # 这个数值需要在2秒后再做一次取值然后让其数值相减算出2秒的取值
        regx = '(\d+) '
        Questions2 = re.findall(regx,nn)[0]

def Mysql_TPS():
    # TPS = round(((int(Com_commit2) + int(Com_rollback2)) - (int(Com_commit1) + int(Com_rollback1))) / 60)   # 每秒的TPS,不是实时的每秒是平均的,意义不大
    TPS = ((int(Com_commit2) + int(Com_rollback2)) - (int(Com_commit1) + int(Com_rollback1)))     # 2秒的TPS
    return TPS

def Aborted_clients():
    # 由于客户没有正确关闭连接已经死掉,已经放弃的连接数量
    Abortedcli = int(Aborted_clients2) -int(Aborted_clients1)
    return Abortedcli

def Aborted_connect():
    # Aborted_connects尝试已经失败的MySQL服务器的连接的次数
    Aborted_conn = int(Aborted_connects2) - int(Aborted_connects1)
    return Aborted_conn

def Binlog_cache_disk_use():
    # Binlog_cache_disk_use表示因为我们binlog_cache_size设计的内存不足导致缓存二进制日志用到了临时文件的次数
    Binlog_to_disk = int(Binlog_cache_disk_use2) - int(Binlog_cache_disk_use1)
    return Binlog_to_disk

def Bytes_received():
    # Bytes_received从所有客户端接收到的字节数。结合bytes sent, 可以作为数据库网卡吞吐量的评测指标,单位字节
    Bytes_rec = int(Bytes_received2) - int(Bytes_received1)
    return Bytes_rec

def Bytes_sent():
    # Bytes_sent发送给所有客户端的字节数。结合bytes received,可以作为数据库网卡吞吐量的评测指标,单位字节
    Bytes_st = int(Bytes_sent2) - int(Bytes_sent1)
    return Bytes_st

def totle_Bytes():
    totlebyte = ((int(Bytes_sent2)+int(Bytes_received2)) - (int(Bytes_sent1)+int(Bytes_received1)))
    # 网卡的流出流入的字节总和,2秒内的。
    return totlebyte

def Com_commit():
    # MySQL提交的事务数量,可以用来统计TPS(每秒事务数),计算公式:Com_commit/S+Com_rollback/S
    Com_commit_new = int(Com_commit2) - int(Com_commit1)
    return Com_commit_new

def Com_rollback():
    # MySQL回滚的事务数量,可以用来统计TPS(每秒事务数),计算公式:Com_commit/S+Com_rollback/S
    Com_rollback_new = int(Com_rollback2) - int(Com_rollback1)
    return Com_rollback_new

def Com_delete():
    # MySQL删除的数量,可以用来统计qps,计算公式:questions / uptime 或者基于com_%计算:Com_select/s + Com_insert/s + Com_update/s + Com_delete/s
    Com_delete_new = int(Com_delete2) - int(Com_delete1)
    return Com_delete_new

def Com_insert():
    # MySQL插入的数量,可以用来统计qps,qps计算公式:questions / uptime 或者基于com_%计算:Com_select/s + Com_insert/s + Com_update/s + Com_delete/s
    Com_insert_new = int(Com_insert2) - int(Com_insert1)
    return Com_insert_new

def Com_update():
    # MySQL更新的数量,可以用来统计qps,qps计算公式:questions / uptime 或者基于com_%计算:Com_select/s + Com_insert/s + Com_update/s + Com_delete/s
    Com_update_new = int(Com_update2) - int(Com_update1)
    return Com_update_new

def Com_select():
    # MySQL查询的数量,可以用来统计qps,qps计算公式:questions / uptime 或者基于com_%计算:Com_select/s + Com_insert/s + Com_update/s + Com_delete/s
    Com_select_new = int(Com_select2) - int(Com_select1)
    return Com_select_new

def Questions():
    # Questions发往服务器的查询的数量。(监控),即mysql的QPS
    Questions_new = int(Questions2) - int(Questions1)
    return Questions_new

switch = {'Mysql_TPS': Mysql_TPS,                # 注意此处不要加括号
          'Aborted_clients': Aborted_clients,
          'Aborted_connect': Aborted_connect,
          'Binlog_cache_disk_use': Binlog_cache_disk_use,
          'Bytes_received': Bytes_received,
          'Bytes_sent': Bytes_sent,
          'totle_Bytes': totle_Bytes,
          'Com_commit': Com_commit,
          'Com_rollback': Com_rollback,
          'Com_delete': Com_delete,
          'Com_insert': Com_insert,
          'Com_update': Com_update,
          'Com_select': Com_select,
          'Questions': Questions,
          }
# choice = sys.argv[1]
choice = 'Questions'
print(switch.get(choice)())
备注:脚本中的数据库密码需要自行填写。
02、获取数据库存活及链接状态脚本
#!/usr/bin/env python
# -*- coding:utf-8 -*-
# @Time    : 2021/3/5 14:25
# @Author  : lufei
import re
import os
import subprocess
import time
import sys
def mysql_init():
    return_code = subprocess.check_output("mysqladmin -uroot -p'xxxxxxx' -h'10.1.1.8' extended-status", shell=True)
    return_code = str(return_code)
    return_code_list = return_code.split('---+')
    mysql_status_str = return_code_list[4]
    mysql_status_list = mysql_status_str.split('\\n')

    return mysql_status_list

def mysql_status():
    mysql_sta = subprocess.check_output("mysqladmin -uroot -p'xxxxxxx' -h'10.1.1.8'  ping|grep 'mysqld is alive'|wc -l", shell=True)
    # mysql_stat_num = filter(str.isdigit,  str(mysql_sta) )
    mysql_stat_num = int(re.findall(r'\d+', str(mysql_sta))[0])
    return mysql_stat_num

for one_data in mysql_init():
    # 此循环为只需一次获得的结果
    if re.search('Com_create_procedure', one_data):
        # Com_create_procedure创建存储过程个数(监控)
        regx = '(\d+) '
        Com_create_procedure = re.findall(regx, one_data)[0]

    if re.search('Max_used_connections ',one_data):
        # Max_used_connections同时使用的连接的最大数目。(监控)
        regx = '(\d+) '
        Max_used_connections = re.findall(regx,one_data)[0]

    if re.search('Com_create_table', one_data):
        # Com_create_table创建数据表个数(监控)
        regx = '(\d+) '
        Com_create_table = re.findall(regx, one_data)[0]

    if re.search('Com_lock_tables', one_data):
        # Com_lock_tables锁表lock tables,解锁命令unlock tables
        regx = '(\d+) '
        Com_lock_tables = re.findall(regx, one_data)[0]

    if re.search('Open_tables', one_data):
        # Open_tables打开表的数量。(监控)
        regx = '(\d+) '
        Open_tables = re.findall(regx, one_data)[0]

    if re.search('Open_files', one_data):
        # Open_files打开文件的数量。(监控)
        regx = '(\d+) '
        Open_files = re.findall(regx, one_data)[0]

    if re.search('Threads_connected', one_data):
        # Threads_connected当前打开的连接的数量。(监控)
        regx = '(\d+) '
        Threads_connected = re.findall(regx, one_data)[0]

    if re.search('Threads_running', one_data):
        # Threads_running不在睡眠的线程数量。(监控)
        regx = '(\d+) '
        Threads_running = re.findall(regx, one_data)[0]

    if re.search('Uptime ', one_data):
        # Uptime 不在睡眠的线程数量。(监控)
        regx = '(\d+) '
        Uptime = round(int(re.findall(regx, one_data)[0]) / 86400)


def Com_create_proc():
    # Com_create_procedure创建存储过程个数
    return Com_create_procedure

def Max_used_conn():
    # Max_used_connections同时使用的连接的最大数目
    return Max_used_connections

def Com_create_tab():
    # Com_create_table创建数据表个数
    return Com_create_table

def Com_lock_tab():
    # Com_lock_tables锁表lock tables,解锁命令unlock tables
    return Com_lock_tables

def Open_tab():
    # Open_tables打开表的数量
    return Open_tables

def Open_file():
    # Open_files打开文件的数量
    return Open_files

def Threads_conn():
    # Threads_connected当前打开的连接的数量
    return Threads_connected

def Threads_run():
    # Threads_running不在睡眠的线程数量
    return Threads_running

def UpTime():
    # Uptime 不在睡眠的线程数量
    return int(Uptime)


switch = {'Com_create_proce': Com_create_proc,                # 注意此处不要加括号
          'Max_used_connections': Max_used_conn,
          'Com_create_table': Com_create_tab,
          'Com_lock_tables': Com_lock_tab,
          'Open_tables': Open_tab,
          'Open_files': Open_file,
          'Threads_connected': Threads_conn,
          'Threads_running': Threads_run,
          'Uptime': UpTime,
          'mysql_stat': mysql_status,
          }
choice = sys.argv[1]
# choice = 'mysql_slave_delay'
print(switch.get(choice)())
备注:脚本中的数据库密码需要自行填写。
03、获取数据库主从同步状态及延时脚本
#!/usr/bin/env python
# -*- coding:utf-8 -*-
# @Time    : 2021/3/8 10:47
# @Author  : lufei

import re
import os
import subprocess
import time
import sys

def mysql_master_slave_status():
    mysql_slave_status = subprocess.check_output("mysql -uroot -p'xxxxxxx' -h'10.1.1.3' -e 'show slave status\G'|grep '_Running: Yes' |wc -l", shell=True)
    mysql_slave_num = int(re.findall(r'\d+', str(mysql_slave_status))[0])
    return mysql_slave_num

def mysql_slave_delay():
    mysql_slave_delay_new = subprocess.check_output("mysql -uroot -p'xxxxxxx' -h'10.1.1.3' -e 'show slave status\G'|grep 'Seconds_Behind_Master'", shell=True)
    mysql_slave_delay_num = int(re.findall(r'\d+', str(mysql_slave_delay_new))[0])
    return mysql_slave_delay_num

switch = {'mysql_slave_status': mysql_master_slave_status,
          'mysql_slave_delay': mysql_slave_delay
          }
choice = sys.argv[1]
# choice = 'mysql_slave_delay'
print(switch.get(choice)())
备注:脚本中的数据库密码需要自行填写。
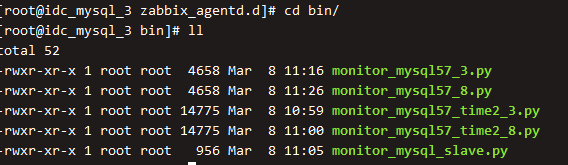
04、将脚本添加执行权限
chmod +x /etc/zabbix/zabbix_agentd.d/bin/*
2、配置mysql服务器得zabbix-agent客户端
创建脚本存放目录
cd /etc/zabbix/zabbix_agentd.d/
mkdir bin
将脚本文件考本指定得目录
创建配置文件
cd …
vim mysql_status57_3.conf
UserParameter=mysql_status_57[*],python3 -W ignore /etc/zabbix/zabbix_agentd.d/bin/monitor_mysql57_3.py $1 2>/dev/null
vim mysql_status_monitor_3.conf
UserParameter=mysql_status[*],python3 -W ignore /etc/zabbix/zabbix_agentd.d/bin/monitor_mysql57_time2_3.py $1 2>/dev/null
vim mysql_slave.conf
UserParameter=mysql_slave[*],python3 -W ignore /etc/zabbix/zabbix_agentd.d/bin/monitor_mysql_slave.py $1 2>/dev/null
重启服务:
systemctl restart zabbix-agent
服务端测试:
zabbix_get -s 10.1.1.3 -p10050 -k “mysql_status_57_8[mysql_stat]”

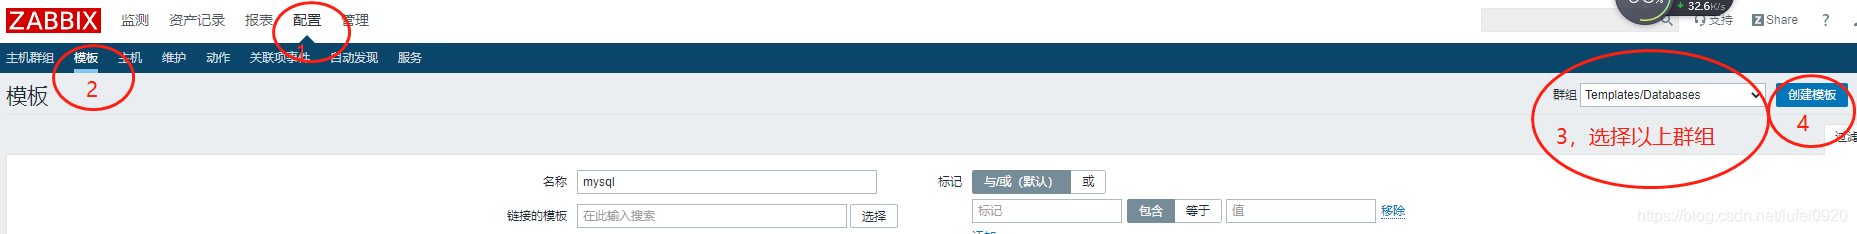
三、zabbix-server端的web界面配置

1、配置模板
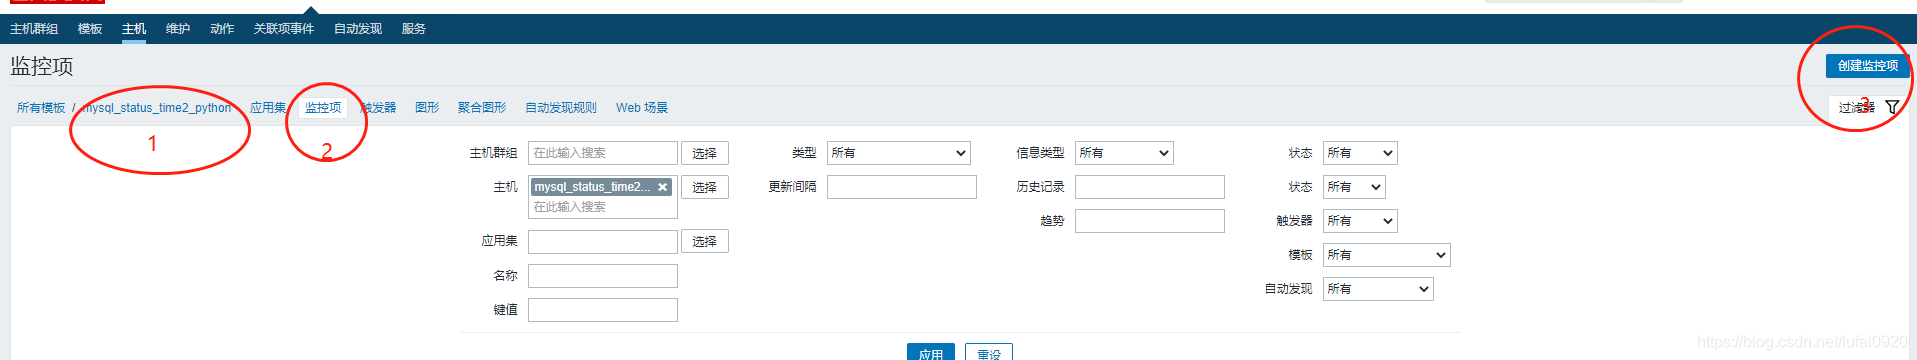
 创建完成后点击进入模板后创建监控项:
 其他值不变,
其他监控项自行添加
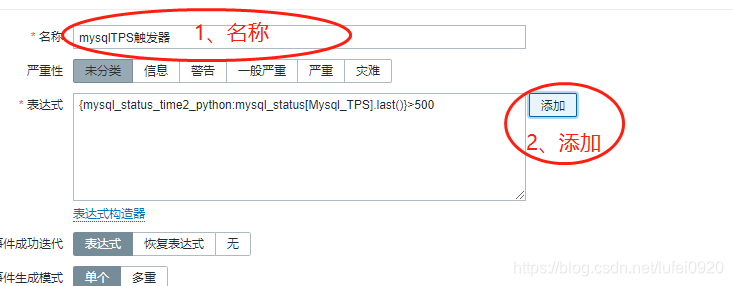
创建触发器:
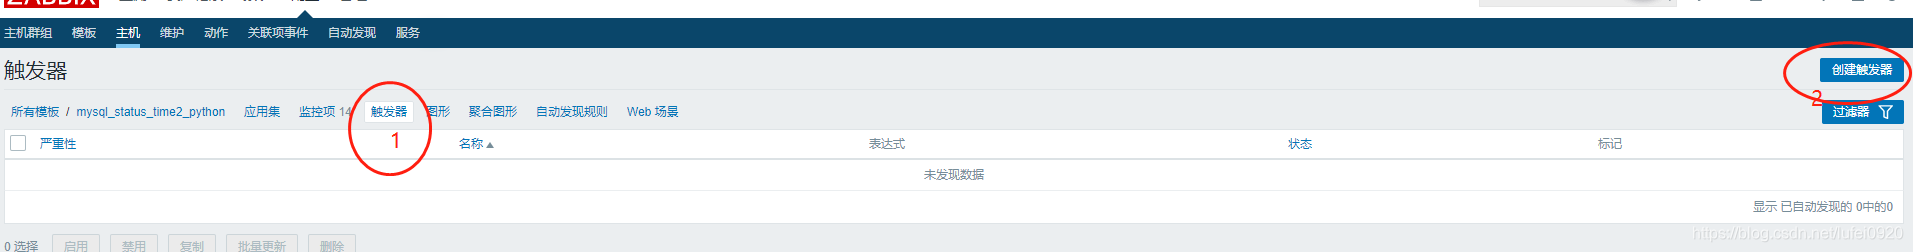
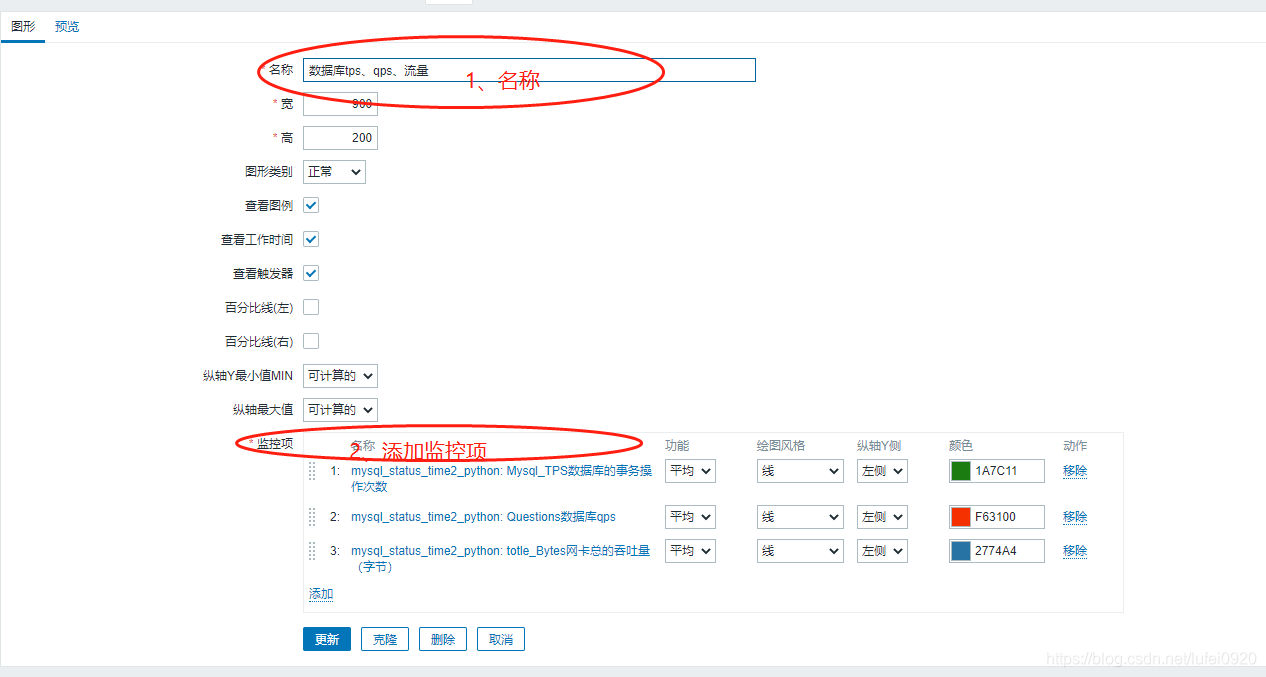
 图形创建:
图形创建:
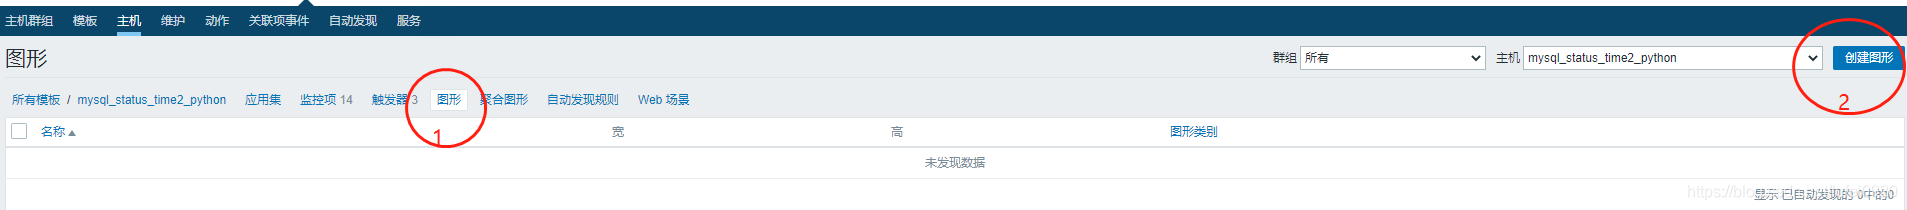
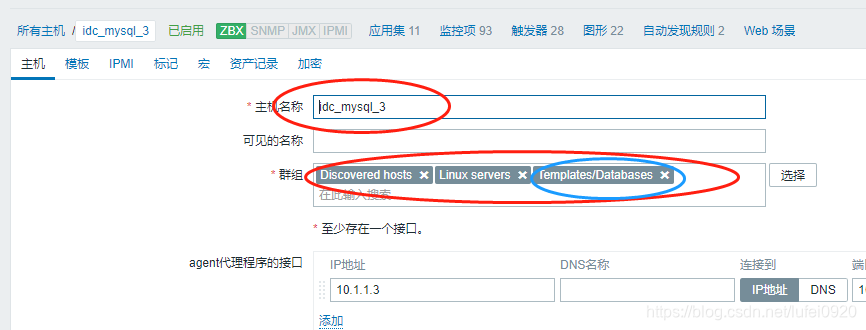
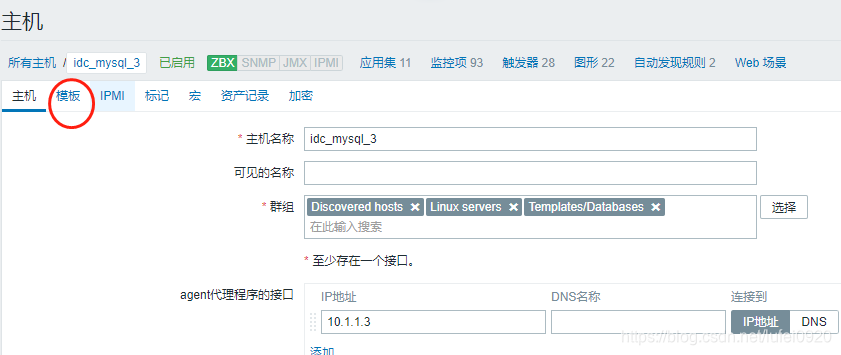
配置主机监控:

找到相应主机,如没有则添加(添加过程略):

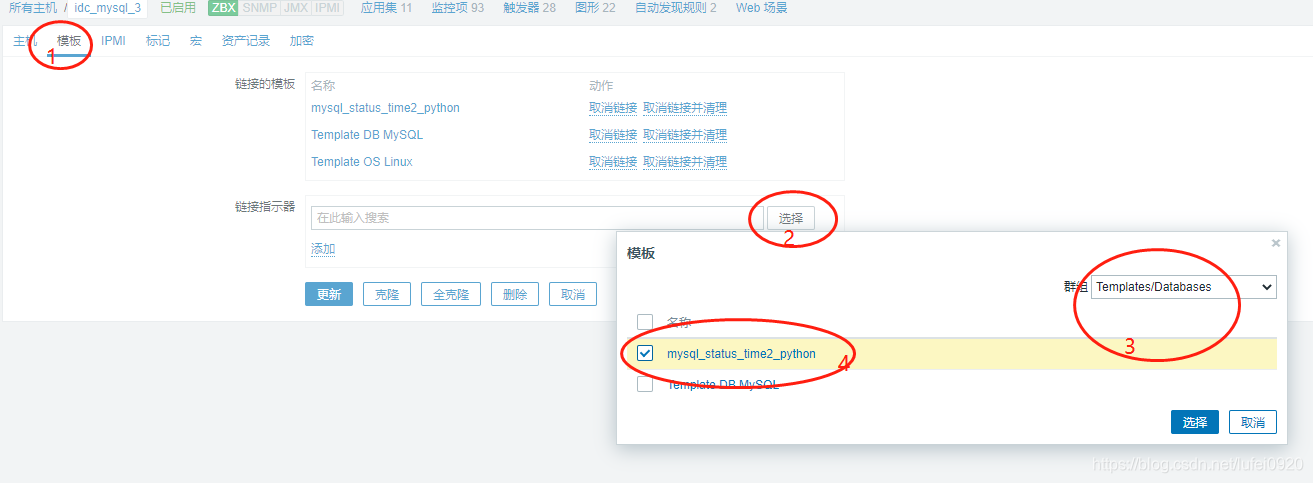 添加完成,这样就完成mysql的监控,其他监控项需要自行添加操作
2、模板文件
01、mysql_slave_python.xml 主从监控
<?xml version="1.0" encoding="UTF-8"?>
<zabbix_export>
<version>4.2</version>
<date>2021-03-15T01:13:40Z</date>
<groups>
<group>
<name>Templates/Databases</name>
</group>
</groups>
<templates>
<template>
<template>mysql_slave_python</template>
<name>mysql_slave_python</name>
<description/>
<groups>
<group>
<name>Templates/Databases</name>
</group>
</groups>
<applications>
<application>
<name>mysql_python</name>
</application>
</applications>
<items>
<item>
<name>mysql主从延迟时间</name>
<type>0</type>
<snmp_community/>
<snmp_oid/>
<key>mysql_slave[mysql_slave_delay]</key>
<delay>30s</delay>
<history>90d</history>
<trends>365d</trends>
<status>0</status>
<value_type>3</value_type>
<allowed_hosts/>
<units/>
<snmpv3_contextname/>
<snmpv3_securityname/>
<snmpv3_securitylevel>0</snmpv3_securitylevel>
<snmpv3_authprotocol>0</snmpv3_authprotocol>
<snmpv3_authpassphrase/>
<snmpv3_privprotocol>0</snmpv3_privprotocol>
<snmpv3_privpassphrase/>
<params/>
<ipmi_sensor/>
<authtype>0</authtype>
<username/>
<password/>
<publickey/>
<privatekey/>
<port/>
<description/>
<inventory_link>0</inventory_link>
<applications/>
<valuemap/>
<logtimefmt/>
<preprocessing/>
<jmx_endpoint/>
<timeout>3s</timeout>
<url/>
<query_fields/>
<posts/>
<status_codes>200</status_codes>
<follow_redirects>1</follow_redirects>
<post_type>0</post_type>
<http_proxy/>
<headers/>
<retrieve_mode>0</retrieve_mode>
<request_method>0</request_method>
<output_format>0</output_format>
<allow_traps>0</allow_traps>
<ssl_cert_file/>
<ssl_key_file/>
<ssl_key_password/>
<verify_peer>0</verify_peer>
<verify_host>0</verify_host>
<master_item/>
</item>
<item>
<name>mysql_slave_status数据库监控状态</name>
<type>0</type>
<snmp_community/>
<snmp_oid/>
<key>mysql_slave[mysql_slave_status]</key>
<delay>30s</delay>
<history>90d</history>
<trends>365d</trends>
<status>0</status>
<value_type>3</value_type>
<allowed_hosts/>
<units/>
<snmpv3_contextname/>
<snmpv3_securityname/>
<snmpv3_securitylevel>0</snmpv3_securitylevel>
<snmpv3_authprotocol>0</snmpv3_authprotocol>
<snmpv3_authpassphrase/>
<snmpv3_privprotocol>0</snmpv3_privprotocol>
<snmpv3_privpassphrase/>
<params/>
<ipmi_sensor/>
<authtype>0</authtype>
<username/>
<password/>
<publickey/>
<privatekey/>
<port/>
<description/>
<inventory_link>0</inventory_link>
<applications/>
<valuemap/>
<logtimefmt/>
<preprocessing/>
<jmx_endpoint/>
<timeout>3s</timeout>
<url/>
<query_fields/>
<posts/>
<status_codes>200</status_codes>
<follow_redirects>1</follow_redirects>
<post_type>0</post_type>
<http_proxy/>
<headers/>
<retrieve_mode>0</retrieve_mode>
<request_method>0</request_method>
<output_format>0</output_format>
<allow_traps>0</allow_traps>
<ssl_cert_file/>
<ssl_key_file/>
<ssl_key_password/>
<verify_peer>0</verify_peer>
<verify_host>0</verify_host>
<master_item/>
</item>
</items>
<discovery_rules/>
<httptests/>
<macros/>
<templates/>
<screens/>
<tags/>
</template>
</templates>
<triggers>
<trigger>
<expression>{mysql_slave_python:mysql_slave[mysql_slave_status].last()}<2</expression>
<recovery_mode>0</recovery_mode>
<recovery_expression/>
<name>mysql_slave_status</name>
<correlation_mode>0</correlation_mode>
<correlation_tag/>
<url/>
<status>0</status>
<priority>4</priority>
<description/>
<type>0</type>
<manual_close>0</manual_close>
<dependencies/>
<tags/>
</trigger>
<trigger>
<expression>{mysql_slave_python:mysql_slave[mysql_slave_delay].last()}>900</expression>
<recovery_mode>0</recovery_mode>
<recovery_expression/>
<name>mysql主从延迟900</name>
<correlation_mode>0</correlation_mode>
<correlation_tag/>
<url/>
<status>0</status>
<priority>3</priority>
<description/>
<type>0</type>
<manual_close>0</manual_close>
<dependencies/>
<tags/>
</trigger>
<trigger>
<expression>{mysql_slave_python:mysql_slave[mysql_slave_status].last()}>1200</expression>
<recovery_mode>0</recovery_mode>
<recovery_expression/>
<name>mysql主从延迟1200</name>
<correlation_mode>0</correlation_mode>
<correlation_tag/>
<url/>
<status>0</status>
<priority>4</priority>
<description/>
<type>0</type>
<manual_close>0</manual_close>
<dependencies/>
<tags/>
</trigger>
</triggers>
<graphs>
<graph>
<name>mysql主从同步图形</name>
<width>900</width>
<height>200</height>
<yaxismin>0.0000</yaxismin>
<yaxismax>100.0000</yaxismax>
<show_work_period>1</show_work_period>
<show_triggers>1</show_triggers>
<type>0</type>
<show_legend>1</show_legend>
<show_3d>0</show_3d>
<percent_left>0.0000</percent_left>
<percent_right>0.0000</percent_right>
<ymin_type_1>0</ymin_type_1>
<ymax_type_1>0</ymax_type_1>
<ymin_item_1>0</ymin_item_1>
<ymax_item_1>0</ymax_item_1>
<graph_items>
<graph_item>
<sortorder>0</sortorder>
<drawtype>0</drawtype>
<color>1A7C11</color>
<yaxisside>0</yaxisside>
<calc_fnc>2</calc_fnc>
<type>0</type>
<item>
<host>mysql_slave_python</host>
<key>mysql_slave[mysql_slave_status]</key>
</item>
</graph_item>
</graph_items>
</graph>
<graph>
<name>mysql主从延迟</name>
<width>900</width>
<height>200</height>
<yaxismin>0.0000</yaxismin>
<yaxismax>100.0000</yaxismax>
<show_work_period>1</show_work_period>
<show_triggers>1</show_triggers>
<type>0</type>
<show_legend>1</show_legend>
<show_3d>0</show_3d>
<percent_left>0.0000</percent_left>
<percent_right>0.0000</percent_right>
<ymin_type_1>0</ymin_type_1>
<ymax_type_1>0</ymax_type_1>
<ymin_item_1>0</ymin_item_1>
<ymax_item_1>0</ymax_item_1>
<graph_items>
<graph_item>
<sortorder>0</sortorder>
<drawtype>0</drawtype>
<color>1A7C11</color>
<yaxisside>0</yaxisside>
<calc_fnc>2</calc_fnc>
<type>0</type>
<item>
<host>mysql_slave_python</host>
<key>mysql_slave[mysql_slave_delay]</key>
</item>
</graph_item>
</graph_items>
</graph>
</graphs>
</zabbix_export>
02、mysql_status_python_57.xml mysql数据库状态监控
<?xml version="1.0" encoding="UTF-8"?>
<zabbix_export>
<version>4.2</version>
<date>2021-03-15T01:14:03Z</date>
<groups>
<group>
<name>Templates/Databases</name>
</group>
</groups>
<templates>
<template>
<template>mysql_status_python_57</template>
<name>mysql_status_python_57</name>
<description/>
<groups>
<group>
<name>Templates/Databases</name>
</group>
</groups>
<applications>
<application>
<name>msyql_python</name>
</application>
</applications>
<items>
<item>
<name>Com_create_procedure创建存储过程个数</name>
<type>0</type>
<snmp_community/>
<snmp_oid/>
<key>mysql_status57[Com_create_proce]</key>
<delay>30s</delay>
<history>90d</history>
<trends>365d</trends>
<status>0</status>
<value_type>3</value_type>
<allowed_hosts/>
<units/>
<snmpv3_contextname/>
<snmpv3_securityname/>
<snmpv3_securitylevel>0</snmpv3_securitylevel>
<snmpv3_authprotocol>0</snmpv3_authprotocol>
<snmpv3_authpassphrase/>
<snmpv3_privprotocol>0</snmpv3_privprotocol>
<snmpv3_privpassphrase/>
<params/>
<ipmi_sensor/>
<authtype>0</authtype>
<username/>
<password/>
<publickey/>
<privatekey/>
<port/>
<description/>
<inventory_link>0</inventory_link>
<applications/>
<valuemap/>
<logtimefmt/>
<preprocessing/>
<jmx_endpoint/>
<timeout>3s</timeout>
<url/>
<query_fields/>
<posts/>
<status_codes>200</status_codes>
<follow_redirects>1</follow_redirects>
<post_type>0</post_type>
<http_proxy/>
<headers/>
<retrieve_mode>0</retrieve_mode>
<request_method>0</request_method>
<output_format>0</output_format>
<allow_traps>0</allow_traps>
<ssl_cert_file/>
<ssl_key_file/>
<ssl_key_password/>
<verify_peer>0</verify_peer>
<verify_host>0</verify_host>
<master_item/>
</item>
<item>
<name>Com_create_table创建数据表个数</name>
<type>0</type>
<snmp_community/>
<snmp_oid/>
<key>mysql_status57[Com_create_table]</key>
<delay>30s</delay>
<history>90d</history>
<trends>365d</trends>
<status>0</status>
<value_type>3</value_type>
<allowed_hosts/>
<units/>
<snmpv3_contextname/>
<snmpv3_securityname/>
<snmpv3_securitylevel>0</snmpv3_securitylevel>
<snmpv3_authprotocol>0</snmpv3_authprotocol>
<snmpv3_authpassphrase/>
<snmpv3_privprotocol>0</snmpv3_privprotocol>
<snmpv3_privpassphrase/>
<params/>
<ipmi_sensor/>
<authtype>0</authtype>
<username/>
<password/>
<publickey/>
<privatekey/>
<port/>
<description/>
<inventory_link>0</inventory_link>
<applications/>
<valuemap/>
<logtimefmt/>
<preprocessing/>
<jmx_endpoint/>
<timeout>3s</timeout>
<url/>
<query_fields/>
<posts/>
<status_codes>200</status_codes>
<follow_redirects>1</follow_redirects>
<post_type>0</post_type>
<http_proxy/>
<headers/>
<retrieve_mode>0</retrieve_mode>
<request_method>0</request_method>
<output_format>0</output_format>
<allow_traps>0</allow_traps>
<ssl_cert_file/>
<ssl_key_file/>
<ssl_key_password/>
<verify_peer>0</verify_peer>
<verify_host>0</verify_host>
<master_item/>
</item>
<item>
<name>Com_lock_tables锁表lock tables</name>
<type>0</type>
<snmp_community/>
<snmp_oid/>
<key>mysql_status57[Com_lock_tables]</key>
<delay>30s</delay>
<history>90d</history>
<trends>365d</trends>
<status>0</status>
<value_type>3</value_type>
<allowed_hosts/>
<units/>
<snmpv3_contextname/>
<snmpv3_securityname/>
<snmpv3_securitylevel>0</snmpv3_securitylevel>
<snmpv3_authprotocol>0</snmpv3_authprotocol>
<snmpv3_authpassphrase/>
<snmpv3_privprotocol>0</snmpv3_privprotocol>
<snmpv3_privpassphrase/>
<params/>
<ipmi_sensor/>
<authtype>0</authtype>
<username/>
<password/>
<publickey/>
<privatekey/>
<port/>
<description/>
<inventory_link>0</inventory_link>
<applications/>
<valuemap/>
<logtimefmt/>
<preprocessing/>
<jmx_endpoint/>
<timeout>3s</timeout>
<url/>
<query_fields/>
<posts/>
<status_codes>200</status_codes>
<follow_redirects>1</follow_redirects>
<post_type>0</post_type>
<http_proxy/>
<headers/>
<retrieve_mode>0</retrieve_mode>
<request_method>0</request_method>
<output_format>0</output_format>
<allow_traps>0</allow_traps>
<ssl_cert_file/>
<ssl_key_file/>
<ssl_key_password/>
<verify_peer>0</verify_peer>
<verify_host>0</verify_host>
<master_item/>
</item>
<item>
<name>Max_used_connections同时使用的连接的最大数目</name>
<type>0</type>
<snmp_community/>
<snmp_oid/>
<key>mysql_status57[Max_used_connections]</key>
<delay>30s</delay>
<history>90d</history>
<trends>365d</trends>
<status>0</status>
<value_type>3</value_type>
<allowed_hosts/>
<units/>
<snmpv3_contextname/>
<snmpv3_securityname/>
<snmpv3_securitylevel>0</snmpv3_securitylevel>
<snmpv3_authprotocol>0</snmpv3_authprotocol>
<snmpv3_authpassphrase/>
<snmpv3_privprotocol>0</snmpv3_privprotocol>
<snmpv3_privpassphrase/>
<params/>
<ipmi_sensor/>
<authtype>0</authtype>
<username/>
<password/>
<publickey/>
<privatekey/>
<port/>
<description/>
<inventory_link>0</inventory_link>
<applications/>
<valuemap/>
<logtimefmt/>
<preprocessing/>
<jmx_endpoint/>
<timeout>3s</timeout>
<url/>
<query_fields/>
<posts/>
<status_codes>200</status_codes>
<follow_redirects>1</follow_redirects>
<post_type>0</post_type>
<http_proxy/>
<headers/>
<retrieve_mode>0</retrieve_mode>
<request_method>0</request_method>
<output_format>0</output_format>
<allow_traps>0</allow_traps>
<ssl_cert_file/>
<ssl_key_file/>
<ssl_key_password/>
<verify_peer>0</verify_peer>
<verify_host>0</verify_host>
<master_item/>
</item>
<item>
<name>mysql存活状态</name>
<type>0</type>
<snmp_community/>
<snmp_oid/>
<key>mysql_status57[mysql_stat]</key>
<delay>30s</delay>
<history>90d</history>
<trends>365d</trends>
<status>0</status>
<value_type>3</value_type>
<allowed_hosts/>
<units/>
<snmpv3_contextname/>
<snmpv3_securityname/>
<snmpv3_securitylevel>0</snmpv3_securitylevel>
<snmpv3_authprotocol>0</snmpv3_authprotocol>
<snmpv3_authpassphrase/>
<snmpv3_privprotocol>0</snmpv3_privprotocol>
<snmpv3_privpassphrase/>
<params/>
<ipmi_sensor/>
<authtype>0</authtype>
<username/>
<password/>
<publickey/>
<privatekey/>
<port/>
<description/>
<inventory_link>0</inventory_link>
<applications/>
<valuemap/>
<logtimefmt/>
<preprocessing/>
<jmx_endpoint/>
<timeout>3s</timeout>
<url/>
<query_fields/>
<posts/>
<status_codes>200</status_codes>
<follow_redirects>1</follow_redirects>
<post_type>0</post_type>
<http_proxy/>
<headers/>
<retrieve_mode>0</retrieve_mode>
<request_method>0</request_method>
<output_format>0</output_format>
<allow_traps>0</allow_traps>
<ssl_cert_file/>
<ssl_key_file/>
<ssl_key_password/>
<verify_peer>0</verify_peer>
<verify_host>0</verify_host>
<master_item/>
</item>
<item>
<name>Open_files打开文件的数量</name>
<type>0</type>
<snmp_community/>
<snmp_oid/>
<key>mysql_status57[Open_files]</key>
<delay>30s</delay>
<history>90d</history>
<trends>365d</trends>
<status>0</status>
<value_type>3</value_type>
<allowed_hosts/>
<units/>
<snmpv3_contextname/>
<snmpv3_securityname/>
<snmpv3_securitylevel>0</snmpv3_securitylevel>
<snmpv3_authprotocol>0</snmpv3_authprotocol>
<snmpv3_authpassphrase/>
<snmpv3_privprotocol>0</snmpv3_privprotocol>
<snmpv3_privpassphrase/>
<params/>
<ipmi_sensor/>
<authtype>0</authtype>
<username/>
<password/>
<publickey/>
<privatekey/>
<port/>
<description/>
<inventory_link>0</inventory_link>
<applications/>
<valuemap/>
<logtimefmt/>
<preprocessing/>
<jmx_endpoint/>
<timeout>3s</timeout>
<url/>
<query_fields/>
<posts/>
<status_codes>200</status_codes>
<follow_redirects>1</follow_redirects>
<post_type>0</post_type>
<http_proxy/>
<headers/>
<retrieve_mode>0</retrieve_mode>
<request_method>0</request_method>
<output_format>0</output_format>
<allow_traps>0</allow_traps>
<ssl_cert_file/>
<ssl_key_file/>
<ssl_key_password/>
<verify_peer>0</verify_peer>
<verify_host>0</verify_host>
<master_item/>
</item>
<item>
<name>Open_tables打开表的数量</name>
<type>0</type>
<snmp_community/>
<snmp_oid/>
<key>mysql_status57[Open_tables]</key>
<delay>30s</delay>
<history>90d</history>
<trends>365d</trends>
<status>0</status>
<value_type>3</value_type>
<allowed_hosts/>
<units/>
<snmpv3_contextname/>
<snmpv3_securityname/>
<snmpv3_securitylevel>0</snmpv3_securitylevel>
<snmpv3_authprotocol>0</snmpv3_authprotocol>
<snmpv3_authpassphrase/>
<snmpv3_privprotocol>0</snmpv3_privprotocol>
<snmpv3_privpassphrase/>
<params/>
<ipmi_sensor/>
<authtype>0</authtype>
<username/>
<password/>
<publickey/>
<privatekey/>
<port/>
<description/>
<inventory_link>0</inventory_link>
<applications/>
<valuemap/>
<logtimefmt/>
<preprocessing/>
<jmx_endpoint/>
<timeout>3s</timeout>
<url/>
<query_fields/>
<posts/>
<status_codes>200</status_codes>
<follow_redirects>1</follow_redirects>
<post_type>0</post_type>
<http_proxy/>
<headers/>
<retrieve_mode>0</retrieve_mode>
<request_method>0</request_method>
<output_format>0</output_format>
<allow_traps>0</allow_traps>
<ssl_cert_file/>
<ssl_key_file/>
<ssl_key_password/>
<verify_peer>0</verify_peer>
<verify_host>0</verify_host>
<master_item/>
</item>
<item>
<name>Threads_connected当前打开的连接的数量</name>
<type>0</type>
<snmp_community/>
<snmp_oid/>
<key>mysql_status57[Threads_connected]</key>
<delay>30s</delay>
<history>90d</history>
<trends>365d</trends>
<status>0</status>
<value_type>3</value_type>
<allowed_hosts/>
<units/>
<snmpv3_contextname/>
<snmpv3_securityname/>
<snmpv3_securitylevel>0</snmpv3_securitylevel>
<snmpv3_authprotocol>0</snmpv3_authprotocol>
<snmpv3_authpassphrase/>
<snmpv3_privprotocol>0</snmpv3_privprotocol>
<snmpv3_privpassphrase/>
<params/>
<ipmi_sensor/>
<authtype>0</authtype>
<username/>
<password/>
<publickey/>
<privatekey/>
<port/>
<description/>
<inventory_link>0</inventory_link>
<applications/>
<valuemap/>
<logtimefmt/>
<preprocessing/>
<jmx_endpoint/>
<timeout>3s</timeout>
<url/>
<query_fields/>
<posts/>
<status_codes>200</status_codes>
<follow_redirects>1</follow_redirects>
<post_type>0</post_type>
<http_proxy/>
<headers/>
<retrieve_mode>0</retrieve_mode>
<request_method>0</request_method>
<output_format>0</output_format>
<allow_traps>0</allow_traps>
<ssl_cert_file/>
<ssl_key_file/>
<ssl_key_password/>
<verify_peer>0</verify_peer>
<verify_host>0</verify_host>
<master_item/>
</item>
<item>
<name>Threads_running不在睡眠的线程数量</name>
<type>0</type>
<snmp_community/>
<snmp_oid/>
<key>mysql_status57[Threads_running]</key>
<delay>30s</delay>
<history>90d</history>
<trends>365d</trends>
<status>0</status>
<value_type>3</value_type>
<allowed_hosts/>
<units/>
<snmpv3_contextname/>
<snmpv3_securityname/>
<snmpv3_securitylevel>0</snmpv3_securitylevel>
<snmpv3_authprotocol>0</snmpv3_authprotocol>
<snmpv3_authpassphrase/>
<snmpv3_privprotocol>0</snmpv3_privprotocol>
<snmpv3_privpassphrase/>
<params/>
<ipmi_sensor/>
<authtype>0</authtype>
<username/>
<password/>
<publickey/>
<privatekey/>
<port/>
<description/>
<inventory_link>0</inventory_link>
<applications/>
<valuemap/>
<logtimefmt/>
<preprocessing/>
<jmx_endpoint/>
<timeout>3s</timeout>
<url/>
<query_fields/>
<posts/>
<status_codes>200</status_codes>
<follow_redirects>1</follow_redirects>
<post_type>0</post_type>
<http_proxy/>
<headers/>
<retrieve_mode>0</retrieve_mode>
<request_method>0</request_method>
<output_format>0</output_format>
<allow_traps>0</allow_traps>
<ssl_cert_file/>
<ssl_key_file/>
<ssl_key_password/>
<verify_peer>0</verify_peer>
<verify_host>0</verify_host>
<master_item/>
</item>
<item>
<name>Uptime 数据库启动到现在的时间(秒)</name>
<type>0</type>
<snmp_community/>
<snmp_oid/>
<key>mysql_status57[Uptime]</key>
<delay>30s</delay>
<history>90d</history>
<trends>365d</trends>
<status>0</status>
<value_type>3</value_type>
<allowed_hosts/>
<units/>
<snmpv3_contextname/>
<snmpv3_securityname/>
<snmpv3_securitylevel>0</snmpv3_securitylevel>
<snmpv3_authprotocol>0</snmpv3_authprotocol>
<snmpv3_authpassphrase/>
<snmpv3_privprotocol>0</snmpv3_privprotocol>
<snmpv3_privpassphrase/>
<params/>
<ipmi_sensor/>
<authtype>0</authtype>
<username/>
<password/>
<publickey/>
<privatekey/>
<port/>
<description/>
<inventory_link>0</inventory_link>
<applications/>
<valuemap/>
<logtimefmt/>
<preprocessing/>
<jmx_endpoint/>
<timeout>3s</timeout>
<url/>
<query_fields/>
<posts/>
<status_codes>200</status_codes>
<follow_redirects>1</follow_redirects>
<post_type>0</post_type>
<http_proxy/>
<headers/>
<retrieve_mode>0</retrieve_mode>
<request_method>0</request_method>
<output_format>0</output_format>
<allow_traps>0</allow_traps>
<ssl_cert_file/>
<ssl_key_file/>
<ssl_key_password/>
<verify_peer>0</verify_peer>
<verify_host>0</verify_host>
<master_item/>
</item>
</items>
<discovery_rules/>
<httptests/>
<macros/>
<templates/>
<screens/>
<tags/>
</template>
</templates>
<triggers>
<trigger>
<expression>{mysql_status_python_57:mysql_status57[mysql_stat].last()}<1</expression>
<recovery_mode>0</recovery_mode>
<recovery_expression/>
<name>mysql运行状态</name>
<correlation_mode>0</correlation_mode>
<correlation_tag/>
<url/>
<status>0</status>
<priority>4</priority>
<description/>
<type>0</type>
<manual_close>0</manual_close>
<dependencies/>
<tags/>
</trigger>
<trigger>
<expression>{mysql_status_python_57:mysql_status57[Com_lock_tables].last()}>1</expression>
<recovery_mode>0</recovery_mode>
<recovery_expression/>
<name>mysql锁表状态数量</name>
<correlation_mode>0</correlation_mode>
<correlation_tag/>
<url/>
<status>0</status>
<priority>3</priority>
<description/>
<type>0</type>
<manual_close>0</manual_close>
<dependencies/>
<tags/>
</trigger>
<trigger>
<expression>{mysql_status_python_57:mysql_status57[Threads_connected].last()}>1000</expression>
<recovery_mode>0</recovery_mode>
<recovery_expression/>
<name>Threads_connected全部连接数</name>
<correlation_mode>0</correlation_mode>
<correlation_tag/>
<url/>
<status>0</status>
<priority>3</priority>
<description/>
<type>0</type>
<manual_close>0</manual_close>
<dependencies/>
<tags/>
</trigger>
<trigger>
<expression>{mysql_status_python_57:mysql_status57[Threads_running].last()}>100</expression>
<recovery_mode>0</recovery_mode>
<recovery_expression/>
<name>Threads_running正在运行的连接数</name>
<correlation_mode>0</correlation_mode>
<correlation_tag/>
<url/>
<status>0</status>
<priority>3</priority>
<description/>
<type>0</type>
<manual_close>0</manual_close>
<dependencies/>
<tags/>
</trigger>
</triggers>
<graphs>
<graph>
<name>mysql锁表图形</name>
<width>900</width>
<height>200</height>
<yaxismin>0.0000</yaxismin>
<yaxismax>100.0000</yaxismax>
<show_work_period>1</show_work_period>
<show_triggers>1</show_triggers>
<type>0</type>
<show_legend>1</show_legend>
<show_3d>0</show_3d>
<percent_left>0.0000</percent_left>
<percent_right>0.0000</percent_right>
<ymin_type_1>0</ymin_type_1>
<ymax_type_1>0</ymax_type_1>
<ymin_item_1>0</ymin_item_1>
<ymax_item_1>0</ymax_item_1>
<graph_items>
<graph_item>
<sortorder>0</sortorder>
<drawtype>0</drawtype>
<color>1A7C11</color>
<yaxisside>0</yaxisside>
<calc_fnc>2</calc_fnc>
<type>0</type>
<item>
<host>mysql_status_python_57</host>
<key>mysql_status57[Com_lock_tables]</key>
</item>
</graph_item>
</graph_items>
</graph>
<graph>
<name>mysq连接数</name>
<width>900</width>
<height>200</height>
<yaxismin>0.0000</yaxismin>
<yaxismax>100.0000</yaxismax>
<show_work_period>1</show_work_period>
<show_triggers>1</show_triggers>
<type>0</type>
<show_legend>1</show_legend>
<show_3d>0</show_3d>
<percent_left>0.0000</percent_left>
<percent_right>0.0000</percent_right>
<ymin_type_1>0</ymin_type_1>
<ymax_type_1>0</ymax_type_1>
<ymin_item_1>0</ymin_item_1>
<ymax_item_1>0</ymax_item_1>
<graph_items>
<graph_item>
<sortorder>0</sortorder>
<drawtype>0</drawtype>
<color>1A7C11</color>
<yaxisside>0</yaxisside>
<calc_fnc>2</calc_fnc>
<type>0</type>
<item>
<host>mysql_status_python_57</host>
<key>mysql_status57[Threads_connected]</key>
</item>
</graph_item>
<graph_item>
<sortorder>1</sortorder>
<drawtype>0</drawtype>
<color>F63100</color>
<yaxisside>0</yaxisside>
<calc_fnc>2</calc_fnc>
<type>0</type>
<item>
<host>mysql_status_python_57</host>
<key>mysql_status57[Threads_running]</key>
</item>
</graph_item>
</graph_items>
</graph>
<graph>
<name>数据库运行状态</name>
<width>900</width>
<height>200</height>
<yaxismin>0.0000</yaxismin>
<yaxismax>100.0000</yaxismax>
<show_work_period>1</show_work_period>
<show_triggers>1</show_triggers>
<type>0</type>
<show_legend>1</show_legend>
<show_3d>0</show_3d>
<percent_left>0.0000</percent_left>
<percent_right>0.0000</percent_right>
<ymin_type_1>0</ymin_type_1>
<ymax_type_1>0</ymax_type_1>
<ymin_item_1>0</ymin_item_1>
<ymax_item_1>0</ymax_item_1>
<graph_items>
<graph_item>
<sortorder>0</sortorder>
<drawtype>0</drawtype>
<color>1A7C11</color>
<yaxisside>0</yaxisside>
<calc_fnc>2</calc_fnc>
<type>0</type>
<item>
<host>mysql_status_python_57</host>
<key>mysql_status57[mysql_stat]</key>
</item>
</graph_item>
</graph_items>
</graph>
</graphs>
</zabbix_export>
03、mysql_status_time2_python.xml 监控数据库流量及TPS等
<?xml version="1.0" encoding="UTF-8"?>
<zabbix_export>
<version>4.2</version>
<date>2021-03-15T01:14:27Z</date>
<groups>
<group>
<name>Templates/Databases</name>
</group>
</groups>
<templates>
<template>
<template>mysql_status_time2_python</template>
<name>mysql_status_time2_python</name>
<description/>
<groups>
<group>
<name>Templates/Databases</name>
</group>
</groups>
<applications>
<application>
<name>mysql_python</name>
</application>
</applications>
<items>
<item>
<name>Aborted_clients已经放弃的连接数量</name>
<type>0</type>
<snmp_community/>
<snmp_oid/>
<key>mysql_status[Aborted_clients]</key>
<delay>60s</delay>
<history>90d</history>
<trends>365d</trends>
<status>0</status>
<value_type>3</value_type>
<allowed_hosts/>
<units/>
<snmpv3_contextname/>
<snmpv3_securityname/>
<snmpv3_securitylevel>0</snmpv3_securitylevel>
<snmpv3_authprotocol>0</snmpv3_authprotocol>
<snmpv3_authpassphrase/>
<snmpv3_privprotocol>0</snmpv3_privprotocol>
<snmpv3_privpassphrase/>
<params/>
<ipmi_sensor/>
<authtype>0</authtype>
<username/>
<password/>
<publickey/>
<privatekey/>
<port/>
<description>由于客户没有正确关闭连接已经死掉,已经放弃的连接数量</description>
<inventory_link>0</inventory_link>
<applications/>
<valuemap/>
<logtimefmt/>
<preprocessing/>
<jmx_endpoint/>
<timeout>3s</timeout>
<url/>
<query_fields/>
<posts/>
<status_codes>200</status_codes>
<follow_redirects>1</follow_redirects>
<post_type>0</post_type>
<http_proxy/>
<headers/>
<retrieve_mode>0</retrieve_mode>
<request_method>0</request_method>
<output_format>0</output_format>
<allow_traps>0</allow_traps>
<ssl_cert_file/>
<ssl_key_file/>
<ssl_key_password/>
<verify_peer>0</verify_peer>
<verify_host>0</verify_host>
<master_item/>
</item>
<item>
<name>Aborted_connect失败的MySQL服务器的连接的次数</name>
<type>0</type>
<snmp_community/>
<snmp_oid/>
<key>mysql_status[Aborted_connect]</key>
<delay>60s</delay>
<history>90d</history>
<trends>365d</trends>
<status>0</status>
<value_type>3</value_type>
<allowed_hosts/>
<units/>
<snmpv3_contextname/>
<snmpv3_securityname/>
<snmpv3_securitylevel>0</snmpv3_securitylevel>
<snmpv3_authprotocol>0</snmpv3_authprotocol>
<snmpv3_authpassphrase/>
<snmpv3_privprotocol>0</snmpv3_privprotocol>
<snmpv3_privpassphrase/>
<params/>
<ipmi_sensor/>
<authtype>0</authtype>
<username/>
<password/>
<publickey/>
<privatekey/>
<port/>
<description>Aborted_connects尝试已经失败的MySQL服务器的连接的次数</description>
<inventory_link>0</inventory_link>
<applications/>
<valuemap/>
<logtimefmt/>
<preprocessing/>
<jmx_endpoint/>
<timeout>3s</timeout>
<url/>
<query_fields/>
<posts/>
<status_codes>200</status_codes>
<follow_redirects>1</follow_redirects>
<post_type>0</post_type>
<http_proxy/>
<headers/>
<retrieve_mode>0</retrieve_mode>
<request_method>0</request_method>
<output_format>0</output_format>
<allow_traps>0</allow_traps>
<ssl_cert_file/>
<ssl_key_file/>
<ssl_key_password/>
<verify_peer>0</verify_peer>
<verify_host>0</verify_host>
<master_item/>
</item>
<item>
<name>Binlog_cache_disk_use缓存磁盘文件次数</name>
<type>0</type>
<snmp_community/>
<snmp_oid/>
<key>mysql_status[Binlog_cache_disk_use]</key>
<delay>60s</delay>
<history>90d</history>
<trends>365d</trends>
<status>0</status>
<value_type>3</value_type>
<allowed_hosts/>
<units/>
<snmpv3_contextname/>
<snmpv3_securityname/>
<snmpv3_securitylevel>0</snmpv3_securitylevel>
<snmpv3_authprotocol>0</snmpv3_authprotocol>
<snmpv3_authpassphrase/>
<snmpv3_privprotocol>0</snmpv3_privprotocol>
<snmpv3_privpassphrase/>
<params/>
<ipmi_sensor/>
<authtype>0</authtype>
<username/>
<password/>
<publickey/>
<privatekey/>
<port/>
<description>Binlog_cache_disk_use表示因为我们binlog_cache_size设计的内存不足导致缓存二进制日志用到了临时文件的次数</description>
<inventory_link>0</inventory_link>
<applications/>
<valuemap/>
<logtimefmt/>
<preprocessing/>
<jmx_endpoint/>
<timeout>3s</timeout>
<url/>
<query_fields/>
<posts/>
<status_codes>200</status_codes>
<follow_redirects>1</follow_redirects>
<post_type>0</post_type>
<http_proxy/>
<headers/>
<retrieve_mode>0</retrieve_mode>
<request_method>0</request_method>
<output_format>0</output_format>
<allow_traps>0</allow_traps>
<ssl_cert_file/>
<ssl_key_file/>
<ssl_key_password/>
<verify_peer>0</verify_peer>
<verify_host>0</verify_host>
<master_item/>
</item>
<item>
<name>Bytes_received网卡接收流量(字节)</name>
<type>0</type>
<snmp_community/>
<snmp_oid/>
<key>mysql_status[Bytes_received]</key>
<delay>60s</delay>
<history>90d</history>
<trends>365d</trends>
<status>0</status>
<value_type>3</value_type>
<allowed_hosts/>
<units/>
<snmpv3_contextname/>
<snmpv3_securityname/>
<snmpv3_securitylevel>0</snmpv3_securitylevel>
<snmpv3_authprotocol>0</snmpv3_authprotocol>
<snmpv3_authpassphrase/>
<snmpv3_privprotocol>0</snmpv3_privprotocol>
<snmpv3_privpassphrase/>
<params/>
<ipmi_sensor/>
<authtype>0</authtype>
<username/>
<password/>
<publickey/>
<privatekey/>
<port/>
<description>Bytes_received从所有客户端接收到的字节数。结合bytes sent, 可以作为数据库网卡吞吐量的评测指标,单位字节,如果需要换算成MB则需要除以1024/1024</description>
<inventory_link>0</inventory_link>
<applications/>
<valuemap/>
<logtimefmt/>
<preprocessing/>
<jmx_endpoint/>
<timeout>3s</timeout>
<url/>
<query_fields/>
<posts/>
<status_codes>200</status_codes>
<follow_redirects>1</follow_redirects>
<post_type>0</post_type>
<http_proxy/>
<headers/>
<retrieve_mode>0</retrieve_mode>
<request_method>0</request_method>
<output_format>0</output_format>
<allow_traps>0</allow_traps>
<ssl_cert_file/>
<ssl_key_file/>
<ssl_key_password/>
<verify_peer>0</verify_peer>
<verify_host>0</verify_host>
<master_item/>
</item>
<item>
<name>Bytes_sent网卡发送量(字节)</name>
<type>0</type>
<snmp_community/>
<snmp_oid/>
<key>mysql_status[Bytes_sent]</key>
<delay>60s</delay>
<history>90d</history>
<trends>365d</trends>
<status>0</status>
<value_type>3</value_type>
<allowed_hosts/>
<units/>
<snmpv3_contextname/>
<snmpv3_securityname/>
<snmpv3_securitylevel>0</snmpv3_securitylevel>
<snmpv3_authprotocol>0</snmpv3_authprotocol>
<snmpv3_authpassphrase/>
<snmpv3_privprotocol>0</snmpv3_privprotocol>
<snmpv3_privpassphrase/>
<params/>
<ipmi_sensor/>
<authtype>0</authtype>
<username/>
<password/>
<publickey/>
<privatekey/>
<port/>
<description>Bytes_sent发送给所有客户端的字节数。结合bytes received,可以作为数据库网卡吞吐量的评测指标,单位字节,换算成MB需要除以1024/1024</description>
<inventory_link>0</inventory_link>
<applications/>
<valuemap/>
<logtimefmt/>
<preprocessing/>
<jmx_endpoint/>
<timeout>3s</timeout>
<url/>
<query_fields/>
<posts/>
<status_codes>200</status_codes>
<follow_redirects>1</follow_redirects>
<post_type>0</post_type>
<http_proxy/>
<headers/>
<retrieve_mode>0</retrieve_mode>
<request_method>0</request_method>
<output_format>0</output_format>
<allow_traps>0</allow_traps>
<ssl_cert_file/>
<ssl_key_file/>
<ssl_key_password/>
<verify_peer>0</verify_peer>
<verify_host>0</verify_host>
<master_item/>
</item>
<item>
<name>Com_commit事务提交次数</name>
<type>0</type>
<snmp_community/>
<snmp_oid/>
<key>mysql_status[Com_commit]</key>
<delay>60s</delay>
<history>90d</history>
<trends>365d</trends>
<status>0</status>
<value_type>3</value_type>
<allowed_hosts/>
<units/>
<snmpv3_contextname/>
<snmpv3_securityname/>
<snmpv3_securitylevel>0</snmpv3_securitylevel>
<snmpv3_authprotocol>0</snmpv3_authprotocol>
<snmpv3_authpassphrase/>
<snmpv3_privprotocol>0</snmpv3_privprotocol>
<snmpv3_privpassphrase/>
<params/>
<ipmi_sensor/>
<authtype>0</authtype>
<username/>
<password/>
<publickey/>
<privatekey/>
<port/>
<description>MySQL提交的事务数量,可以用来统计TPS(每秒事务数),计算公式:Com_commit/S+Com_rollback/S</description>
<inventory_link>0</inventory_link>
<applications/>
<valuemap/>
<logtimefmt/>
<preprocessing/>
<jmx_endpoint/>
<timeout>3s</timeout>
<url/>
<query_fields/>
<posts/>
<status_codes>200</status_codes>
<follow_redirects>1</follow_redirects>
<post_type>0</post_type>
<http_proxy/>
<headers/>
<retrieve_mode>0</retrieve_mode>
<request_method>0</request_method>
<output_format>0</output_format>
<allow_traps>0</allow_traps>
<ssl_cert_file/>
<ssl_key_file/>
<ssl_key_password/>
<verify_peer>0</verify_peer>
<verify_host>0</verify_host>
<master_item/>
</item>
<item>
<name>Com_delete删除语句数量</name>
<type>0</type>
<snmp_community/>
<snmp_oid/>
<key>mysql_status[Com_delete]</key>
<delay>60s</delay>
<history>90d</history>
<trends>365d</trends>
<status>0</status>
<value_type>3</value_type>
<allowed_hosts/>
<units/>
<snmpv3_contextname/>
<snmpv3_securityname/>
<snmpv3_securitylevel>0</snmpv3_securitylevel>
<snmpv3_authprotocol>0</snmpv3_authprotocol>
<snmpv3_authpassphrase/>
<snmpv3_privprotocol>0</snmpv3_privprotocol>
<snmpv3_privpassphrase/>
<params/>
<ipmi_sensor/>
<authtype>0</authtype>
<username/>
<password/>
<publickey/>
<privatekey/>
<port/>
<description>MySQL删除的数量,可以用来统计qps,计算公式:questions / uptime 或者基于com_%计算:Com_select/s + Com_insert/s + Com_update/s + Com_delete/s</description>
<inventory_link>0</inventory_link>
<applications/>
<valuemap/>
<logtimefmt/>
<preprocessing/>
<jmx_endpoint/>
<timeout>3s</timeout>
<url/>
<query_fields/>
<posts/>
<status_codes>200</status_codes>
<follow_redirects>1</follow_redirects>
<post_type>0</post_type>
<http_proxy/>
<headers/>
<retrieve_mode>0</retrieve_mode>
<request_method>0</request_method>
<output_format>0</output_format>
<allow_traps>0</allow_traps>
<ssl_cert_file/>
<ssl_key_file/>
<ssl_key_password/>
<verify_peer>0</verify_peer>
<verify_host>0</verify_host>
<master_item/>
</item>
<item>
<name>Com_insert插入语句次数</name>
<type>0</type>
<snmp_community/>
<snmp_oid/>
<key>mysql_status[Com_insert]</key>
<delay>60s</delay>
<history>90d</history>
<trends>365d</trends>
<status>0</status>
<value_type>3</value_type>
<allowed_hosts/>
<units/>
<snmpv3_contextname/>
<snmpv3_securityname/>
<snmpv3_securitylevel>0</snmpv3_securitylevel>
<snmpv3_authprotocol>0</snmpv3_authprotocol>
<snmpv3_authpassphrase/>
<snmpv3_privprotocol>0</snmpv3_privprotocol>
<snmpv3_privpassphrase/>
<params/>
<ipmi_sensor/>
<authtype>0</authtype>
<username/>
<password/>
<publickey/>
<privatekey/>
<port/>
<description>MySQL插入的数量,可以用来统计qps,qps计算公式:questions / uptime 或者基于com_%计算:Com_select/s + Com_insert/s + Com_update/s + Com_delete/s</description>
<inventory_link>0</inventory_link>
<applications/>
<valuemap/>
<logtimefmt/>
<preprocessing/>
<jmx_endpoint/>
<timeout>3s</timeout>
<url/>
<query_fields/>
<posts/>
<status_codes>200</status_codes>
<follow_redirects>1</follow_redirects>
<post_type>0</post_type>
<http_proxy/>
<headers/>
<retrieve_mode>0</retrieve_mode>
<request_method>0</request_method>
<output_format>0</output_format>
<allow_traps>0</allow_traps>
<ssl_cert_file/>
<ssl_key_file/>
<ssl_key_password/>
<verify_peer>0</verify_peer>
<verify_host>0</verify_host>
<master_item/>
</item>
<item>
<name>Com_rollback回滚次数</name>
<type>0</type>
<snmp_community/>
<snmp_oid/>
<key>mysql_status[Com_rollback]</key>
<delay>60s</delay>
<history>90d</history>
<trends>365d</trends>
<status>0</status>
<value_type>3</value_type>
<allowed_hosts/>
<units/>
<snmpv3_contextname/>
<snmpv3_securityname/>
<snmpv3_securitylevel>0</snmpv3_securitylevel>
<snmpv3_authprotocol>0</snmpv3_authprotocol>
<snmpv3_authpassphrase/>
<snmpv3_privprotocol>0</snmpv3_privprotocol>
<snmpv3_privpassphrase/>
<params/>
<ipmi_sensor/>
<authtype>0</authtype>
<username/>
<password/>
<publickey/>
<privatekey/>
<port/>
<description>MySQL回滚的事务数量,可以用来统计TPS(每秒事务数),计算公式:Com_commit/S+Com_rollback/S</description>
<inventory_link>0</inventory_link>
<applications/>
<valuemap/>
<logtimefmt/>
<preprocessing/>
<jmx_endpoint/>
<timeout>3s</timeout>
<url/>
<query_fields/>
<posts/>
<status_codes>200</status_codes>
<follow_redirects>1</follow_redirects>
<post_type>0</post_type>
<http_proxy/>
<headers/>
<retrieve_mode>0</retrieve_mode>
<request_method>0</request_method>
<output_format>0</output_format>
<allow_traps>0</allow_traps>
<ssl_cert_file/>
<ssl_key_file/>
<ssl_key_password/>
<verify_peer>0</verify_peer>
<verify_host>0</verify_host>
<master_item/>
</item>
<item>
<name>Com_select查询语句次数</name>
<type>0</type>
<snmp_community/>
<snmp_oid/>
<key>mysql_status[Com_select]</key>
<delay>60s</delay>
<history>90d</history>
<trends>365d</trends>
<status>0</status>
<value_type>3</value_type>
<allowed_hosts/>
<units/>
<snmpv3_contextname/>
<snmpv3_securityname/>
<snmpv3_securitylevel>0</snmpv3_securitylevel>
<snmpv3_authprotocol>0</snmpv3_authprotocol>
<snmpv3_authpassphrase/>
<snmpv3_privprotocol>0</snmpv3_privprotocol>
<snmpv3_privpassphrase/>
<params/>
<ipmi_sensor/>
<authtype>0</authtype>
<username/>
<password/>
<publickey/>
<privatekey/>
<port/>
<description>MySQL查询的数量,可以用来统计qps,qps计算公式:questions / uptime 或者基于com_%计算:Com_select/s + Com_insert/s + Com_update/s + Com_delete/s</description>
<inventory_link>0</inventory_link>
<applications/>
<valuemap/>
<logtimefmt/>
<preprocessing/>
<jmx_endpoint/>
<timeout>3s</timeout>
<url/>
<query_fields/>
<posts/>
<status_codes>200</status_codes>
<follow_redirects>1</follow_redirects>
<post_type>0</post_type>
<http_proxy/>
<headers/>
<retrieve_mode>0</retrieve_mode>
<request_method>0</request_method>
<output_format>0</output_format>
<allow_traps>0</allow_traps>
<ssl_cert_file/>
<ssl_key_file/>
<ssl_key_password/>
<verify_peer>0</verify_peer>
<verify_host>0</verify_host>
<master_item/>
</item>
<item>
<name>Com_update更新语句次数</name>
<type>0</type>
<snmp_community/>
<snmp_oid/>
<key>mysql_status[Com_update]</key>
<delay>30s</delay>
<history>90d</history>
<trends>365d</trends>
<status>0</status>
<value_type>3</value_type>
<allowed_hosts/>
<units/>
<snmpv3_contextname/>
<snmpv3_securityname/>
<snmpv3_securitylevel>0</snmpv3_securitylevel>
<snmpv3_authprotocol>0</snmpv3_authprotocol>
<snmpv3_authpassphrase/>
<snmpv3_privprotocol>0</snmpv3_privprotocol>
<snmpv3_privpassphrase/>
<params/>
<ipmi_sensor/>
<authtype>0</authtype>
<username/>
<password/>
<publickey/>
<privatekey/>
<port/>
<description>MySQL更新的数量,可以用来统计qps,qps计算公式:questions / uptime 或者基于com_%计算:Com_select/s + Com_insert/s + Com_update/s + Com_delete/s</description>
<inventory_link>0</inventory_link>
<applications/>
<valuemap/>
<logtimefmt/>
<preprocessing/>
<jmx_endpoint/>
<timeout>3s</timeout>
<url/>
<query_fields/>
<posts/>
<status_codes>200</status_codes>
<follow_redirects>1</follow_redirects>
<post_type>0</post_type>
<http_proxy/>
<headers/>
<retrieve_mode>0</retrieve_mode>
<request_method>0</request_method>
<output_format>0</output_format>
<allow_traps>0</allow_traps>
<ssl_cert_file/>
<ssl_key_file/>
<ssl_key_password/>
<verify_peer>0</verify_peer>
<verify_host>0</verify_host>
<master_item/>
</item>
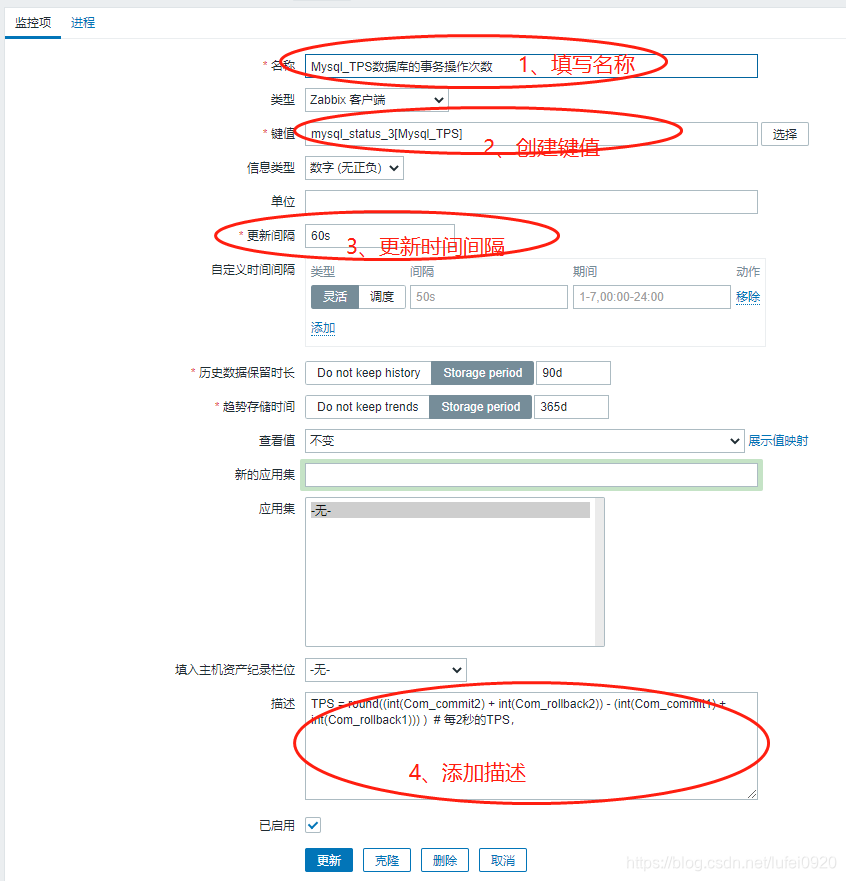
<item>
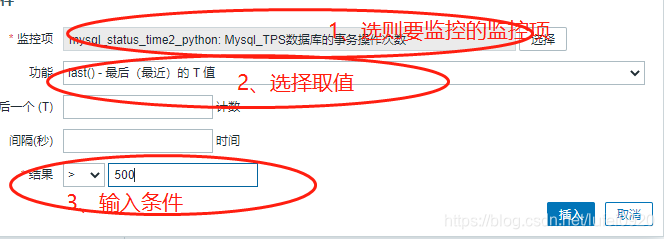
<name>Mysql_TPS数据库的事务操作次数</name>
<type>0</type>
<snmp_community/>
<snmp_oid/>
<key>mysql_status[Mysql_TPS]</key>
<delay>60s</delay>
<history>90d</history>
<trends>365d</trends>
<status>0</status>
<value_type>3</value_type>
<allowed_hosts/>
<units/>
<snmpv3_contextname/>
<snmpv3_securityname/>
<snmpv3_securitylevel>0</snmpv3_securitylevel>
<snmpv3_authprotocol>0</snmpv3_authprotocol>
<snmpv3_authpassphrase/>
<snmpv3_privprotocol>0</snmpv3_privprotocol>
<snmpv3_privpassphrase/>
<params/>
<ipmi_sensor/>
<authtype>0</authtype>
<username/>
<password/>
<publickey/>
<privatekey/>
<port/>
<description>TPS = round((int(Com_commit2) + int(Com_rollback2)) - (int(Com_commit1) + int(Com_rollback1))) ) # 每2秒的TPS,</description>
<inventory_link>0</inventory_link>
<applications/>
<valuemap/>
<logtimefmt/>
<preprocessing/>
<jmx_endpoint/>
<timeout>3s</timeout>
<url/>
<query_fields/>
<posts/>
<status_codes>200</status_codes>
<follow_redirects>1</follow_redirects>
<post_type>0</post_type>
<http_proxy/>
<headers/>
<retrieve_mode>0</retrieve_mode>
<request_method>0</request_method>
<output_format>0</output_format>
<allow_traps>0</allow_traps>
<ssl_cert_file/>
<ssl_key_file/>
<ssl_key_password/>
<verify_peer>0</verify_peer>
<verify_host>0</verify_host>
<master_item/>
</item>
<item>
<name>Questions数据库qps</name>
<type>0</type>
<snmp_community/>
<snmp_oid/>
<key>mysql_status[Questions]</key>
<delay>60s</delay>
<history>90d</history>
<trends>365d</trends>
<status>0</status>
<value_type>3</value_type>
<allowed_hosts/>
<units/>
<snmpv3_contextname/>
<snmpv3_securityname/>
<snmpv3_securitylevel>0</snmpv3_securitylevel>
<snmpv3_authprotocol>0</snmpv3_authprotocol>
<snmpv3_authpassphrase/>
<snmpv3_privprotocol>0</snmpv3_privprotocol>
<snmpv3_privpassphrase/>
<params/>
<ipmi_sensor/>
<authtype>0</authtype>
<username/>
<password/>
<publickey/>
<privatekey/>
<port/>
<description>Questions发往服务器的查询的数量。(监控),即mysql的QPS</description>
<inventory_link>0</inventory_link>
<applications/>
<valuemap/>
<logtimefmt/>
<preprocessing/>
<jmx_endpoint/>
<timeout>3s</timeout>
<url/>
<query_fields/>
<posts/>
<status_codes>200</status_codes>
<follow_redirects>1</follow_redirects>
<post_type>0</post_type>
<http_proxy/>
<headers/>
<retrieve_mode>0</retrieve_mode>
<request_method>0</request_method>
<output_format>0</output_format>
<allow_traps>0</allow_traps>
<ssl_cert_file/>
<ssl_key_file/>
<ssl_key_password/>
<verify_peer>0</verify_peer>
<verify_host>0</verify_host>
<master_item/>
</item>
<item>
<name>totle_Bytes网卡总的吞吐量(字节)</name>
<type>0</type>
<snmp_community/>
<snmp_oid/>
<key>mysql_status[totle_Bytes]</key>
<delay>60s</delay>
<history>90d</history>
<trends>365d</trends>
<status>0</status>
<value_type>3</value_type>
<allowed_hosts/>
<units/>
<snmpv3_contextname/>
<snmpv3_securityname/>
<snmpv3_securitylevel>0</snmpv3_securitylevel>
<snmpv3_authprotocol>0</snmpv3_authprotocol>
<snmpv3_authpassphrase/>
<snmpv3_privprotocol>0</snmpv3_privprotocol>
<snmpv3_privpassphrase/>
<params/>
<ipmi_sensor/>
<authtype>0</authtype>
<username/>
<password/>
<publickey/>
<privatekey/>
<port/>
<description>totlebyte = ((int(Bytes_sent2)+int(Bytes_received2)) - (int(Bytes_sent1)+int(Bytes_received1)))</description>
<inventory_link>0</inventory_link>
<applications/>
<valuemap/>
<logtimefmt/>
<preprocessing/>
<jmx_endpoint/>
<timeout>3s</timeout>
<url/>
<query_fields/>
<posts/>
<status_codes>200</status_codes>
<follow_redirects>1</follow_redirects>
<post_type>0</post_type>
<http_proxy/>
<headers/>
<retrieve_mode>0</retrieve_mode>
<request_method>0</request_method>
<output_format>0</output_format>
<allow_traps>0</allow_traps>
<ssl_cert_file/>
<ssl_key_file/>
<ssl_key_password/>
<verify_peer>0</verify_peer>
<verify_host>0</verify_host>
<master_item/>
</item>
</items>
<discovery_rules/>
<httptests/>
<macros/>
<templates/>
<screens/>
<tags/>
</template>
</templates>
<triggers>
<trigger>
<expression>{mysql_status_time2_python:mysql_status[Mysql_TPS].last()}>500</expression>
<recovery_mode>0</recovery_mode>
<recovery_expression/>
<name>mysqlTPS触发器</name>
<correlation_mode>0</correlation_mode>
<correlation_tag/>
<url/>
<status>0</status>
<priority>3</priority>
<description/>
<type>0</type>
<manual_close>0</manual_close>
<dependencies/>
<tags/>
</trigger>
<trigger>
<expression>{mysql_status_time2_python:mysql_status[Questions].last()}>5000</expression>
<recovery_mode>0</recovery_mode>
<recovery_expression/>
<name>数据库QPS</name>
<correlation_mode>0</correlation_mode>
<correlation_tag/>
<url/>
<status>0</status>
<priority>3</priority>
<description/>
<type>0</type>
<manual_close>0</manual_close>
<dependencies/>
<tags/>
</trigger>
<trigger>
<expression>{mysql_status_time2_python:mysql_status[totle_Bytes].last()}>104857600</expression>
<recovery_mode>0</recovery_mode>
<recovery_expression/>
<name>数据库网卡流量</name>
<correlation_mode>0</correlation_mode>
<correlation_tag/>
<url/>
<status>0</status>
<priority>3</priority>
<description>大于100M报警</description>
<type>0</type>
<manual_close>0</manual_close>
<dependencies/>
<tags/>
</trigger>
</triggers>
<graphs>
<graph>
<name>mysql事务提交图形</name>
<width>900</width>
<height>200</height>
<yaxismin>0.0000</yaxismin>
<yaxismax>100.0000</yaxismax>
<show_work_period>1</show_work_period>
<show_triggers>1</show_triggers>
<type>0</type>
<show_legend>1</show_legend>
<show_3d>0</show_3d>
<percent_left>0.0000</percent_left>
<percent_right>0.0000</percent_right>
<ymin_type_1>0</ymin_type_1>
<ymax_type_1>0</ymax_type_1>
<ymin_item_1>0</ymin_item_1>
<ymax_item_1>0</ymax_item_1>
<graph_items>
<graph_item>
<sortorder>0</sortorder>
<drawtype>0</drawtype>
<color>1A7C11</color>
<yaxisside>0</yaxisside>
<calc_fnc>2</calc_fnc>
<type>0</type>
<item>
<host>mysql_status_time2_python</host>
<key>mysql_status[Com_commit]</key>
</item>
</graph_item>
<graph_item>
<sortorder>1</sortorder>
<drawtype>0</drawtype>
<color>F63100</color>
<yaxisside>0</yaxisside>
<calc_fnc>2</calc_fnc>
<type>0</type>
<item>
<host>mysql_status_time2_python</host>
<key>mysql_status[Com_rollback]</key>
</item>
</graph_item>
</graph_items>
</graph>
<graph>
<name>mysql网卡图形</name>
<width>900</width>
<height>200</height>
<yaxismin>0.0000</yaxismin>
<yaxismax>100.0000</yaxismax>
<show_work_period>1</show_work_period>
<show_triggers>1</show_triggers>
<type>0</type>
<show_legend>1</show_legend>
<show_3d>0</show_3d>
<percent_left>0.0000</percent_left>
<percent_right>0.0000</percent_right>
<ymin_type_1>0</ymin_type_1>
<ymax_type_1>0</ymax_type_1>
<ymin_item_1>0</ymin_item_1>
<ymax_item_1>0</ymax_item_1>
<graph_items>
<graph_item>
<sortorder>0</sortorder>
<drawtype>0</drawtype>
<color>1A7C11</color>
<yaxisside>0</yaxisside>
<calc_fnc>2</calc_fnc>
<type>0</type>
<item>
<host>mysql_status_time2_python</host>
<key>mysql_status[Bytes_received]</key>
</item>
</graph_item>
<graph_item>
<sortorder>1</sortorder>
<drawtype>0</drawtype>
<color>F63100</color>
<yaxisside>0</yaxisside>
<calc_fnc>2</calc_fnc>
<type>0</type>
<item>
<host>mysql_status_time2_python</host>
<key>mysql_status[Bytes_sent]</key>
</item>
</graph_item>
<graph_item>
<sortorder>2</sortorder>
<drawtype>0</drawtype>
<color>2774A4</color>
<yaxisside>0</yaxisside>
<calc_fnc>2</calc_fnc>
<type>0</type>
<item>
<host>mysql_status_time2_python</host>
<key>mysql_status[totle_Bytes]</key>
</item>
</graph_item>
</graph_items>
</graph>
<graph>
<name>mysql语句类图形</name>
<width>900</width>
<height>200</height>
<yaxismin>0.0000</yaxismin>
<yaxismax>100.0000</yaxismax>
<show_work_period>1</show_work_period>
<show_triggers>1</show_triggers>
<type>0</type>
<show_legend>1</show_legend>
<show_3d>0</show_3d>
<percent_left>0.0000</percent_left>
<percent_right>0.0000</percent_right>
<ymin_type_1>0</ymin_type_1>
<ymax_type_1>0</ymax_type_1>
<ymin_item_1>0</ymin_item_1>
<ymax_item_1>0</ymax_item_1>
<graph_items>
<graph_item>
<sortorder>0</sortorder>
<drawtype>0</drawtype>
<color>1A7C11</color>
<yaxisside>0</yaxisside>
<calc_fnc>2</calc_fnc>
<type>0</type>
<item>
<host>mysql_status_time2_python</host>
<key>mysql_status[Com_delete]</key>
</item>
</graph_item>
<graph_item>
<sortorder>1</sortorder>
<drawtype>0</drawtype>
<color>F63100</color>
<yaxisside>0</yaxisside>
<calc_fnc>2</calc_fnc>
<type>0</type>
<item>
<host>mysql_status_time2_python</host>
<key>mysql_status[Com_insert]</key>
</item>
</graph_item>
<graph_item>
<sortorder>2</sortorder>
<drawtype>0</drawtype>
<color>2774A4</color>
<yaxisside>0</yaxisside>
<calc_fnc>2</calc_fnc>
<type>0</type>
<item>
<host>mysql_status_time2_python</host>
<key>mysql_status[Com_select]</key>
</item>
</graph_item>
<graph_item>
<sortorder>3</sortorder>
<drawtype>0</drawtype>
<color>A54F10</color>
<yaxisside>0</yaxisside>
<calc_fnc>2</calc_fnc>
<type>0</type>
<item>
<host>mysql_status_time2_python</host>
<key>mysql_status[Com_update]</key>
</item>
</graph_item>
</graph_items>
</graph>
<graph>
<name>mysql需要2秒更新的数据</name>
<width>900</width>
<height>200</height>
<yaxismin>0.0000</yaxismin>
<yaxismax>100.0000</yaxismax>
<show_work_period>1</show_work_period>
<show_triggers>1</show_triggers>
<type>0</type>
<show_legend>1</show_legend>
<show_3d>0</show_3d>
<percent_left>0.0000</percent_left>
<percent_right>0.0000</percent_right>
<ymin_type_1>0</ymin_type_1>
<ymax_type_1>0</ymax_type_1>
<ymin_item_1>0</ymin_item_1>
<ymax_item_1>0</ymax_item_1>
<graph_items>
<graph_item>
<sortorder>0</sortorder>
<drawtype>0</drawtype>
<color>1A7C11</color>
<yaxisside>0</yaxisside>
<calc_fnc>2</calc_fnc>
<type>0</type>
<item>
<host>mysql_status_time2_python</host>
<key>mysql_status[Aborted_clients]</key>
</item>
</graph_item>
<graph_item>
<sortorder>1</sortorder>
<drawtype>0</drawtype>
<color>F63100</color>
<yaxisside>0</yaxisside>
<calc_fnc>2</calc_fnc>
<type>0</type>
<item>
<host>mysql_status_time2_python</host>
<key>mysql_status[Aborted_connect]</key>
</item>
</graph_item>
<graph_item>
<sortorder>2</sortorder>
<drawtype>0</drawtype>
<color>2774A4</color>
<yaxisside>0</yaxisside>
<calc_fnc>2</calc_fnc>
<type>0</type>
<item>
<host>mysql_status_time2_python</host>
<key>mysql_status[Binlog_cache_disk_use]</key>
</item>
</graph_item>
<graph_item>
<sortorder>3</sortorder>
<drawtype>0</drawtype>
<color>A54F10</color>
<yaxisside>0</yaxisside>
<calc_fnc>2</calc_fnc>
<type>0</type>
<item>
<host>mysql_status_time2_python</host>
<key>mysql_status[Bytes_received]</key>
</item>
</graph_item>
<graph_item>
<sortorder>4</sortorder>
<drawtype>0</drawtype>
<color>FC6EA3</color>
<yaxisside>0</yaxisside>
<calc_fnc>2</calc_fnc>
<type>0</type>
<item>
<host>mysql_status_time2_python</host>
<key>mysql_status[Bytes_sent]</key>
</item>
</graph_item>
</graph_items>
</graph>
<graph>
<name>数据库tps、qps</name>
<width>900</width>
<height>200</height>
<yaxismin>0.0000</yaxismin>
<yaxismax>100.0000</yaxismax>
<show_work_period>1</show_work_period>
<show_triggers>1</show_triggers>
<type>0</type>
<show_legend>1</show_legend>
<show_3d>0</show_3d>
<percent_left>0.0000</percent_left>
<percent_right>0.0000</percent_right>
<ymin_type_1>0</ymin_type_1>
<ymax_type_1>0</ymax_type_1>
<ymin_item_1>0</ymin_item_1>
<ymax_item_1>0</ymax_item_1>
<graph_items>
<graph_item>
<sortorder>0</sortorder>
<drawtype>0</drawtype>
<color>1A7C11</color>
<yaxisside>0</yaxisside>
<calc_fnc>2</calc_fnc>
<type>0</type>
<item>
<host>mysql_status_time2_python</host>
<key>mysql_status[Mysql_TPS]</key>
</item>
</graph_item>
<graph_item>
<sortorder>1</sortorder>
<drawtype>0</drawtype>
<color>F63100</color>
<yaxisside>0</yaxisside>
<calc_fnc>2</calc_fnc>
<type>0</type>
<item>
<host>mysql_status_time2_python</host>
<key>mysql_status[Questions]</key>
</item>
</graph_item>
</graph_items>
</graph>
</graphs>
</zabbix_export>


 785
785

 被折叠的 条评论
为什么被折叠?
被折叠的 条评论
为什么被折叠?
 到【灌水乐园】发言


