


由于后台不报错,且并不会结束掉tomcat进程,所以只能进行JVM分析。
1.分析JVM
可用 jstat,也可以使用 VisualVM 的 Visual GC 来分析JVM垃圾回收情况。
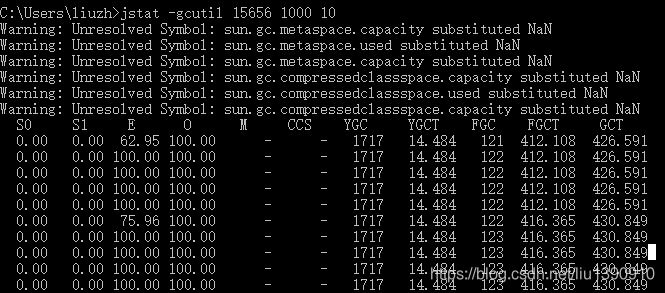
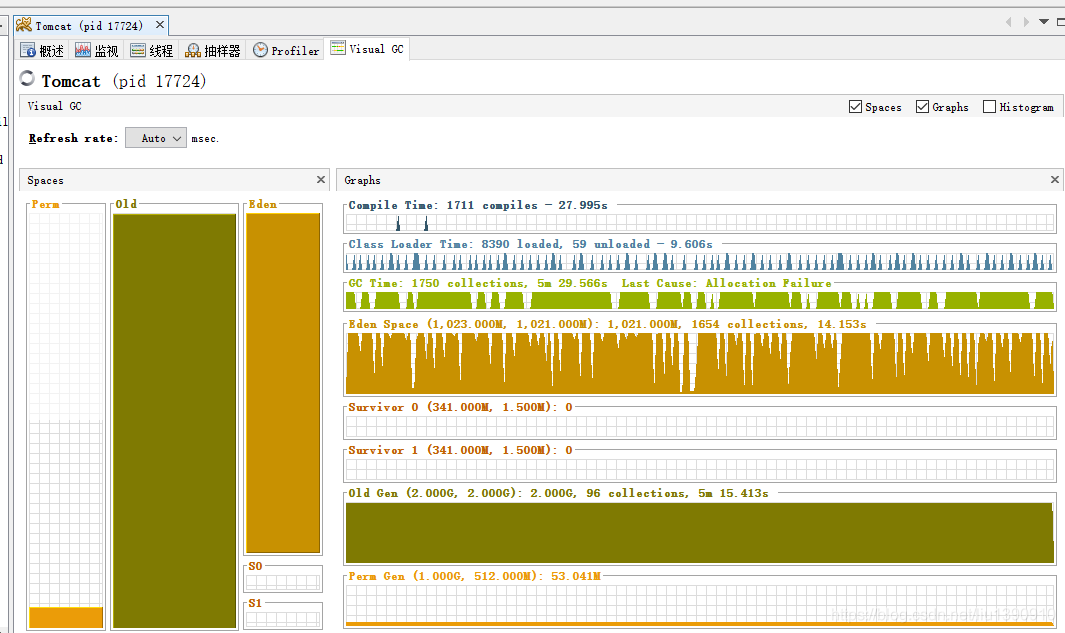
这里发现频繁full GC
这里使用 jmp 输出 dump 文件 jmap -dump:format=b,file=e:\f.hprof 15656
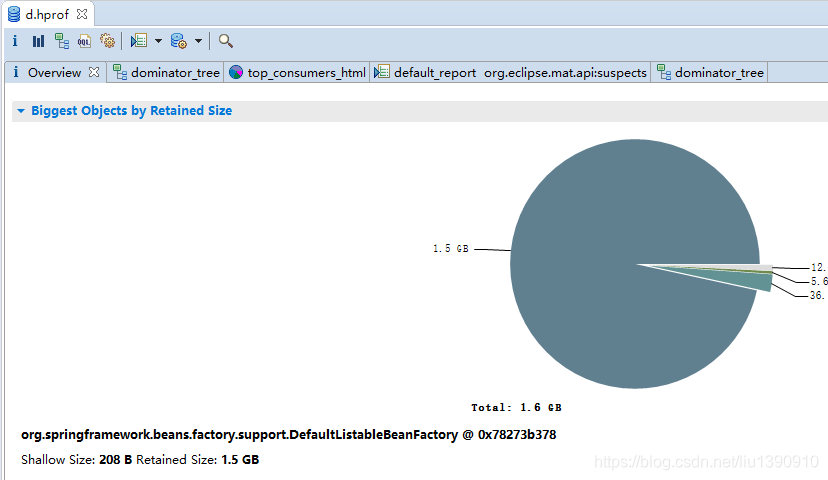
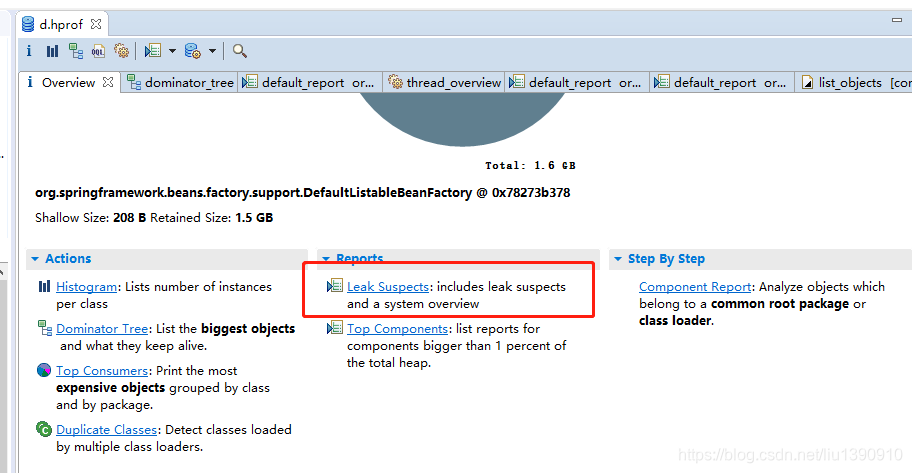
2.借助 Eclipse Memory Analyzer 分析 dump文件
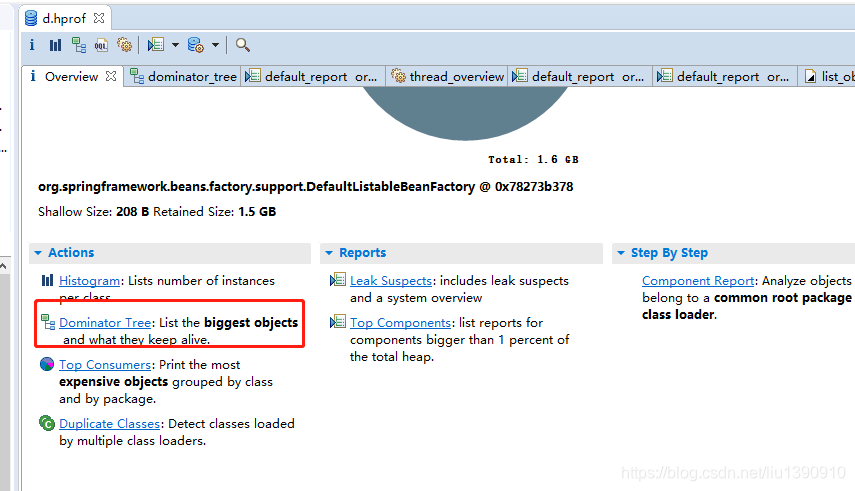
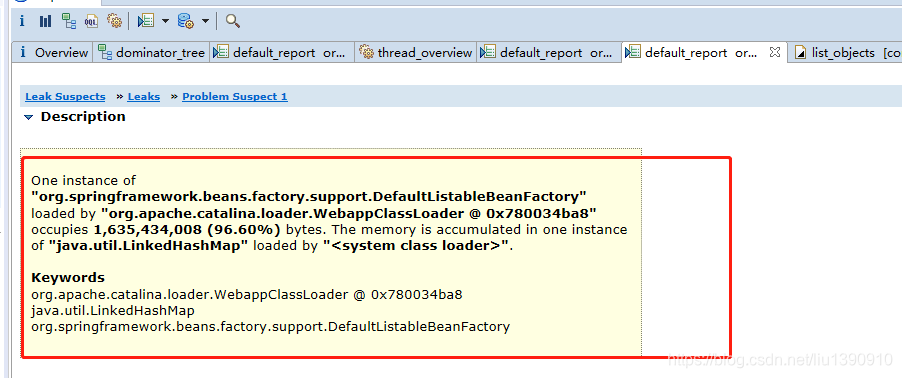
导入dump文件后,可以明显发现 Factory 类 占用了1.5G的内存
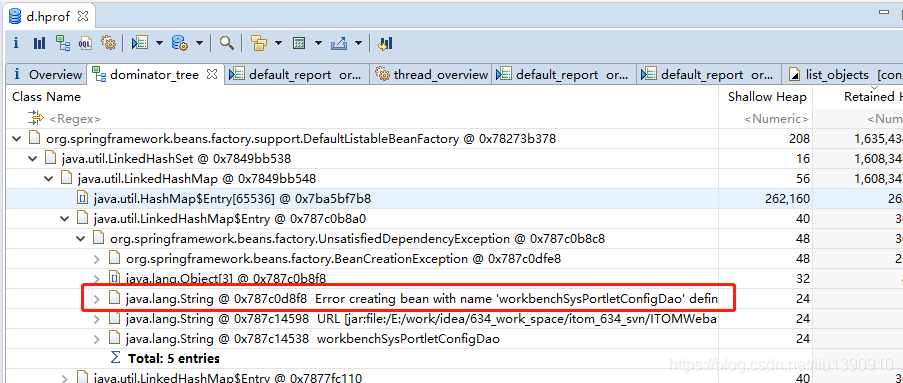
Error creating bean with name 'workbenchSysPortletConfigDao' defined in URL Instantiation of bean failed; nested exception is org.springframework.beans.BeanInstantiationException: Could not instantiate bean class [org.mybatis.spring.mapper.MapperFactoryBean]: Constructor threw exception; nested exception is java.lang.StackOverflowError
这里发现线程栈报错。
将原先Xss1M 改为 Xss2M 正常启动
可以借助该工具自带功能进行详细分析:


 被折叠的 条评论
为什么被折叠?
被折叠的 条评论
为什么被折叠?
 到【灌水乐园】发言


