


 这篇博客汇总了多个精彩的可视化案例,包括美国领土变迁、外国持有美国债务的分布、多级饼图展示、猫狗行为科普、美国自然灾害地图、知名画家生平、数字城市未来展望、文本信息可视化、桑基图模板、地图点图应用、美国债务可视化以及全球城市生活质量与成本比较。此外,还探讨了利用认知偏见优化产品设计,并推荐了一些工具和资源,如开源字体、在线信息图制作工具和在线学习平台。
一、可视化
1、Mapped: The Territorial Evolution of the U.S. 美国领土变迁

https://www.visualcapitalist.com/us-territorial-expansion/
From the Thirteen Colonies to present-day USA, this animation is a detailed look at how borders have shifted throughout the nation's history.
2、The Biggest Foreign Holders of U.S. Debt - In One Chart 新型饼图

![]() https://howmuch.net/articles/foreign-holders-of-usa-debt
https://howmuch.net/articles/foreign-holders-of-usa-debt
The U.S. government borrows money by issuing treasury securities, many of which are held by foreign countries. Here’s a breakdown of which foreign countries own the most U.S. debt
3、Inspiration from a waterfall of pie charts: illustrating hierarchies 多级饼图,很有意思的设计

Kaiser Fung (Junkcharts, Principal Analytics Prep) finds inspiration from a waterfall of pie charts.
4、Why do cats and dogs ...? 猫狗趣味科普,设计很有意思
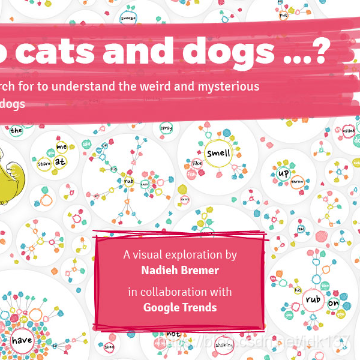
Explore how people search on Google to understand the behavior of our cats and dogs
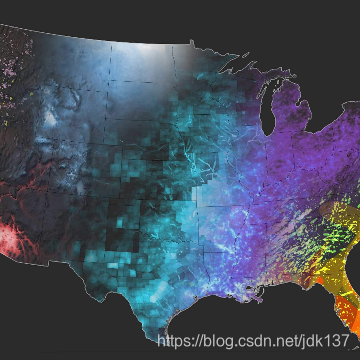
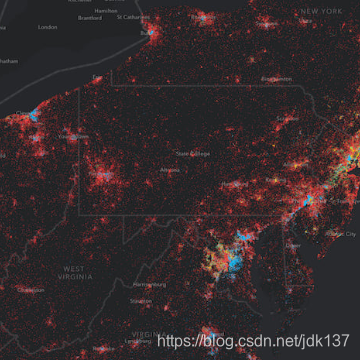
4、Analysis | Mapping America’s wicked weather and deadly disasters 美国气象地图, 效果漂亮
https://www.washingtonpost.com/graphics/2019/national/mapping-disasters/?utm_term=.56ccbdfd3b39
There is no place in America is totally safe from all natural disasters.
5、Influential Painters of Our History 知名画家的生平和作品。非常精致的交互,信息量十足。
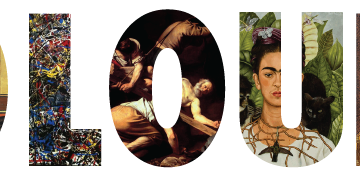
http://boringbarchart.com/influential-painters-of-our-history/
1800 1900 1700 1600 1500 1400 1300 Giotto di Bondone Andrei Rublev Jan van Eyck Sandro Botticelli Hieronymus Bosch Leonardo da Vinci Albrecht Dürer Michelangelo Raphael Titian Pieter Bruegel El Greco Caravaggio Peter Paul Rubens Diego Velazquez Rembrandt Vermeer Francisco Goya William Turner Eugene Delacroix Gustave Courbet Rosa Bonheur Camille Pissarro Edouard Manet Edgar Degas Alfred Sisley Paul Cezanne Claude Monet Pierre-Auguste Renoir Henri Rousseau Mary Cassatt Paul Gauguin van Gogh Mikhail Vrubel Seurat
6、Atlas of Digitalization 其中的地球3D交互非常漂亮
https://atlas.dc.siemens.com/#
Explore what the future of cities will look like
7、ConText by Fathom Information Design 很漂亮的文本信息可视化
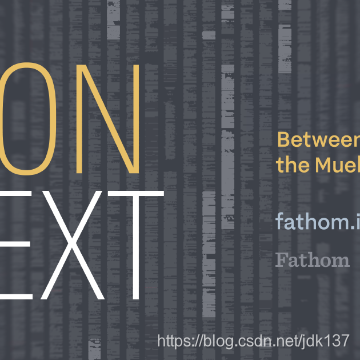
Understanding the Mueller Report through word association.
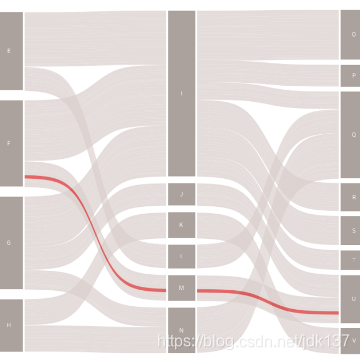
8、More Sankey Templates: Multi-Level, Traceable, Gradient, and More!! 桑基图的多种模板
![]() https://www.kenflerlage.com/2019/04/more-sankey-templates.html
https://www.kenflerlage.com/2019/04/more-sankey-templates.html
Sankey charts are often criticized in the data visualization community, largely because they are very regularly misused (perhaps more of...
9、Dot density maps for the web 地图点图
https://www.esri.com/arcgis-blog/products/js-api-arcgis/mapping/dot-density-for-the-web/
Use the ArcGIS API for JavaScript to create dynamic dot density visualizations that work well at multiple scale levels.
10、US Debt Visualized: Stacked in $100 dollar bills 美国债务可视化,非常直观用美元堆成的大楼与自由女神像作比较。

Visualized: US debt stacked in $100 bills
11、r/dataisbeautiful - [OC] Which cities are the best deals? Quality of Life and Cost of Living Around the World 世界城市生活质量与生活成本的比较
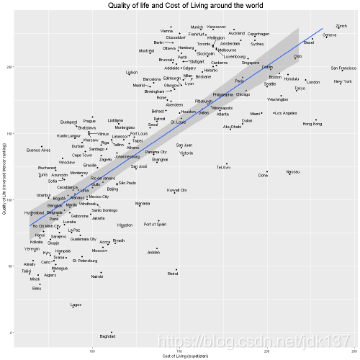
24,379 votes and 2,451 comments so far on Reddit
二、思考
1、84 cognitive biases you should exploit to design better products 利用84中认知偏见来设计更好的产品
https://www.mobilespoon.net/2019/04/collection-cognitive-biases-how-to-use.html
Learn how to use cognitive biases to increase your product's conversion rates, engagement level, and retention. A must-read article for every entrepreneur and product manager dealing with UX, UI and B2C products.
三、工具、资源
1、Google fonts 开源字体
2、canva 在线信息图制作工具
3、Udamy, lynda, courses 在线学习网站
4、百度, 火星,真实3大坐标间相互转换, github库:
https://github.com/wandergis/coordtransform
5、远程操作 TeamViewer 也是一个非常好的东西。
6、中文独立播客


 565
565

 被折叠的 条评论
为什么被折叠?
被折叠的 条评论
为什么被折叠?
 到【灌水乐园】发言


