


 该博客展示了如何利用Python的pandas、matplotlib和Seaborn库,对鸢尾花数据集进行分组和堆叠直方图的绘制。首先,通过pandas读取CSV文件并根据鸢尾花类别分组绘制直方图,然后创建堆叠直方图展示不同类别的花萼长度分布。最后,使用Seaborn的histplot函数创建堆叠直方图,进一步增强数据可视化效果。
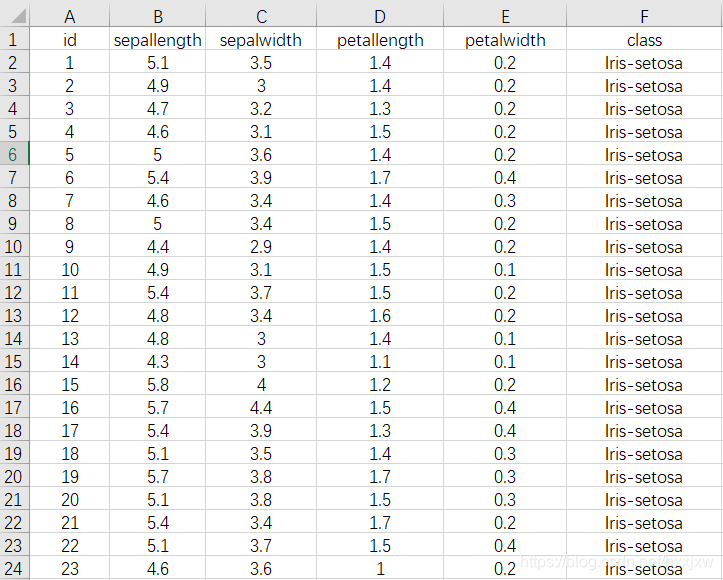
iris.csv
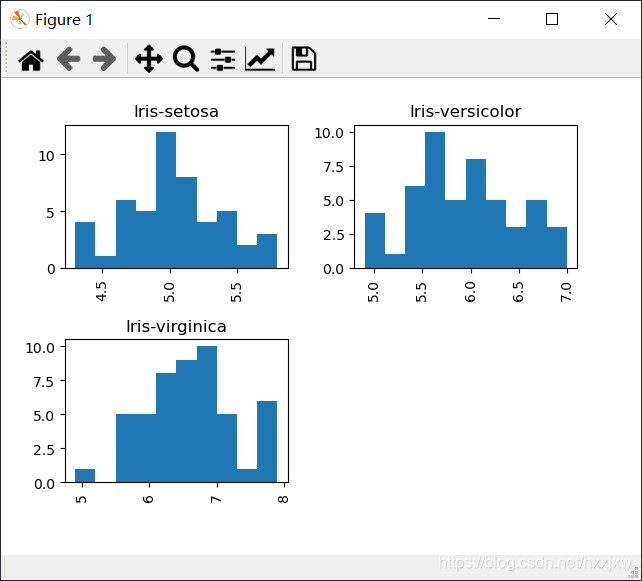
Histogram
import matplotlib.pyplot as plt
import pandas as pd

iris_df = pd.read_csv("iris.csv")
iris_df["sepallength"].hist(by=iris_df["class"]) #Group data by class label

plt.show()
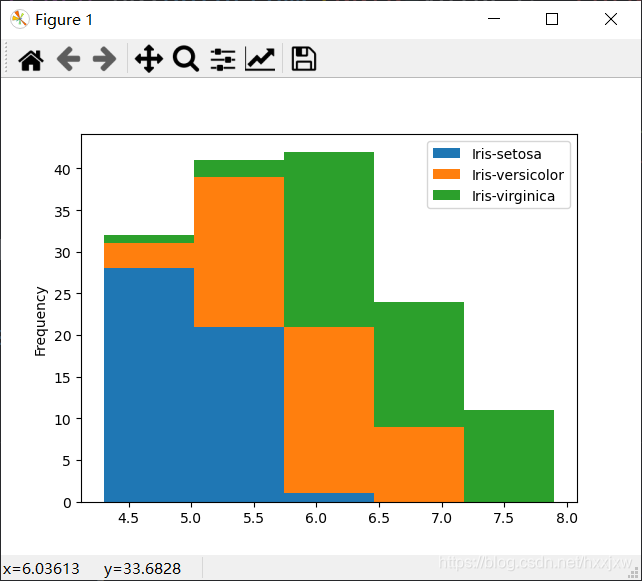
Stacked histogram
堆叠直方图
import matplotlib.pyplot as plt
import pandas as pd

iris_df = pd.read_csv("iris.csv")
labels = iris_df["class"].unique() #get all class labels

#Extract attribute values with the specific label
def filterData(df, attribute, label):
    values = iris_df[iris_df["class"] == label][[attribute]].values #Convert to NumPu array
    return pd.DataFrame(data=values,  columns=[label])#Return as DataFrame with a single column, using class label column name


df = pd.concat([filterData(iris_df, "sepallength", label)
                for label in labels], axis="columns")   #Combine data of different class labels into a table

df.plot.hist(stacked=True, bins=5)

plt.show()
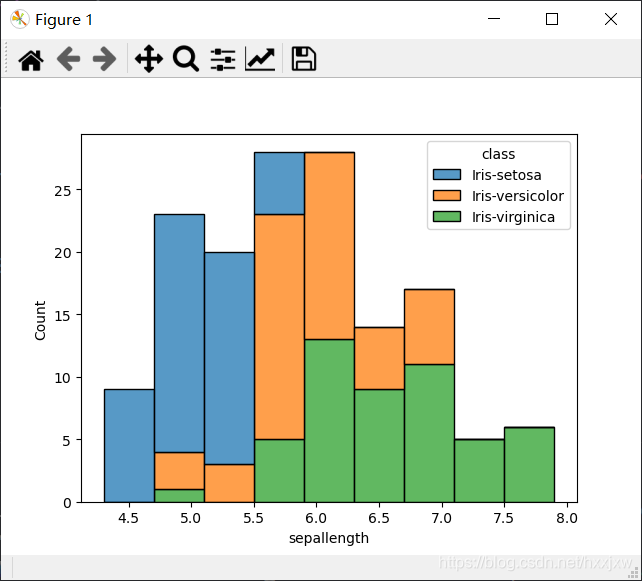
Stacked histogram using Seaborn
import matplotlib.pyplot as plt
import pandas as pd
import seaborn as sns

iris_df = pd.read_csv("iris.csv")

sns.histplot(iris_df, x="sepallength", hue="class", multiple="stack")

plt.show()
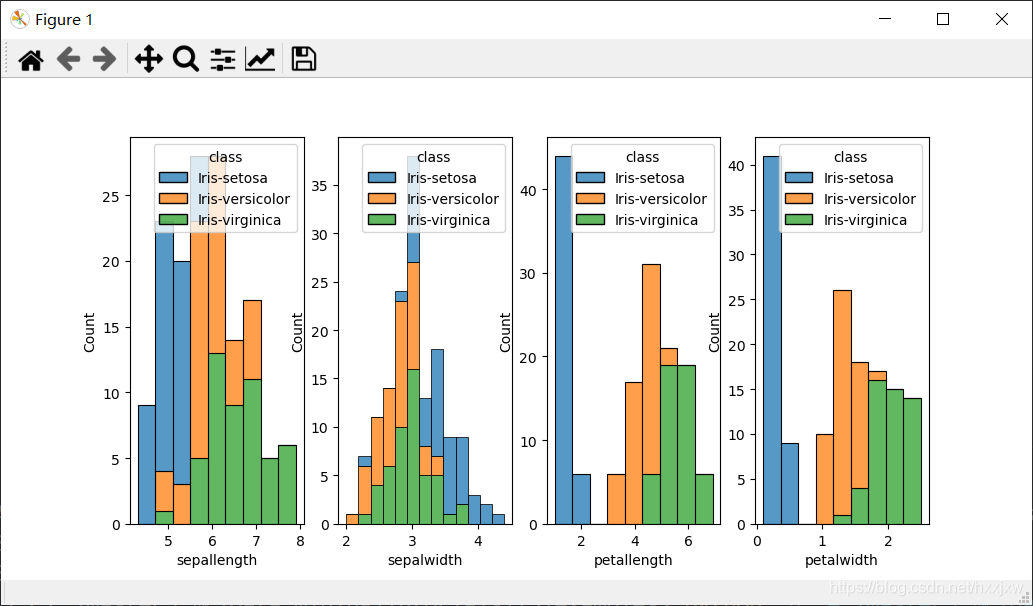
All histograms
import matplotlib.pyplot as plt
import pandas as pd
import seaborn as sns

iris_df = pd.read_csv("iris.csv")
labels = iris_df['class'].unique()
columns = [column
           for column in iris_df.columns
           if column not in ['id', 'class']]  #Get all attributes except id and class labels

_, axes = plt.subplots(1, len(columns)) #Prepare plot areas
for c in range(len(columns)):
    sns.histplot(iris_df, x=columns[c], hue="class",
                 multiple="stack", ax=axes[c])  #Plot each histogram at the correct area

plt.show()


评论

 被折叠的 条评论
为什么被折叠?
被折叠的 条评论
为什么被折叠?
 到【灌水乐园】发言
查看更多评论
添加红包


