


准备工作
- jmeter 压测工具 产生压测数据
- IfluxDB 开源时序数据库,特别适合用于处理和分析资源监控数据,用于存储压测数据
- Grafana 度量分析与可视化图标展示工具,可以支持不用种类的数据源,用于将存储于InfluxDB中的数据以图表的形式展示出来
influxdb拉取配置
在docker上拉取influxdb 和Grafana 镜像 ,需要注意influxdb2.0镜像目前不稳定,我们拉取1.0系列镜像。命令如下:
拉取镜像
docker pull influxdb:1.8.6
创建容器
docker run -d -p 8086:8086  -v /home/lulu/docker/influx/influxdb.conf:/etc/influxdb/influxdb.conf --name=influxdb  镜像Id

进行容器
docker exec -it  容器Id /bin/bash

创建数据库

root@292553b4e038:/# influx
Connected to http://localhost:8086 version 1.8.3
InfluxDB shell version: 1.8.3

show databases
create database jmeter
use jmeter
select * from jmeter
influxdb.conf 配置文件 修改的是granfana部分配置 说明下配置
[[graphite]]
  enabled = true
  bind-address = ":2003"
  database = "jmeter" 你创建的数据库名称
  retention-policy = ""
  protocol = "tcp"
  batch-size = 5000
  batch-pending = 10
  batch-timeout = "1s"
  consistency-level = "one"
  separator = "."
  udp-read-buffer = 0
influx配置完成,下面就是配置jmeter,数据源
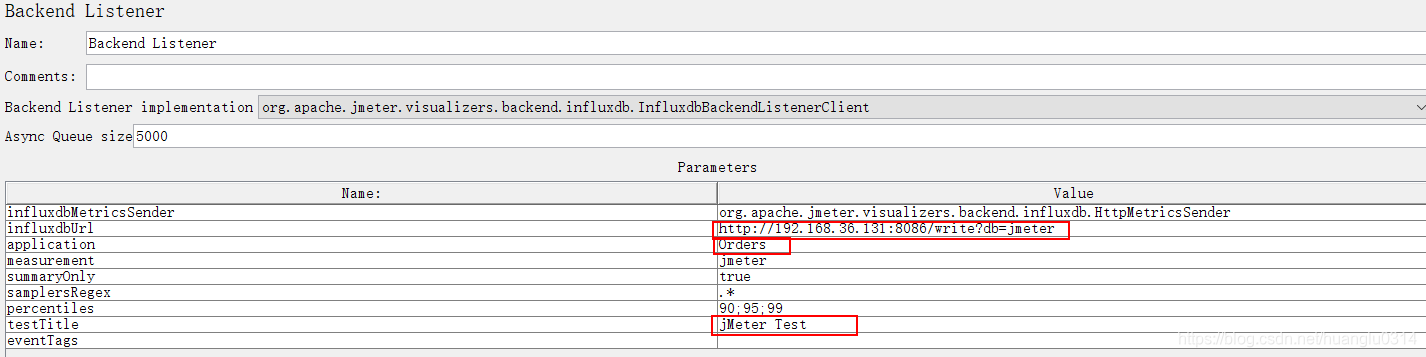
jmeter添加组件
在jmeter 中添加backend Listener组件 用于收集数据并发送给 influxdb
在Backend Listener implementation 中选择 influxdbBackendListenerClient(5.0版本以上有)
在infuxdbURL 中将实际的influxdb hostname填写进去
配置如下:
grafana拉取启动
安装grafana
下载镜像 docker pull grafana/grafana
启动镜像
docker run -d -p 3000:3000 --name=grafana  镜像Id
打开浏览器输入:http://你的ip地址:3000 打开网页,输入账号密码
默认用户名密码 admin admin 登录之后请跳过修改密码
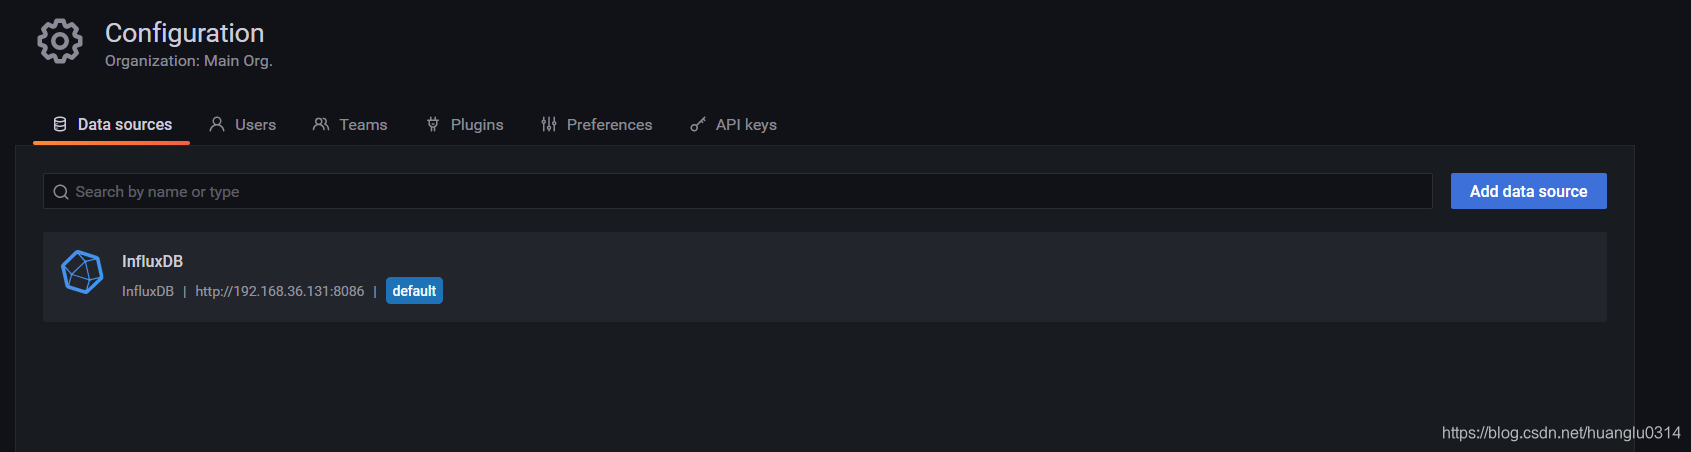
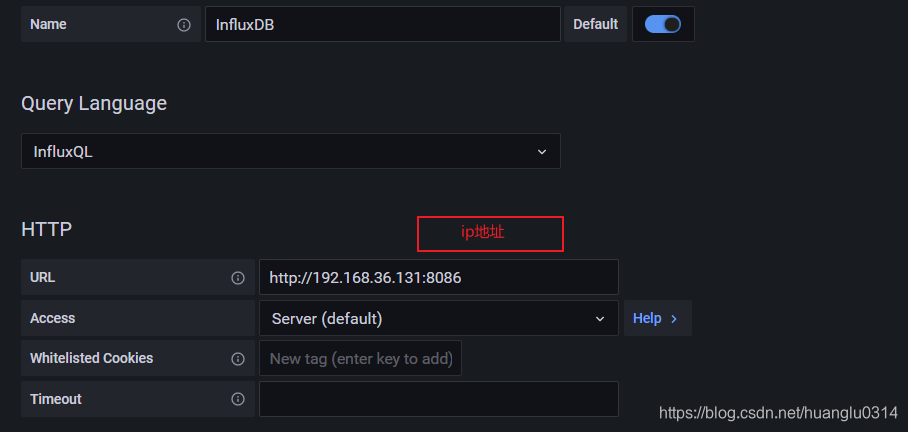
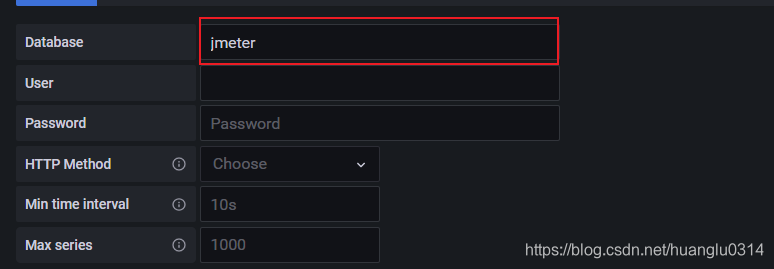
之后你就可以配置你的数据源,以及控制面板
添加数据源:
导入控制面板:
官网搜索Dash模板 Dashboards | Grafana Labs
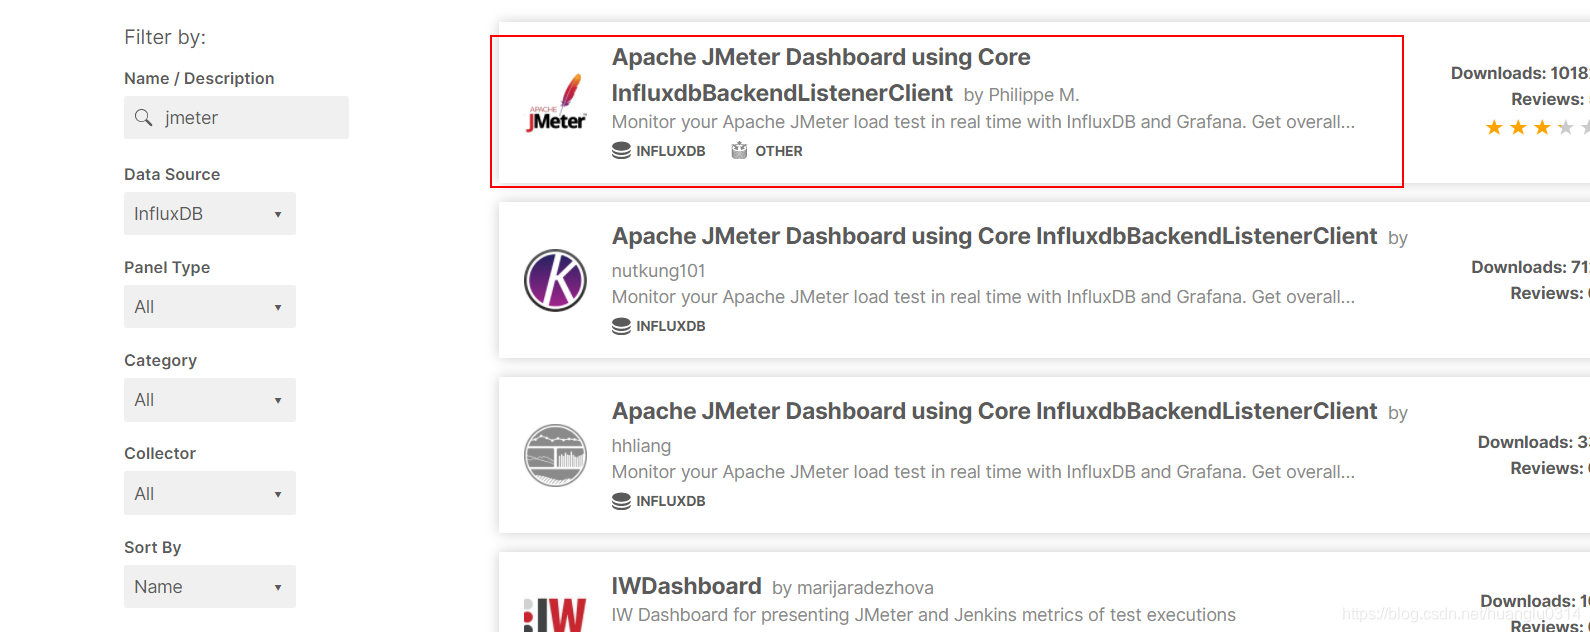
点击进去:拷贝id
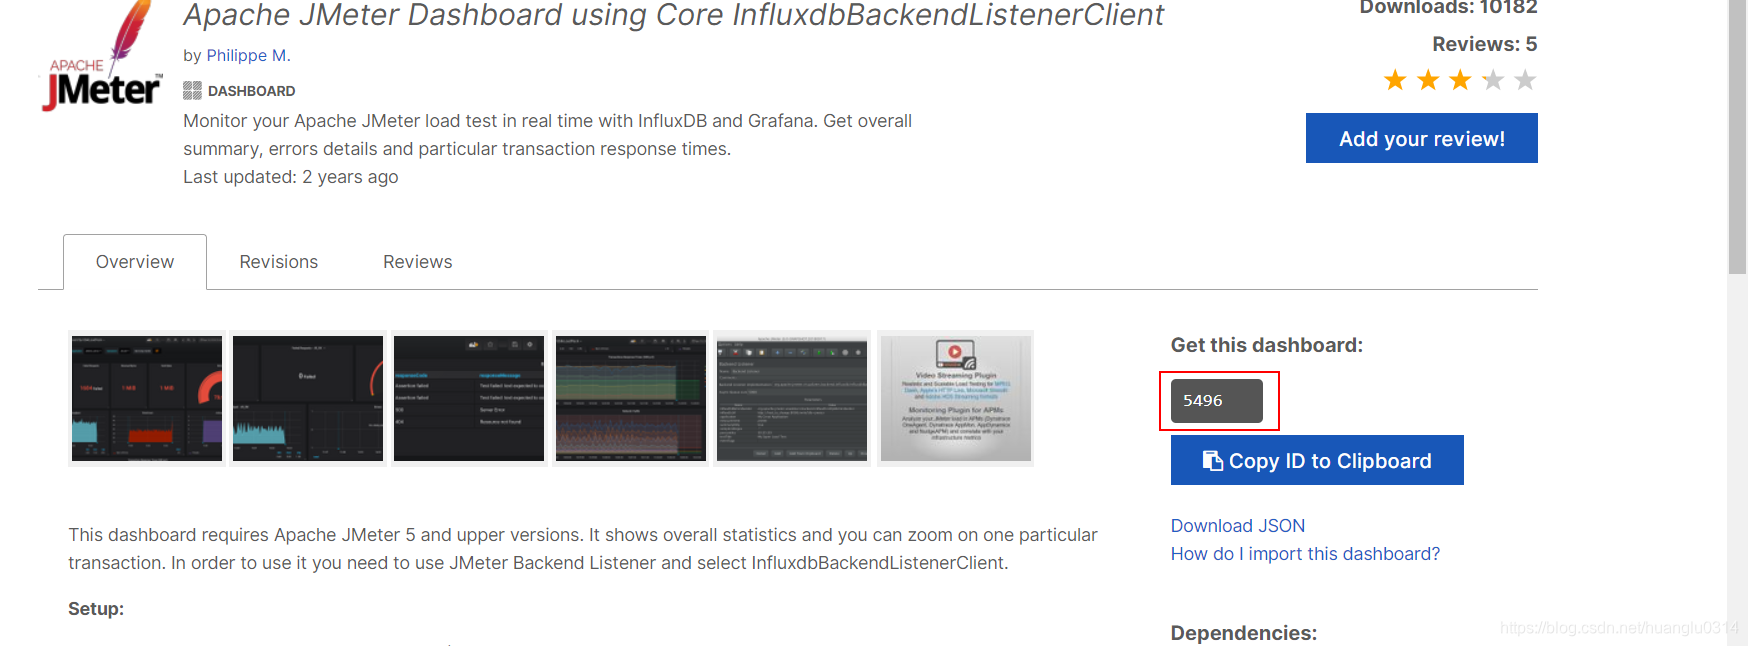
引入id即可:
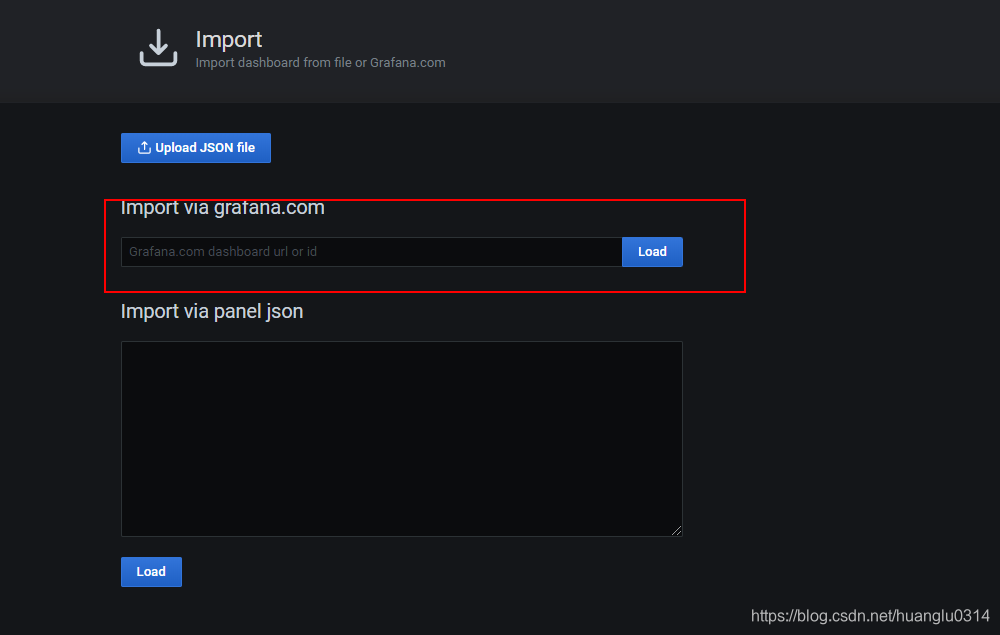
直接导入写好的DashBoard-json:文章后面有写好的influx控制面板json直接赋值拷贝,点击应用选择数据源即可
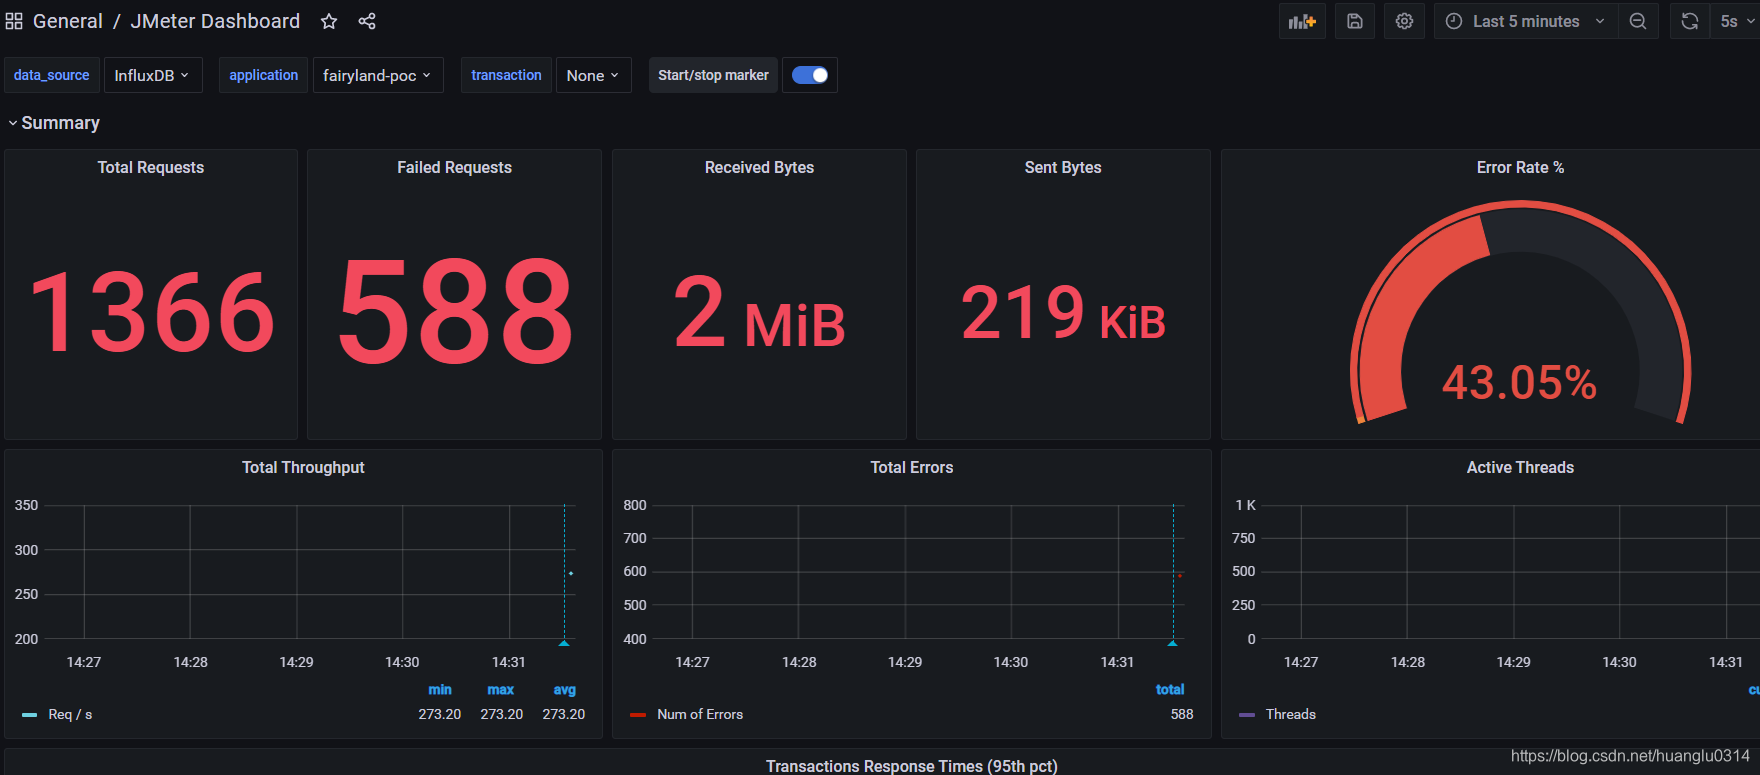
下面就可以jmeter压测了,在控制面板展示如下:
influxdb.conf全部配置内容:
[meta]
  dir = "/var/lib/influxdb/meta"
  retention-autocreate = true
  logging-enabled = true

[data]
  dir = "/var/lib/influxdb/data"
  index-version = "inmem"
  wal-dir = "/var/lib/influxdb/wal"
  wal-fsync-delay = "0s"
  validate-keys = false
  query-log-enabled = true
  cache-max-memory-size = 1073741824
  cache-snapshot-memory-size = 26214400
  cache-snapshot-write-cold-duration = "10m0s"
  compact-full-write-cold-duration = "4h0m0s"
  compact-throughput = 50331648
  compact-throughput-burst = 50331648
  max-series-per-database = 1000000
  max-values-per-tag = 100000
  max-concurrent-compactions = 0
  max-index-log-file-size = 1048576
  series-id-set-cache-size = 100
  series-file-max-concurrent-snapshot-compactions = 0
  trace-logging-enabled = false
  tsm-use-madv-willneed = false

[coordinator]
  write-timeout = "10s"
  max-concurrent-queries = 0
  query-timeout = "0s"
  log-queries-after = "0s"
  max-select-point = 0
  max-select-series = 0
  max-select-buckets = 0

[retention]
  enabled = true
  check-interval = "30m0s"

[shard-precreation]
  enabled = true
  check-interval = "10m0s"
  advance-period = "30m0s"

[monitor]
  store-enabled = true
  store-database = "_internal"
  store-interval = "10s"

[subscriber]
  enabled = true
  http-timeout = "30s"
  insecure-skip-verify = false
  ca-certs = ""
  write-concurrency = 40
  write-buffer-size = 1000

[http]
  enabled = true
  bind-address = ":8086"
  auth-enabled = false
  log-enabled = true
  suppress-write-log = false
  write-tracing = false
  flux-enabled = false
  flux-log-enabled = false
  pprof-enabled = true
  pprof-auth-enabled = false
  debug-pprof-enabled = false
  ping-auth-enabled = false
  prom-read-auth-enabled = false
  https-enabled = false
  https-certificate = "/etc/ssl/influxdb.pem"
  https-private-key = ""
  max-row-limit = 0
  max-connection-limit = 0
  shared-secret = ""
  realm = "InfluxDB"
  unix-socket-enabled = false
  unix-socket-permissions = "0777"
  bind-socket = "/var/run/influxdb.sock"
  max-body-size = 25000000
  access-log-path = ""
  max-concurrent-write-limit = 0
  max-enqueued-write-limit = 0
  enqueued-write-timeout = 30000000000

[logging]
  format = "auto"
  level = "info"
  suppress-logo = false

[[graphite]]
  enabled = true
  bind-address = ":2003"
  database = "jmeterinflux"
  retention-policy = ""
  protocol = "tcp"
  batch-size = 5000
  batch-pending = 10
  batch-timeout = "1s"
  consistency-level = "one"
  separator = "."
  udp-read-buffer = 0

[[collectd]]
  enabled = false
  bind-address = ":25826"
  database = "collectd"
  retention-policy = ""
  batch-size = 5000
  batch-pending = 10
  batch-timeout = "10s"
  read-buffer = 0
  typesdb = "/usr/share/collectd/types.db"
  security-level = "none"
  auth-file = "/etc/collectd/auth_file"
  parse-multivalue-plugin = "split"

[[opentsdb]]
  enabled = false
  bind-address = ":4242"
  database = "opentsdb"
  retention-policy = ""
  consistency-level = "one"
  tls-enabled = false
  certificate = "/etc/ssl/influxdb.pem"
  batch-size = 1000
  batch-pending = 5
  batch-timeout = "1s"
  log-point-errors = true

[[udp]]
  enabled = false
  bind-address = ":8089"
  database = "udp"
  retention-policy = ""
  batch-size = 5000
  batch-pending = 10
  read-buffer = 0
  batch-timeout = "1s"
  precision = ""

[continuous_queries]
  log-enabled = true
  enabled = true
  query-stats-enabled = false
  run-interval = "1s"

[tls]
  min-version = ""
  max-version = ""
influx格式的json面板:
{
"__inputs": [
{
"name": "JMETER_DASHBOARD",
"label": "DB name",
"description": "Create a Datasource in Grafana that points to jmeter database",
"type": "datasource",
"pluginId": "influxdb",
"pluginName": "InfluxDB"
},
{
"name": "VAR_MEASUREMENT_NAME",
"type": "constant",
"label": "Measurement name",
"value": "jmeter",
"description": "InfluxDB measurement name"
},
{
"name": "VAR_SEND_INTERVAL",
"type": "constant",
"label": "Backend send interval",
"value": "5",
"description": "in second, should match JMeter property \"backend_influxdb.send_interval\""
}
],
"__requires": [
{
"type": "grafana",
"id": "grafana",
"name": "Grafana",
"version": "4.6.2"
},
{
"type": "datasource",
"id": "influxdb",
"name": "InfluxDB",
"version": "1.4.0"
},
{
"type": "panel",
"id": "graph",
"name": "Graph",
"version": ""
},
{
"type": "panel",
"id": "singlestat",
"name": "Singlestat",
"version": ""
},
{
"type": "panel",
"id": "table",
"name": "Table",
"version": ""
}
],
"annotations": {
"list": [
{
"$$hashKey": "object:4298",
"builtIn": 1,
"datasource": "$data_source",
"enable": true,
"hide": false,
"iconColor": "rgba(0, 211, 255, 1)",
"limit": 100,
"name": "Start/stop marker",
"query": "select text from events where $timeFilter",
"showIn": 0,
"textColumn": "",
"type": "dashboard"
}
]
},
"description": "Monitor your Apache JMeter load test in real time with InfluxDB and Grafana.\r\nGet overall summary, errors details and particular transaction response times.",
"editable": true,
"gnetId": 5496,
"graphTooltip": 0,
"id": 5,
"iteration": 1523369228272,
"links": [],
"panels": [
{
"collapsed": false,
"gridPos": {
"h": 1,
"w": 24,
"x": 0,
"y": 0
},
"id": 33,
"panels": [],
"repeat": null,
"title": "Summary",
"type": "row"
},
{
"cacheTimeout": null,
"colorBackground": false,
"colorValue": true,
"colors": [
"#299c46",
"#e5ac0e",
"#d44a3a"
],
"datasource": "$data_source",
"decimals": 0,
"format": "none",
"gauge": {
"maxValue": 100,
"minValue": 0,
"show": false,
"thresholdLabels": false,
"thresholdMarkers": true
},
"gridPos": {
"h": 7,
"w": 4,
"x": 0,
"y": 1
},
"height": "",
"id": 26,
"interval": "[[send_interval]]s",
"links": [],
"mappingType": 1,
"mappingTypes": [
{
"name": "value to text",
"value": 1
},
{
"name": "range to text",
"value": 2
}
],
"maxDataPoints": 100,
"nullPointMode": "connected",
"nullText": null,
"postfix": " Requests",
"postfixFontSize": "50%",
"prefix": "",
"prefixFontSize": "50%",
"rangeMaps": [
{
"from": "null",
"text": "N/A",
"to": "null"
}
],
"sparkline": {
"fillColor": "rgba(31, 118, 189, 0.18)",
"full": false,
"lineColor": "#e5ac0e",
"show": false
},
"tableColumn": "",
"targets": [
{
"dsType": "influxdb",
"groupBy": [
{
"params": [
"$__interval"
],
"type": "time"
},
{
"params": [
"null"
],
"type": "fill"
}
],
"orderByTime": "ASC",
"policy": "default",
"query": "SELECT sum(\"count\") FROM \"$measurement_name\" WHERE (\"application\" =~ /^$application$/ AND \"transaction\" = 'all') AND $timeFilter GROUP BY time($__interval) fill(null)",
"rawQuery": true,
"refId": "A",
"resultFormat": "time_series",
"select": [
[
{
"params": [
"value"
],
"type": "field"
},
{
"params": [],
"type": "mean"
}
]
],
"tags": []
}
],
"thresholds": "",
"title": "Total Requests",
"type": "singlestat",
"valueFontSize": "80%",
"valueMaps": [
{
"op": "=",
"text": "0",
"value": "null"
}
],
"valueName": "total"
},
{
"cacheTimeout": null,
"colorBackground": false,
"colorValue": true,
"colors": [
"#299c46",
"#e24d42",
"#d44a3a"
],
"datasource": "$data_source",
"decimals": 0,
"format": "none",
"gauge": {
"maxValue": 100,
"minValue": 0,
"show": false,
"thresholdLabels": false,
"thresholdMarkers": true
},
"gridPos": {
"h": 7,
"w": 4,
"x": 4,
"y": 1
},
"height": "",
"id": 28,
"interval": "[[send_interval]]s",
"links": [],
"mappingType": 1,
"mappingTypes": [
{
"name": "value to text",
"value": 1
},
{
"name": "range to text",
"value": 2
}
],
"maxDataPoints": 100,
"nullPointMode": "connected",
"nullText": null,
"postfix": " Failed",
"postfixFontSize": "50%",
"prefix": "",
"prefixFontSize": "50%",
"rangeMaps": [
{
"from": "null",
"text": "N/A",
"to": "null"
}
],
"sparkline": {
"fillColor": "rgba(31, 118, 189, 0.18)",
"full": false,
"lineColor": "#bf1b00",
"show": false
},
"tableColumn": "",
"targets": [
{
"dsType": "influxdb",
"groupBy": [
{
"params": [
"$__interval"
],
"type": "time"
},
{
"params": [
"null"
],
"type": "fill"
}
],
"orderByTime": "ASC",
"policy": "default",
"query": "SELECT sum(\"countError\") FROM \"$measurement_name\" WHERE (\"transaction\" = 'all' AND \"application\" =~ /^$application$/) AND $timeFilter GROUP BY time($__interval) fill(null)",
"rawQuery": true,
"refId": "A",
"resultFormat": "time_series",
"select": [
[
{
"params": [
"value"
],
"type": "field"
},
{
"params": [],
"type": "mean"
}
]
],
"tags": []
}
],
"thresholds": "",
"title": "Failed Requests",
"type": "singlestat",
"valueFontSize": "80%",
"valueMaps": [
{
"op": "=",
"text": "0",
"value": "null"
}
],
"valueName": "total"
},
{
"cacheTimeout": null,
"colorBackground": false,
"colorValue": true,
"colors": [
"#299c46",
"#e24d42",
"#d44a3a"
],
"datasource": "$data_source",
"decimals": 0,
"format": "bytes",
"gauge": {
"maxValue": 100,
"minValue": 0,
"show": false,
"thresholdLabels": false,
"thresholdMarkers": true
},
"gridPos": {
"h": 7,
"w": 4,
"x": 8,
"y": 1
},
"height": "",
"id": 38,
"interval": "[[send_interval]]s",
"links": [],
"mappingType": 1,
"mappingTypes": [
{
"name": "value to text",
"value": 1
},
{
"name": "range to text",
"value": 2
}
],
"maxDataPoints": 100,
"nullPointMode": "connected",
"nullText": null,
"postfix": " ",
"postfixFontSize": "50%",
"prefix": "",
"prefixFontSize": "50%",
"rangeMaps": [
{
"from": "null",
"text": "N/A",
"to": "null"
}
],
"sparkline": {
"fillColor": "rgba(31, 118, 189, 0.18)",
"full": false,
"lineColor": "#bf1b00",
"show": false
},
"tableColumn": "",
"targets": [
{
"dsType": "influxdb",
"groupBy": [
{
"params": [
"$__interval"
],
"type": "time"
},
{
"params": [
"null"
],
"type": "fill"
}
],
"orderByTime": "ASC",
"policy": "default",
"query": "SELECT sum(\"rb\") FROM \"$measurement_name\" WHERE (\"transaction\" = 'all' AND \"application\" =~ /^$application$/) AND $timeFilter ",
"rawQuery": true,
"refId": "A",
"resultFormat": "time_series",
"select": [
[
{
"params": [
"value"
],
"type": "field"
},
{
"params": [],
"type": "mean"
}
]
],
"tags": []
}
],
"thresholds": "",
"title": "Received Bytes",
"type": "singlestat",
"valueFontSize": "80%",
"valueMaps": [
{
"op": "=",
"text": "0",
"value": "null"
}
],
"valueName": "total"
},
{
"cacheTimeout": null,
"colorBackground": false,
"colorValue": true,
"colors": [
"#299c46",
"#e24d42",
"#d44a3a"
],
"datasource": "$data_source",
"decimals": 0,
"format": "bytes",
"gauge": {
"maxValue": 100,
"minValue": 0,
"show": false,
"thresholdLabels": false,
"thresholdMarkers": true
},
"gridPos": {
"h": 7,
"w": 4,
"x": 12,
"y": 1
},
"height": "",
"id": 37,
"interval": "[[send_interval]]s",
"links": [],
"mappingType": 1,
"mappingTypes": [
{
"name": "value to text",
"value": 1
},
{
"name": "range to text",
"value": 2
}
],
"maxDataPoints": 100,
"nullPointMode": "connected",
"nullText": null,
"postfix": " ",
"postfixFontSize": "50%",
"prefix": "",
"prefixFontSize": "50%",
"rangeMaps": [
{
"from": "null",
"text": "N/A",
"to": "null"
}
],
"sparkline": {
"fillColor": "rgba(31, 118, 189, 0.18)",
"full": false,
"lineColor": "#bf1b00",
"show": false
},
"tableColumn": "",
"targets": [
{
"dsType": "influxdb",
"groupBy": [
{
"params": [
"$__interval"
],
"type": "time"
},
{
"params": [
"null"
],
"type": "fill"
}
],
"orderByTime": "ASC",
"policy": "default",
"query": "SELECT max(\"sb\") FROM \"$measurement_name\" WHERE (\"transaction\" = 'all' AND \"application\" =~ /^$application$/) AND $timeFilter GROUP BY time($__interval) fill(null)",
"rawQuery": true,
"refId": "A",
"resultFormat": "time_series",
"select": [
[
{
"params": [
"value"
],
"type": "field"
},
{
"params": [],
"type": "mean"
}
]
],
"tags": []
}
],
"thresholds": "",
"title": "Sent Bytes",
"type": "singlestat",
"valueFontSize": "80%",
"valueMaps": [
{
"op": "=",
"text": "0",
"value": "null"
}
],
"valueName": "total"
},
{
"cacheTimeout": null,
"colorBackground": false,
"colorValue": true,
"colors": [
"#299c46",
"#ef843c",
"#e24d42"
],
"datasource": "$data_source",
"decimals": 2,
"format": "percentunit",
"gauge": {
"maxValue": 1,
"minValue": 0,
"show": true,
"thresholdLabels": false,
"thresholdMarkers": true
},
"gridPos": {
"h": 7,
"w": 8,
"x": 16,
"y": 1
},
"id": 29,
"interval": "[[send_interval]]s",
"links": [],
"mappingType": 1,
"mappingTypes": [
{
"name": "value to text",
"value": 1
},
{
"name": "range to text",
"value": 2
}
],
"maxDataPoints": 100,
"nullPointMode": "connected",
"nullText": null,
"postfix": "",
"postfixFontSize": "50%",
"prefix": "",
"prefixFontSize": "50%",
"rangeMaps": [
{
"from": "null",
"text": "N/A",
"to": "null"
}
],
"sparkline": {
"fillColor": "rgba(31, 118, 189, 0.18)",
"full": false,
"lineColor": "rgb(31, 120, 193)",
"show": false
},
"tableColumn": "",
"targets": [
{
"dsType": "influxdb",
"groupBy": [
{
"params": [
"$__interval"
],
"type": "time"
},
{
"params": [
"null"
],
"type": "fill"
}
],
"orderByTime": "ASC",
"policy": "default",
"query": "SELECT sum(\"error\") / sum(\"all\") FROM (SELECT sum(\"count\") AS \"all\" FROM \"$measurement_name\" WHERE \"transaction\" = 'all' AND \"application\" =~ /^$application$/ AND $timeFilter GROUP BY time($__interval) fill(null)), (SELECT sum(\"countError\") AS \"error\" FROM \"$measurement_name\" WHERE \"transaction\" = 'all' AND \"application\" =~ /^$application$/ AND $timeFilter GROUP BY time($__interval) fill(null))",
"rawQuery": true,
"refId": "A",
"resultFormat": "time_series",
"select": [
[
{
"params": [
"value"
],
"type": "field"
},
{
"params": [],
"type": "mean"
}
]
],
"tags": []
}
],
"thresholds": "0,0.01",
"title": "Error Rate %",
"type": "singlestat",
"valueFontSize": "50%",
"valueMaps": [
{
"op": "=",
"text": "0",
"value": "null"
}
],
"valueName": "total"
},
{
"aliasColors": {
"No of Errors": "#6ED0E0",
"Req / s": "#6ed0e0",
"Req / sec": "#65c5db"
},
"bars": false,
"dashLength": 10,
"dashes": false,
"datasource": "$data_source",
"decimals": 2,
"editable": true,
"error": false,
"fill": 7,
"gridPos": {
"h": 7,
"w": 8,
"x": 0,
"y": 8
},
"id": 4,
"interval": "[[send_interval]]s",
"legend": {
"alignAsTable": true,
"avg": true,
"current": false,
"max": true,
"min": true,
"rightSide": false,
"show": true,
"sort": null,
"sortDesc": null,
"total": false,
"values": true
},
"lines": true,
"linewidth": 1,
"links": [],
"nullPointMode": "null",
"percentage": false,
"pointradius": 1,
"points": false,
"renderer": "flot",
"seriesOverrides": [],
"spaceLength": 10,
"stack": false,
"steppedLine": false,
"targets": [
{
"alias": "Req / s",
"dsType": "influxdb",
"groupBy": [
{
"params": [
"$__interval"
],
"type": "time"
}
],
"measurement": "jmeter",
"orderByTime": "ASC",
"policy": "default",
"query": "SELECT mean(\"count\") / $send_interval FROM \"$measurement_name\" WHERE (\"transaction\" = 'all' AND \"application\" =~ /^$application$/) AND $timeFilter GROUP BY time($__interval) fill(null)",
"rawQuery": true,
"refId": "B",
"resultFormat": "time_series",
"select": [
[
{
"params": [
"count"
],
"type": "field"
},
{
"params": [],
"type": "last"
}
]
],
"tags": [
{
"key": "transaction",
"operator": "=",
"value": "all"
},
{
"condition": "AND",
"key": "application",
"operator": "=~",
"value": "/^$application$/"
}
]
}
],
"thresholds": [],
"timeFrom": null,
"timeShift": null,
"title": "Total Throughput",
"tooltip": {
"msResolution": false,
"shared": true,
"sort": 0,
"value_type": "individual"
},
"type": "graph",
"xaxis": {
"buckets": null,
"mode": "time",
"name": null,
"show": true,
"values": []
},
"yaxes": [
{
"format": "short",
"label": null,
"logBase": 1,
"max": null,
"min": null,
"show": true
},
{
"format": "short",
"label": null,
"logBase": 1,
"max": null,
"min": null,
"show": false
}
]
},
{
"aliasColors": {
"No of Errors": "#BF1B00",
"Num of Errors": "#bf1b00"
},
"bars": false,
"dashLength": 10,
"dashes": false,
"datasource": "$data_source",
"decimals": 0,
"editable": true,
"error": false,
"fill": 7,
"gridPos": {
"h": 7,
"w": 8,
"x": 8,
"y": 8
},
"id": 2,
"interval": "[[send_interval]]s",
"legend": {
"alignAsTable": true,
"avg": false,
"current": false,
"max": false,
"min": false,
"rightSide": false,
"show": true,
"total": true,
"values": true
},
"lines": true,
"linewidth": 1,
"links": [],
"nullPointMode": "null",
"percentage": false,
"pointradius": 1,
"points": false,
"renderer": "flot",
"seriesOverrides": [],
"spaceLength": 10,
"stack": false,
"steppedLine": false,
"targets": [
{
"alias": "Num of Errors",
"dsType": "influxdb",
"groupBy": [
{
"params": [
"$aggregation"
],
"type": "time"
},
{
"params": [
"null"
],
"type": "fill"
}
],
"measurement": "jmeter",
"orderByTime": "ASC",
"policy": "default",
"query": "SELECT sum(\"countError\") FROM \"$measurement_name\" WHERE (\"transaction\" = 'all' AND \"application\" =~ /^$application$/) AND $timeFilter GROUP BY time($__interval) fill(null)",
"rawQuery": true,
"refId": "B",
"resultFormat": "time_series",
"select": [
[
{
"params": [
"countError"
],
"type": "field"
},
{
"params": [],
"type": "sum"
}
]
],
"tags": [
{
"key": "transaction",
"operator": "=",
"value": "all"
},
{
"condition": "AND",
"key": "application",
"operator": "=~",
"value": "/^$application$/"
}
]
}
],
"thresholds": [],
"timeFrom": null,
"timeShift": null,
"title": "Total Errors",
"tooltip": {
"msResolution": false,
"shared": true,
"sort": 0,
"value_type": "individual"
},
"type": "graph",
"xaxis": {
"buckets": null,
"mode": "time",
"name": null,
"show": true,
"values": []
},
"yaxes": [
{
"decimals": 0,
"format": "short",
"label": null,
"logBase": 1,
"max": null,
"min": null,
"show": true
},
{
"format": "short",
"label": null,
"logBase": 1,
"max": null,
"min": null,
"show": false
}
]
},
{
"aliasColors": {
"Threads": "#614d93",
"threads": "#614d93"
},
"bars": false,
"dashLength": 10,
"dashes": false,
"datasource": "$data_source",
"decimals": 0,
"fill": 7,
"gridPos": {
"h": 7,
"w": 8,
"x": 16,
"y": 8
},
"id": 31,
"interval": "[[send_interval]]s",
"legend": {
"alignAsTable": true,
"avg": false,
"current": true,
"max": false,
"min": false,
"show": true,
"total": false,
"values": true
},
"lines": true,
"linewidth": 1,
"links": [],
"nullPointMode": "null",
"percentage": false,
"pointradius": 5,
"points": false,
"renderer": "flot",
"seriesOverrides": [],
"spaceLength": 10,
"stack": false,
"steppedLine": false,
"targets": [
{
"alias": "Threads",
"dsType": "influxdb",
"groupBy": [
{
"params": [
"$__interval"
],
"type": "time"
},
{
"params": [
"null"
],
"type": "fill"
}
],
"orderByTime": "ASC",
"policy": "default",
"query": "SELECT last(\"maxAT\") FROM \"$measurement_name\" WHERE (\"transaction\" = 'internal' AND \"application\" =~ /^$application$/) AND $timeFilter GROUP BY time($__interval) fill(null)",
"rawQuery": true,
"refId": "A",
"resultFormat": "time_series",
"select": [
[
{
"params": [
"value"
],
"type": "field"
},
{
"params": [],
"type": "mean"
}
]
],
"tags": []
}
],
"thresholds": [],
"timeFrom": null,
"timeShift": null,
"title": "Active Threads",
"tooltip": {
"shared": true,
"sort": 0,
"value_type": "individual"
},
"type": "graph",
"xaxis": {
"buckets": null,
"mode": "time",
"name": null,
"show": true,
"values": []
},
"yaxes": [
{
"decimals": 0,
"format": "short",
"label": null,
"logBase": 1,
"max": null,
"min": null,
"show": true
},
{
"format": "short",
"label": null,
"logBase": 1,
"max": null,
"min": null,
"show": true
}
]
},
{
"aliasColors": {
"banner": "#508642"
},
"bars": false,
"dashLength": 10,
"dashes": false,
"datasource": "$data_source",
"decimals": 2,
"editable": true,
"error": false,
"fill": 1,
"gridPos": {
"h": 7,
"w": 24,
"x": 0,
"y": 15
},
"height": "",
"id": 23,
"interval": "[[send_interval]]s",
"legend": {
"alignAsTable": true,
"avg": true,
"current": false,
"hideEmpty": false,
"hideZero": false,
"max": true,
"min": false,
"rightSide": true,
"show": true,
"total": false,
"values": true
},
"lines": true,
"linewidth": 1,
"links": [],
"nullPointMode": "null",
"percentage": false,
"pointradius": 1,
"points": false,
"renderer": "flot",
"repeat": null,
"repeatDirection": "h",
"seriesOverrides": [],
"spaceLength": 10,
"stack": false,
"steppedLine": false,
"targets": [
{
"alias": "$tag_transaction",
"dsType": "influxdb",
"groupBy": [
{
"params": [
"transaction"
],
"type": "tag"
}
],
"measurement": "jmeter",
"orderByTime": "ASC",
"policy": "default",
"query": "SELECT mean(\"pct95.0\") FROM \"$measurement_name\" WHERE (\"application\" =~ /^$application$/) AND $timeFilter GROUP BY \"transaction\", time($__interval) fill(null)",
"rawQuery": true,
"refId": "B",
"resultFormat": "time_series",
"select": [
[
{
"params": [
"pct95.0"
],
"type": "field"
}
]
],
"tags": [
{
"key": "statut",
"operator": "=",
"value": "ok"
},
{
"condition": "AND",
"key": "application",
"operator": "=~",
"value": "/^$application$/"
}
]
}
],
"thresholds": [
{
"colorMode": "ok",
"fill": true,
"line": true,
"op": "lt",
"value": 500
},
{
"colorMode": "warning",
"fill": false,
"line": true,
"op": "gt",
"value": 1500
},
{
"colorMode": "critical",
"fill": true,
"line": true,
"op": "gt",
"value": 5000
}
],
"timeFrom": null,
"timeShift": null,
"title": "Transactions Response Times (95th pct)",
"tooltip": {
"msResolution": false,
"shared": true,
"sort": 0,
"value_type": "individual"
},
"transparent": false,
"type": "graph",
"xaxis": {
"buckets": null,
"mode": "time",
"name": null,
"show": true,
"values": []
},
"yaxes": [
{
"format": "ms",
"label": null,
"logBase": 1,
"max": null,
"min": null,
"show": true
},
{
"format": "short",
"label": null,
"logBase": 1,
"max": null,
"min": null,
"show": false
}
]
},
{
"aliasColors": {
"banner": "#508642"
},
"bars": false,
"dashLength": 10,
"dashes": false,
"datasource": "$data_source",
"decimals": 2,
"editable": true,
"error": false,
"fill": 1,
"gridPos": {
"h": 7,
"w": 24,
"x": 0,
"y": 22
},
"height": "",
"id": 36,
"interval": "[[send_interval]]s",
"legend": {
"alignAsTable": true,
"avg": true,
"current": false,
"hideEmpty": false,
"hideZero": false,
"max": true,
"min": false,
"rightSide": true,
"show": true,
"total": false,
"values": true
},
"lines": true,
"linewidth": 1,
"links": [],
"nullPointMode": "null",
"percentage": false,
"pointradius": 1,
"points": false,
"renderer": "flot",
"seriesOverrides": [],
"spaceLength": 10,
"stack": false,
"steppedLine": false,
"targets": [
{
"alias": "$tag_transaction",
"groupBy": [
{
"params": [
"$__interval"
],
"type": "time"
},
{
"params": [
"null"
],
"type": "fill"
}
],
"orderByTime": "ASC",
"policy": "default",
"query": "SELECT mean(\"sb\") FROM \"$measurement_name\" WHERE (\"application\" =~ /^$application$/) AND $timeFilter GROUP BY \"transaction\", time($__interval) fill(null)",
"rawQuery": true,
"refId": "A",
"resultFormat": "time_series",
"select": [
[
{
"params": [
"sb"
],
"type": "field"
},
{
"params": [],
"type": "mean"
}
]
],
"tags": []
},
{
"alias": "$tag_transaction",
"groupBy": [
{
"params": [
"$__interval"
],
"type": "time"
},
{
"params": [
"null"
],
"type": "fill"
}
],
"orderByTime": "ASC",
"policy": "default",
"query": "SELECT mean(\"rb\") FROM \"$measurement_name\" WHERE (\"application\" =~ /^$application$/) AND $timeFilter GROUP BY \"transaction\", time($__interval) fill(null)",
"rawQuery": true,
"refId": "B",
"resultFormat": "time_series",
"select": [
[
{
"params": [
"value"
],
"type": "field"
},
{
"params": [],
"type": "mean"
}
]
],
"tags": []
}
],
"thresholds": [
{
"colorMode": "ok",
"fill": true,
"line": true,
"op": "lt",
"value": 500
},
{
"colorMode": "warning",
"fill": false,
"line": true,
"op": "gt",
"value": 1500
},
{
"colorMode": "critical",
"fill": true,
"line": true,
"op": "gt",
"value": 5000
}
],
"timeFrom": null,
"timeShift": null,
"title": "Network Traffic",
"tooltip": {
"msResolution": false,
"shared": true,
"sort": 0,
"value_type": "individual"
},
"transparent": false,
"type": "graph",
"xaxis": {
"buckets": null,
"mode": "time",
"name": null,
"show": true,
"values": []
},
"yaxes": [
{
"format": "bytes",
"label": null,
"logBase": 1,
"max": null,
"min": null,
"show": true
},
{
"format": "short",
"label": null,
"logBase": 1,
"max": null,
"min": null,
"show": false
}
]
},
{
"collapsed": true,
"gridPos": {
"h": 1,
"w": 24,
"x": 0,
"y": 29
},
"id": 34,
"panels": [
{
"columns": [],
"datasource": "$data_source",
"fontSize": "100%",
"gridPos": {
"h": 7,
"w": 8,
"x": 0,
"y": 2
},
"height": "",
"id": 25,
"interval": "[[send_interval]]s",
"links": [],
"pageSize": null,
"scroll": true,
"showHeader": true,
"sort": {
"col": 2,
"desc": true
},
"styles": [
{
"alias": "Time",
"dateFormat": "YYYY-MM-DD HH:mm:ss",
"pattern": "Time",
"type": "hidden"
},
{
"alias": "",
"colorMode": null,
"colors": [
"rgba(245, 54, 54, 0.9)",
"rgba(237, 129, 40, 0.89)",
"rgba(50, 172, 45, 0.97)"
],
"decimals": 0,
"pattern": "/.*/",
"thresholds": [],
"type": "number",
"unit": "short"
}
],
"targets": [
{
"alias": "$tag_transaction",
"dsType": "influxdb",
"groupBy": [
{
"params": [
"transaction"
],
"type": "tag"
}
],
"measurement": "jmeter",
"orderByTime": "ASC",
"policy": "default",
"query": "SELECT sum(\"count\") FROM \"$measurement_name\" WHERE (\"application\" =~ /^$application$/ AND \"statut\" = 'ko') AND $timeFilter GROUP BY \"transaction\"",
"rawQuery": true,
"refId": "A",
"resultFormat": "table",
"select": [
[
{
"params": [
"count"
],
"type": "field"
},
{
"params": [],
"type": "sum"
}
]
],
"tags": [
{
"key": "application",
"operator": "=~",
"value": "/^$application$/"
},
{
"condition": "AND",
"key": "statut",
"operator": "=",
"value": "ko"
}
]
}
],
"title": "Errors per Transaction",
"transform": "table",
"type": "table"
},
{
"columns": [],
"datasource": "$data_source",
"fontSize": "100%",
"gridPos": {
"h": 7,
"w": 16,
"x": 8,
"y": 2
},
"id": 27,
"interval": "[[send_interval]]s",
"links": [],
"pageSize": null,
"scroll": true,
"showHeader": true,
"sort": {
"col": 0,
"desc": true
},
"styles": [
{
"alias": "Time",
"dateFormat": "YYYY-MM-DD HH:mm:ss",
"pattern": "Time",
"type": "hidden"
},
{
"alias": "",
"colorMode": null,
"colors": [
"rgba(245, 54, 54, 0.9)",
"rgba(237, 129, 40, 0.89)",
"rgba(50, 172, 45, 0.97)"
],
"decimals": 0,
"pattern": "/.*/",
"thresholds": [],
"type": "number",
"unit": "short"
}
],
"targets": [
{
"alias": "$tag_responseCode",
"dsType": "influxdb",
"groupBy": [
{
"params": [
"responseCode"
],
"type": "tag"
}
],
"measurement": "jmeter",
"orderByTime": "ASC",
"policy": "default",
"query": "SELECT sum(\"count\") FROM \"$measurement_name\" WHERE (\"application\" =~ /^$application$/ AND \"responseCode\" !~ /^$/) AND $timeFilter GROUP BY \"responseCode\",\"responseMessage\"",
"rawQuery": true,
"refId": "A",
"resultFormat": "table",
"select": [
[
{
"params": [
"count"
],
"type": "field"
}
],
[
{
"params": [
"responseMessage"
],
"type": "field"
}
]
],
"tags": [
{
"key": "application",
"operator": "=~",
"value": "/^$application$/"
},
{
"condition": "AND",
"key": "responseCode",
"operator": "!~",
"value": "/^$/"
}
]
}
],
"title": "Error Info",
"transform": "table",
"type": "table"
}
],
"repeat": null,
"title": "Errors",
"type": "row"
},
{
"collapsed": false,
"gridPos": {
"h": 1,
"w": 24,
"x": 0,
"y": 30
},
"id": 35,
"panels": [],
"repeat": null,
"title": "Individual Transaction - $transaction",
"type": "row"
},
{
"cacheTimeout": null,
"colorBackground": false,
"colorValue": true,
"colors": [
"rgba(245, 54, 54, 0.9)",
"#e5ac0e",
"rgba(50, 172, 45, 0.97)"
],
"datasource": "$data_source",
"decimals": 0,
"editable": true,
"error": false,
"format": "none",
"gauge": {
"maxValue": 100,
"minValue": 0,
"show": false,
"thresholdLabels": false,
"thresholdMarkers": true
},
"gridPos": {
"h": 7,
"w": 8,
"x": 0,
"y": 31
},
"id": 9,
"interval": "[[send_interval]]s",
"links": [],
"mappingType": 1,
"mappingTypes": [
{
"name": "value to text",
"value": 1
},
{
"name": "range to text",
"value": 2
}
],
"maxDataPoints": 100,
"nullPointMode": "connected",
"nullText": null,
"postfix": " Requests",
"postfixFontSize": "50%",
"prefix": "",
"prefixFontSize": "50%",
"rangeMaps": [
{
"from": "null",
"text": "N/A",
"to": "null"
}
],
"sparkline": {
"fillColor": "rgba(31, 118, 189, 0.18)",
"full": false,
"lineColor": "#e5ac0e",
"show": false
},
"tableColumn": "",
"targets": [
{
"dsType": "influxdb",
"groupBy": [
{
"params": [
"$__interval"
],
"type": "time"
},
{
"params": [
"null"
],
"type": "fill"
}
],
"measurement": "jmeter",
"orderByTime": "ASC",
"policy": "default",
"query": "SELECT sum(\"count\") FROM \"$measurement_name\" WHERE (\"application\" =~ /^$application$/ AND \"transaction\" =~ /^$transaction$/ AND \"statut\" = 'all') AND $timeFilter GROUP BY time($__interval) fill(null)",
"rawQuery": true,
"refId": "A",
"resultFormat": "time_series",
"select": [
[
{
"params": [
"count"
],
"type": "field"
},
{
"params": [],
"type": "sum"
}
]
],
"tags": [
{
"key": "transaction",
"operator": "=~",
"value": "/^$transaction$/"
},
{
"condition": "AND",
"key": "statut",
"operator": "=",
"value": "all"
}
]
}
],
"thresholds": "",
"title": "Total Requests - $transaction",
"type": "singlestat",
"valueFontSize": "80%",
"valueMaps": [
{
"op": "=",
"text": "0",
"value": "null"
}
],
"valueName": "total"
},
{
"cacheTimeout": null,
"colorBackground": false,
"colorValue": true,
"colors": [
"rgba(245, 54, 54, 0.9)",
"#e24d42",
"rgba(50, 172, 45, 0.97)"
],
"datasource": "$data_source",
"decimals": 0,
"editable": true,
"error": false,
"format": "none",
"gauge": {
"maxValue": 100,
"minValue": 0,
"show": false,
"thresholdLabels": false,
"thresholdMarkers": true
},
"gridPos": {
"h": 7,
"w": 8,
"x": 8,
"y": 31
},
"id": 6,
"interval": "[[send_interval]]s",
"links": [],
"mappingType": 1,
"mappingTypes": [
{
"name": "value to text",
"value": 1
},
{
"name": "range to text",
"value": 2
}
],
"maxDataPoints": 100,
"nullPointMode": "connected",
"nullText": null,
"postfix": " Failed",
"postfixFontSize": "50%",
"prefix": "",
"prefixFontSize": "50%",
"rangeMaps": [
{
"from": "null",
"text": "N/A",
"to": "null"
}
],
"sparkline": {
"fillColor": "rgba(31, 118, 189, 0.18)",
"full": false,
"lineColor": "#e24d42",
"show": false
},
"tableColumn": "",
"targets": [
{
"dsType": "influxdb",
"groupBy": [
{
"params": [
"$__interval"
],
"type": "time"
},
{
"params": [
"null"
],
"type": "fill"
}
],
"measurement": "jmeter",
"orderByTime": "ASC",
"policy": "default",
"query": "SELECT sum(\"count\") FROM \"$measurement_name\" WHERE (\"application\" =~ /^$application$/ AND \"transaction\" =~ /^$transaction$/ AND \"statut\" = 'ko') AND $timeFilter GROUP BY time($__interval) fill(null)",
"rawQuery": true,
"refId": "A",
"resultFormat": "time_series",
"select": [
[
{
"params": [
"count"
],
"type": "field"
},
{
"params": [],
"type": "sum"
}
]
],
"tags": [
{
"key": "transaction",
"operator": "=~",
"value": "/^$transaction$/"
},
{
"condition": "AND",
"key": "statut",
"operator": "=",
"value": "ko"
}
]
}
],
"thresholds": "",
"title": "Failed Requests - $transaction",
"type": "singlestat",
"valueFontSize": "80%",
"valueMaps": [
{
"op": "=",
"text": "0",
"value": "null"
}
],
"valueName": "total"
},
{
"cacheTimeout": null,
"colorBackground": false,
"colorValue": true,
"colors": [
"rgba(50, 172, 45, 0.97)",
"#e5ac0e",
"#e24d42"
],
"datasource": "$data_source",
"decimals": 2,
"editable": true,
"error": false,
"format": "percentunit",
"gauge": {
"maxValue": 1,
"minValue": 0,
"show": true,
"thresholdLabels": false,
"thresholdMarkers": true
},
"gridPos": {
"h": 7,
"w": 8,
"x": 16,
"y": 31
},
"id": 8,
"interval": "[[send_interval]]s",
"links": [],
"mappingType": 1,
"mappingTypes": [
{
"name": "value to text",
"value": 1
},
{
"name": "range to text",
"value": 2
}
],
"maxDataPoints": 100,
"nullPointMode": "connected",
"nullText": null,
"postfix": "",
"postfixFontSize": "50%",
"prefix": "",
"prefixFontSize": "50%",
"rangeMaps": [
{
"from": "null",
"text": "N/A",
"to": "null"
}
],
"sparkline": {
"fillColor": "rgba(31, 118, 189, 0.18)",
"full": false,
"lineColor": "rgb(14, 237, 45)",
"show": false
},
"tableColumn": "",
"targets": [
{
"dsType": "influxdb",
"groupBy": [
{
"params": [
"$__interval"
],
"type": "time"
},
{
"params": [
"null"
],
"type": "fill"
}
],
"measurement": "jmeter",
"orderByTime": "ASC",
"policy": "default",
"query": "SELECT sum(\"error\") / sum(\"all\") FROM (SELECT sum(\"count\") AS \"all\" FROM \"$measurement_name\" WHERE \"transaction\" =~ /^$transaction$/ AND \"statut\" = 'all' AND \"application\" =~ /^$application$/ AND $timeFilter GROUP BY time($__interval) fill(null)), (SELECT sum(\"count\") AS \"error\" FROM \"$measurement_name\" WHERE \"transaction\" =~ /^$transaction$/ AND \"statut\" = 'ko' AND \"application\" =~ /^$application$/ AND $timeFilter GROUP BY time($__interval) fill(null))",
"rawQuery": true,
"refId": "A",
"resultFormat": "time_series",
"select": [
[
{
"params": [
"count"
],
"type": "field"
},
{
"params": [],
"type": "sum"
}
]
],
"tags": [
{
"key": "transaction",
"operator": "=~",
"value": "/^$transaction$/"
},
{
"condition": "AND",
"key": "statut",
"operator": "=",
"value": "ok"
}
]
}
],
"thresholds": "0,0.01",
"title": "Error Rate % - $transaction",
"type": "singlestat",
"valueFontSize": "50%",
"valueMaps": [
{
"op": "=",
"text": "0",
"value": "null"
}
],
"valueName": "total"
},
{
"aliasColors": {
"90th Percentage": "#EAB839",
"95th Percentage": "#EF843C",
"99th Percentage": "#99440A",
"Average": "#3F6833",
"Max": "#58140C",
"Req / s": "#6ed0e0"
},
"bars": false,
"dashLength": 10,
"dashes": false,
"datasource": "$data_source",
"decimals": 2,
"editable": true,
"error": false,
"fill": 7,
"gridPos": {
"h": 7,
"w": 12,
"x": 0,
"y": 38
},
"height": "",
"id": 10,
"interval": "[[send_interval]]s",
"legend": {
"alignAsTable": true,
"avg": true,
"current": false,
"max": true,
"min": true,
"rightSide": false,
"show": true,
"total": false,
"values": true
},
"lines": true,
"linewidth": 1,
"links": [],
"nullPointMode": "null",
"percentage": false,
"pointradius": 1,
"points": false,
"renderer": "flot",
"seriesOverrides": [
{
"alias": "Average",
"yaxis": 1
}
],
"spaceLength": 10,
"stack": false,
"steppedLine": false,
"targets": [
{
"alias": "Req / s",
"dsType": "influxdb",
"groupBy": [
{
"params": [
"$__interval"
],
"type": "time"
}
],
"measurement": "jmeter",
"orderByTime": "ASC",
"policy": "default",
"query": "SELECT last(\"count\") / $send_interval FROM \"$measurement_name\" WHERE (\"transaction\" =~ /^$transaction$/ AND \"statut\" = 'ok') AND $timeFilter GROUP BY time($__interval)",
"rawQuery": true,
"refId": "B",
"resultFormat": "time_series",
"select": [
[
{
"params": [
"count"
],
"type": "field"
},
{
"params": [],
"type": "sum"
},
{
"params": [
"5s"
],
"type": "non_negative_derivative"
}
]
],
"tags": [
{
"key": "transaction",
"operator": "=~",
"value": "/^$transaction$/"
},
{
"condition": "AND",
"key": "statut",
"operator": "=",
"value": "ok"
}
]
}
],
"thresholds": [],
"timeFrom": null,
"timeShift": null,
"title": "Throughput - $transaction",
"tooltip": {
"msResolution": false,
"shared": true,
"sort": 0,
"value_type": "individual"
},
"type": "graph",
"xaxis": {
"buckets": null,
"mode": "time",
"name": null,
"show": true,
"values": []
},
"yaxes": [
{
"format": "short",
"label": null,
"logBase": 1,
"max": null,
"min": null,
"show": true
},
{
"format": "short",
"label": null,
"logBase": 1,
"max": null,
"min": null,
"show": false
}
]
},
{
"aliasColors": {
"Num of Errors": "#bf1b00",
"num of errors": "#bf1b00"
},
"bars": false,
"dashLength": 10,
"dashes": false,
"datasource": "$data_source",
"decimals": 0,
"fill": 7,
"gridPos": {
"h": 7,
"w": 12,
"x": 12,
"y": 38
},
"id": 32,
"interval": "[[send_interval]]s",
"legend": {
"alignAsTable": true,
"avg": false,
"current": false,
"max": false,
"min": false,
"rightSide": false,
"show": true,
"total": true,
"values": true
},
"lines": true,
"linewidth": 1,
"links": [],
"nullPointMode": "null",
"percentage": false,
"pointradius": 1,
"points": true,
"renderer": "flot",
"seriesOverrides": [],
"spaceLength": 10,
"stack": false,
"steppedLine": false,
"targets": [
{
"alias": "Num of Errors",
"dsType": "influxdb",
"groupBy": [
{
"params": [
"$__interval"
],
"type": "time"
},
{
"params": [
"null"
],
"type": "fill"
}
],
"orderByTime": "ASC",
"policy": "default",
"query": "SELECT sum(\"count\") FROM \"$measurement_name\" WHERE \"application\" =~ /^$application$/ AND \"transaction\" =~ /^$transaction$/ AND \"statut\" = 'ko' AND $timeFilter GROUP BY time($__interval) fill(null)",
"rawQuery": true,
"refId": "A",
"resultFormat": "time_series",
"select": [
[
{
"params": [
"value"
],
"type": "field"
},
{
"params": [],
"type": "mean"
}
]
],
"tags": []
}
],
"thresholds": [],
"timeFrom": null,
"timeShift": null,
"title": "Errors",
"tooltip": {
"shared": true,
"sort": 0,
"value_type": "individual"
},
"type": "graph",
"xaxis": {
"buckets": 1,
"mode": "time",
"name": null,
"show": true,
"values": []
},
"yaxes": [
{
"decimals": 0,
"format": "short",
"label": null,
"logBase": 1,
"max": null,
"min": null,
"show": true
},
{
"format": "short",
"label": null,
"logBase": 1,
"max": null,
"min": null,
"show": true
}
]
},
{
"aliasColors": {
"90th Percentage": "#f2c96d",
"95th Percentage": "#EF843C",
"99th Percentage": "#bf1b00",
"Average": "#7eb26d",
"Max": "#584477",
"Median": "#6ed0e0",
"median": "#6ed0e0"
},
"bars": false,
"dashLength": 10,
"dashes": false,
"datasource": "$data_source",
"decimals": 2,
"editable": true,
"error": false,
"fill": 1,
"gridPos": {
"h": 7,
"w": 24,
"x": 0,
"y": 45
},
"height": "",
"id": 5,
"interval": "[[send_interval]]s",
"legend": {
"alignAsTable": true,
"avg": true,
"current": false,
"hideEmpty": true,
"max": true,
"min": false,
"rightSide": true,
"show": true,
"sortDesc": true,
"total": false,
"values": true
},
"lines": true,
"linewidth": 1,
"links": [],
"nullPointMode": "null",
"percentage": false,
"pointradius": 1,
"points": false,
"renderer": "flot",
"seriesOverrides": [
{
"alias": "Average",
"yaxis": 1
}
],
"spaceLength": 10,
"stack": false,
"steppedLine": false,
"targets": [
{
"alias": "Average",
"dsType": "influxdb",
"groupBy": [
{
"params": [
"$aggregation"
],
"type": "time"
},
{
"params": [
"null"
],
"type": "fill"
}
],
"measurement": "jmeter",
"orderByTime": "ASC",
"policy": "default",
"query": "SELECT last(\"avg\") FROM \"$measurement_name\" WHERE (\"transaction\" =~ /^$transaction$/ AND \"statut\" = 'ok') AND $timeFilter GROUP BY time($__interval)",
"rawQuery": true,
"refId": "A",
"resultFormat": "time_series",
"select": [
[
{
"params": [
"avg"
],
"type": "field"
},
{
"params": [],
"type": "last"
}
]
],
"tags": [
{
"key": "transaction",
"operator": "=~",
"value": "/^$request$/"
},
{
"condition": "AND",
"key": "statut",
"operator": "=",
"value": "ok"
}
]
},
{
"alias": "Median",
"dsType": "influxdb",
"groupBy": [
{
"params": [
"$aggregation"
],
"type": "time"
},
{
"params": [
"null"
],
"type": "fill"
}
],
"hide": false,
"measurement": "jmeter",
"orderByTime": "ASC",
"policy": "default",
"query": "SELECT last(\"pct50.0\") FROM \"$measurement_name\" WHERE (\"transaction\" =~ /^$transaction$/ AND \"statut\" = 'ok') AND $timeFilter GROUP BY time($__interval)",
"rawQuery": true,
"refId": "F",
"resultFormat": "time_series",
"select": [
[
{
"params": [
"pct50.0"
],
"type": "field"
},
{
"params": [],
"type": "last"
}
]
],
"tags": [
{
"key": "transaction",
"operator": "=~",
"value": "/^$request$/"
},
{
"condition": "AND",
"key": "statut",
"operator": "=",
"value": "all"
}
]
},
{
"alias": "90th Percentile",
"dsType": "influxdb",
"groupBy": [
{
"params": [
"$aggregation"
],
"type": "time"
},
{
"params": [
"null"
],
"type": "fill"
}
],
"measurement": "jmeter",
"orderByTime": "ASC",
"policy": "default",
"query": "SELECT last(\"pct90.0\") FROM \"$measurement_name\" WHERE (\"transaction\" =~ /^$transaction$/ AND \"statut\" = 'ok') AND $timeFilter GROUP BY time($__interval) fill(null)",
"rawQuery": true,
"refId": "B",
"resultFormat": "time_series",
"select": [
[
{
"params": [
"pct90.0"
],
"type": "field"
},
{
"params": [],
"type": "last"
}
]
],
"tags": [
{
"key": "transaction",
"operator": "=~",
"value": "/^$request$/"
},
{
"condition": "AND",
"key": "statut",
"operator": "=",
"value": "all"
}
]
},
{
"alias": "95th Percentile",
"dsType": "influxdb",
"groupBy": [
{
"params": [
"$aggregation"
],
"type": "time"
},
{
"params": [
"null"
],
"type": "fill"
}
],
"hide": false,
"measurement": "jmeter",
"orderByTime": "ASC",
"policy": "default",
"query": "SELECT last(\"pct95.0\") FROM \"$measurement_name\" WHERE (\"transaction\" =~ /^$transaction$/ AND \"statut\" = 'ok') AND $timeFilter GROUP BY time($__interval) fill(null)",
"rawQuery": true,
"refId": "C",
"resultFormat": "time_series",
"select": [
[
{
"params": [
"pct95.0"
],
"type": "field"
},
{
"params": [],
"type": "last"
}
]
],
"tags": [
{
"key": "transaction",
"operator": "=~",
"value": "/^$request$/"
}
]
},
{
"alias": "99th Percentile",
"dsType": "influxdb",
"groupBy": [
{
"params": [
"$aggregation"
],
"type": "time"
},
{
"params": [
"null"
],
"type": "fill"
}
],
"hide": false,
"measurement": "jmeter",
"orderByTime": "ASC",
"policy": "default",
"query": "SELECT last(\"pct99.0\") FROM \"$measurement_name\" WHERE (\"transaction\" =~ /^$transaction$/ AND \"statut\" = 'ok') AND $timeFilter GROUP BY time($__interval) fill(null)",
"rawQuery": true,
"refId": "D",
"resultFormat": "time_series",
"select": [
[
{
"params": [
"pct99.0"
],
"type": "field"
},
{
"params": [],
"type": "last"
}
]
],
"tags": [
{
"key": "transaction",
"operator": "=~",
"value": "/^$request$/"
}
]
},
{
"alias": "Max",
"dsType": "influxdb",
"groupBy": [
{
"params": [
"$aggregation"
],
"type": "time"
},
{
"params": [
"null"
],
"type": "fill"
}
],
"measurement": "jmeter",
"orderByTime": "ASC",
"policy": "default",
"query": "SELECT last(\"max\") FROM \"$measurement_name\" WHERE (\"transaction\" =~ /^$transaction$/ AND \"statut\" = 'ok') AND $timeFilter GROUP BY time($__interval) fill(null)",
"rawQuery": true,
"refId": "E",
"resultFormat": "time_series",
"select": [
[
{
"params": [
"max"
],
"type": "field"
},
{
"params": [],
"type": "last"
}
]
],
"tags": [
{
"key": "transaction",
"operator": "=~",
"value": "/^$request$/"
},
{
"condition": "AND",
"key": "statut",
"operator": "=",
"value": "ok"
}
]
}
],
"thresholds": [
{
"colorMode": "ok",
"fill": true,
"line": true,
"op": "lt",
"value": 500
},
{
"colorMode": "warning",
"fill": false,
"line": true,
"op": "gt",
"value": 1500
},
{
"colorMode": "critical",
"fill": true,
"line": true,
"op": "gt",
"value": 5000
}
],
"timeFrom": null,
"timeShift": null,
"title": "Response Times - $transaction",
"tooltip": {
"msResolution": false,
"shared": true,
"sort": 0,
"value_type": "individual"
},
"type": "graph",
"xaxis": {
"buckets": null,
"mode": "time",
"name": null,
"show": true,
"values": []
},
"yaxes": [
{
"format": "ms",
"label": null,
"logBase": 1,
"max": null,
"min": null,
"show": true
},
{
"format": "short",
"label": null,
"logBase": 1,
"max": null,
"min": null,
"show": false
}
]
}
],
"refresh": false,
"schemaVersion": 16,
"style": "dark",
"tags": [
"load_test"
],
"templating": {
"list": [
{
"current": {
"text": "jmeter_influx",
"value": "jmeter_influx"
},
"hide": 0,
"label": "",
"name": "data_source",
"options": [],
"query": "influxdb",
"refresh": 1,
"regex": "",
"type": "datasource"
},
{
"allValue": null,
"current": {
"text": "JMeter_demo",
"value": "JMeter_demo"
},
"datasource": "$data_source",
"hide": 0,
"includeAll": false,
"label": "",
"multi": false,
"name": "application",
"options": [],
"query": "SHOW TAG VALUES FROM \"jmeter\" WITH KEY = \"application\"",
"refresh": 1,
"regex": "",
"sort": 0,
"tagValuesQuery": null,
"tags": [],
"tagsQuery": null,
"type": "query",
"useTags": false
},
{
"allValue": null,
"current": {
"text": "JR_OK",
"value": "JR_OK"
},
"datasource": "$data_source",
"hide": 0,
"includeAll": false,
"label": "",
"multi": false,
"name": "transaction",
"options": [],
"query": "SHOW TAG VALUES FROM \"jmeter\" WITH KEY = \"transaction\" WHERE \"application\" =~ /^$application$/ AND \"transaction\" != 'internal' AND \"transaction\" != 'all'",
"refresh": 1,
"regex": "",
"sort": 0,
"tagValuesQuery": null,
"tags": [],
"tagsQuery": null,
"type": "query",
"useTags": false
},
{
"current": {
"text": "jmeter",
"value": "jmeter"
},
"hide": 2,
"label": "Measurement name",
"name": "measurement_name",
"options": [
{
"text": "jmeter",
"value": "jmeter"
}
],
"query": "jmeter",
"type": "constant"
},
{
"current": {
"text": "5",
"value": "5"
},
"hide": 2,
"label": "Backend send interval in second",
"name": "send_interval",
"options": [
{
"text": "5",
"value": "5"
}
],
"query": "5",
"type": "constant"
}
]
},
"time": {
"from": "now-5m",
"to": "now"
},
"timepicker": {
"refresh_intervals": [
"5s",
"10s",
"30s",
"1m",
"5m",
"15m",
"30m",
"1h",
"2h",
"1d"
],
"time_options": [
"5m",
"15m",
"1h",
"6h",
"12h",
"24h",
"2d",
"7d",
"30d"
]
},
"timezone": "browser",
"title": "JMeter Dashboard",
"version": 4
}


 2029
2029

 被折叠的 条评论
为什么被折叠?
被折叠的 条评论
为什么被折叠?
 到【灌水乐园】发言


