


Pin(Intel)的文章中介绍了Pin的工作原理,Pin是一个dynamic instrumentation tool。Pin使用just-in-time(JIT) compiler来进行实时的insert,optimize code,以实现profiling、performance evalution 和bug detection的目的。
其架构如下图所示:
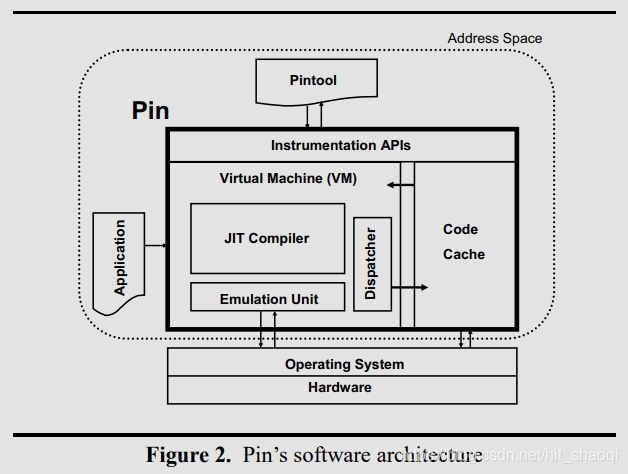
JIT compiler负责编译并instrument 应用代码,code cache负责暂存修改的代码。从code cache进入或离开VM就需要保存或恢复应用寄存器的状态。因为Pin工作在用户模式,所以需要由emulation uint来和系统进行交互。
使用动态二进制编译的可以与lib,license-check解耦,便于执行。
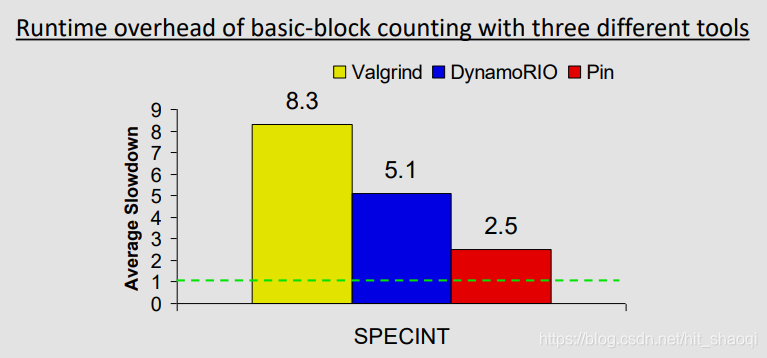
与其他工具的运行时间对比:
PinPoint用于自动寻找要仿真的程序片段,选择其中有代表性的,并产生trace。对于大的商业程序主要有两个挑战:
1) 程序运行时间长,如果在simulator进行完整的运行需要的时间会很久
2)这些程序通常有较大的资源需求,对操作系统和驱动有依赖,并且有license-checking机制,使得在simulator上很难运行
第一个问题我们通过SimPoint来克服(一个可以自动的进行phase analysis来找到有代表性区域的程序的方法)
第二个问题则使用Pin来收集SimPoint程序的prof
Intel Pin Tools以及PinPoints
最新推荐文章于 2025-02-14 09:40:23 发布
 最低0.47元/天 解锁文章


 2661
2661

 被折叠的 条评论
为什么被折叠?
被折叠的 条评论
为什么被折叠?
 到【灌水乐园】发言


