


#可视化分析
pip install mplfinance
import matplotlib.pyplot as plt
import pandas as pd
import mplfinance as mpf
import tushare as ts
df1= pd.read_excel('E:/111/102300210133-600133.xlsx')#这里填文件路径
fig,ax=plt.subplots(4,1,figsize=(11,10)) # 设置图表尺寸
df2= pd.read_excel('E:/111/102300210133-601133.xlsx')
df3= pd.read_excel('E:/111/102300210133-000002.xlsx')
df4= pd.read_excel('E:/111/102300210133-300093.xlsx')
#第一
x =np.arange(len(df1))
ax[0].plot(x,df['close'])
ax[0].set_title("close") #设置图名
ax[0].set_xlabel('trade_date')#设置x轴名称
ax[0].set_ylabel('close')
ax[0].legend
#第二
x =np.arange(len(df2))
ax[0].plot(x,df['close'])
ax[0].set_title("close") #设置图名
ax[0].set_xlabel('trade_date')#设置x轴名称
ax[0].set_ylabel('close')
ax[0].legend
#第三
x =np.arange(len(df3))
ax[0].plot(x,df['close'])
ax[0].set_title("close") #设置图名
ax[0].set_xlabel('trade_date')#设置x轴名称
ax[0].set_ylabel('close')
ax[0].legend
#第四
x =np.arange(len(df4))
ax[0].plot(x,df['close'])
ax[0].set_title("close") #设置图名
ax[0].set_xlabel('trade_date')#设置x轴名称
ax[0].set_ylabel('close')
ax[0].legend
plt.show()
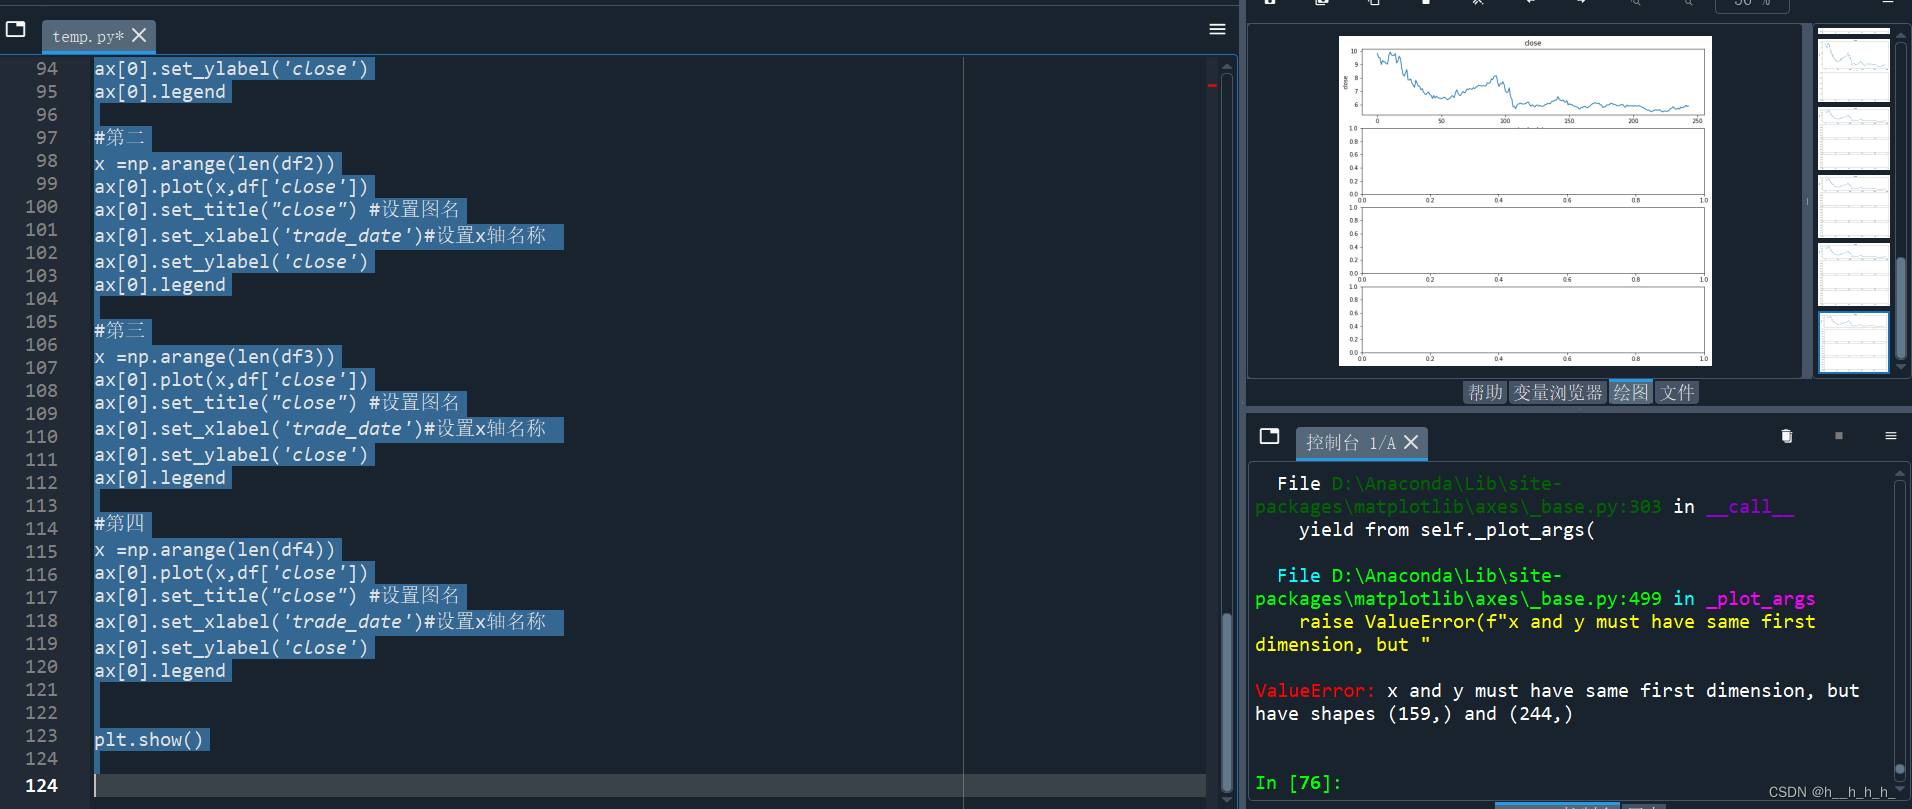
为什么我的绘图出来只有一个有图,其他三个为什么没有?


 939
939

 被折叠的 条评论
为什么被折叠?
被折叠的 条评论
为什么被折叠?
 到【灌水乐园】发言


