


实验步骤:
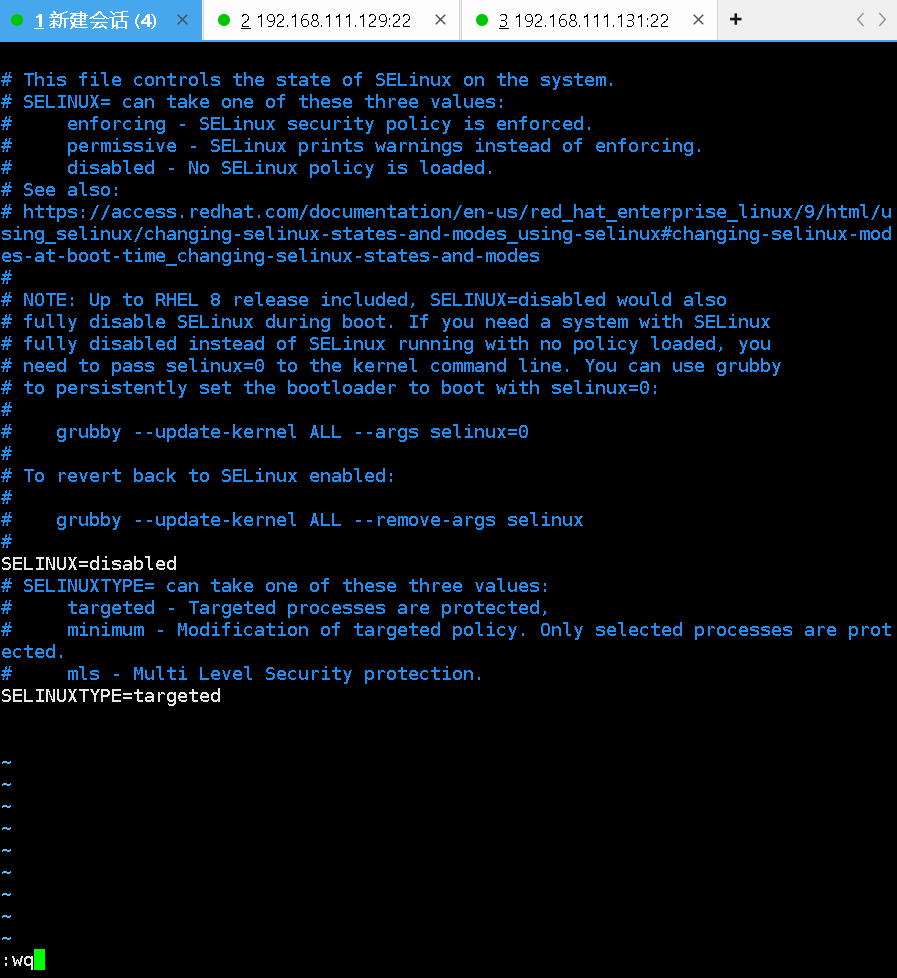
1、关闭三台虚拟机的防火墙,以及把selinux改为disabled
三台主机均进行如下命令行操作
vim /etc/selinux/config

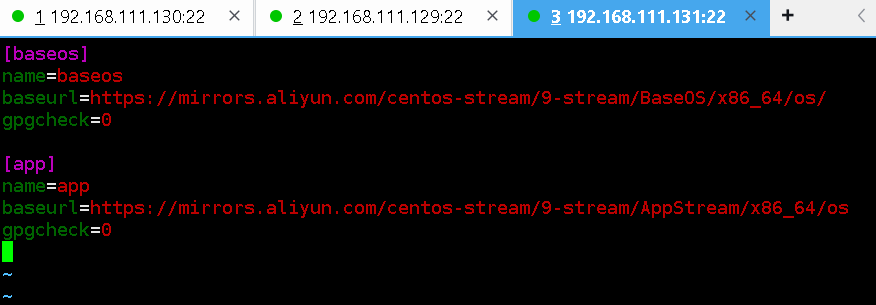
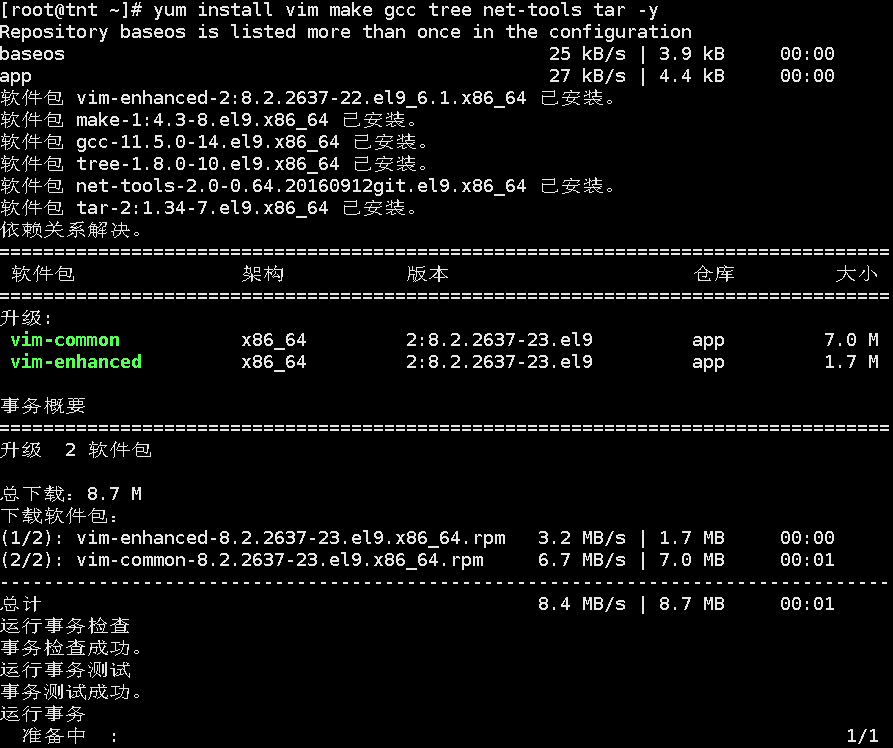
2、给三台虚拟机下载软件,在那之前需要先配置仓库,我使用的是阿里云的CentOS Stream 9镜像源

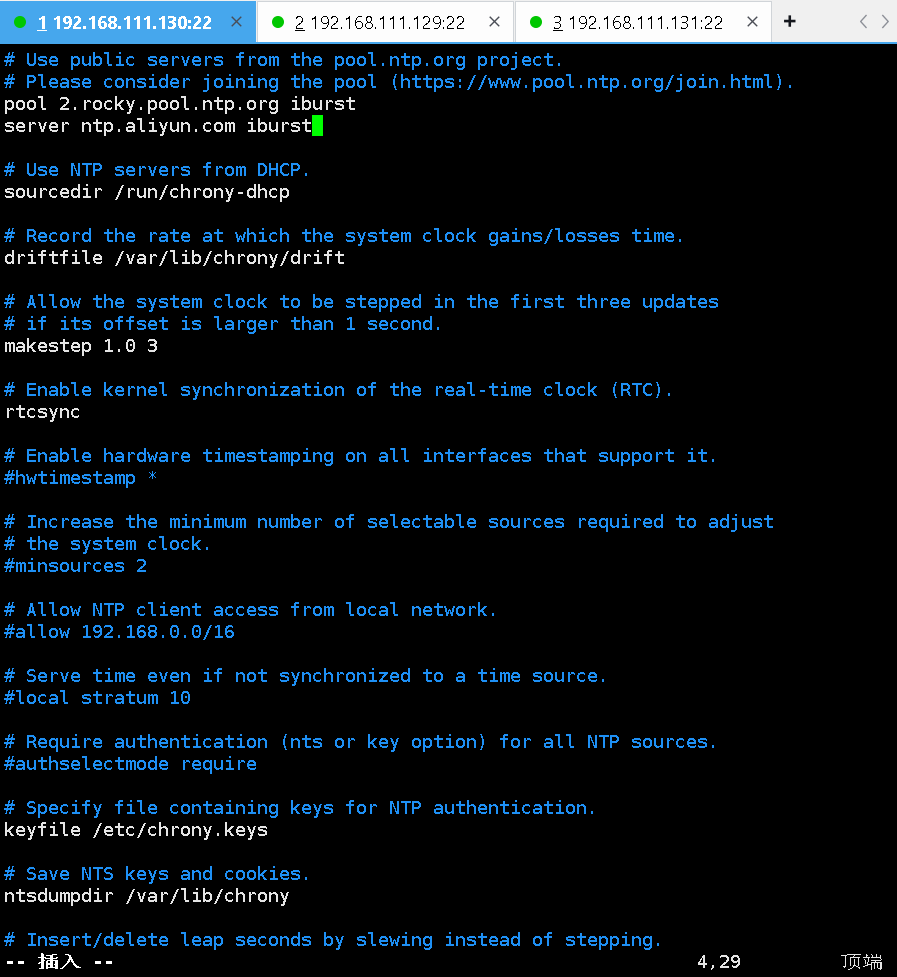
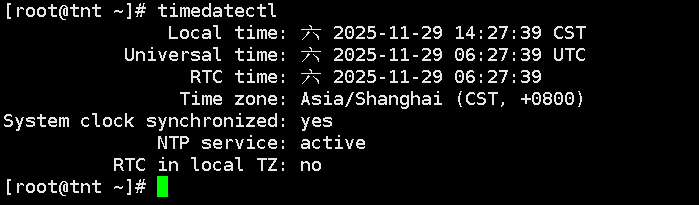
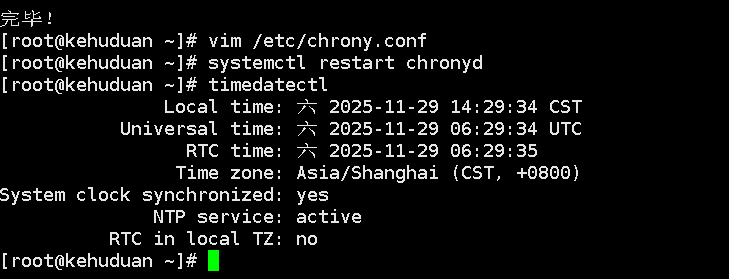
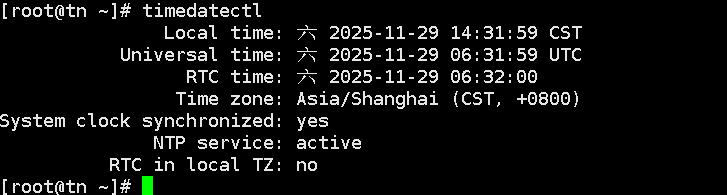
3、使三台虚拟机的时间同步
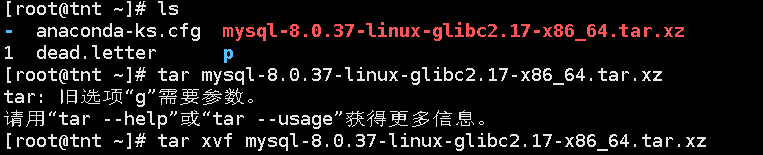
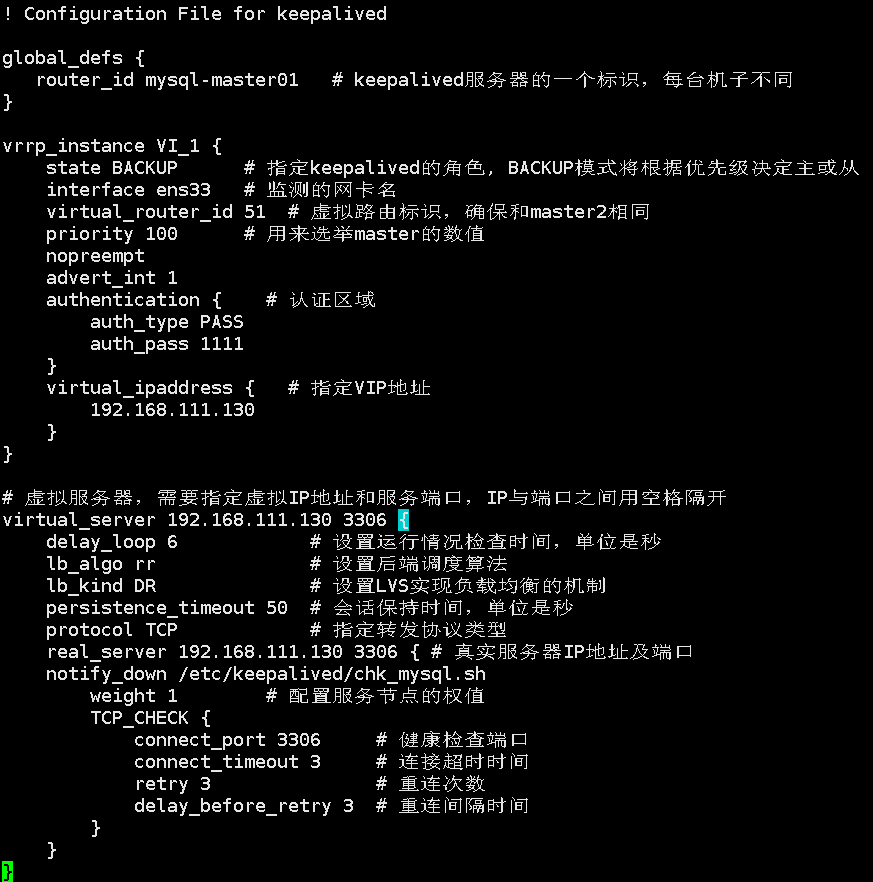
均进行如下配置:

![]()
第一台:
第二台:
第三台:
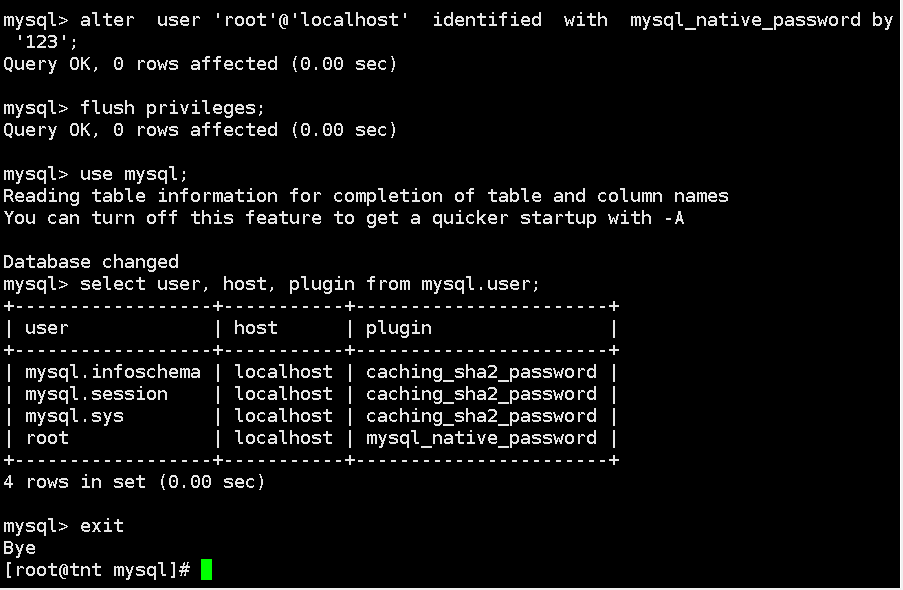
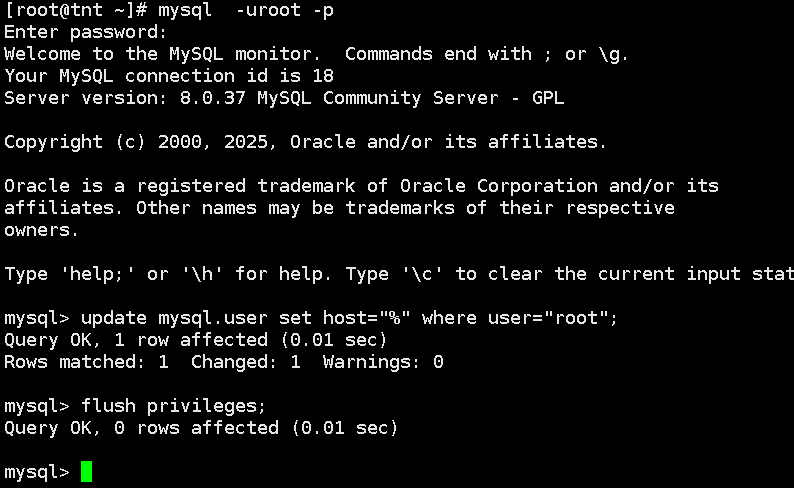
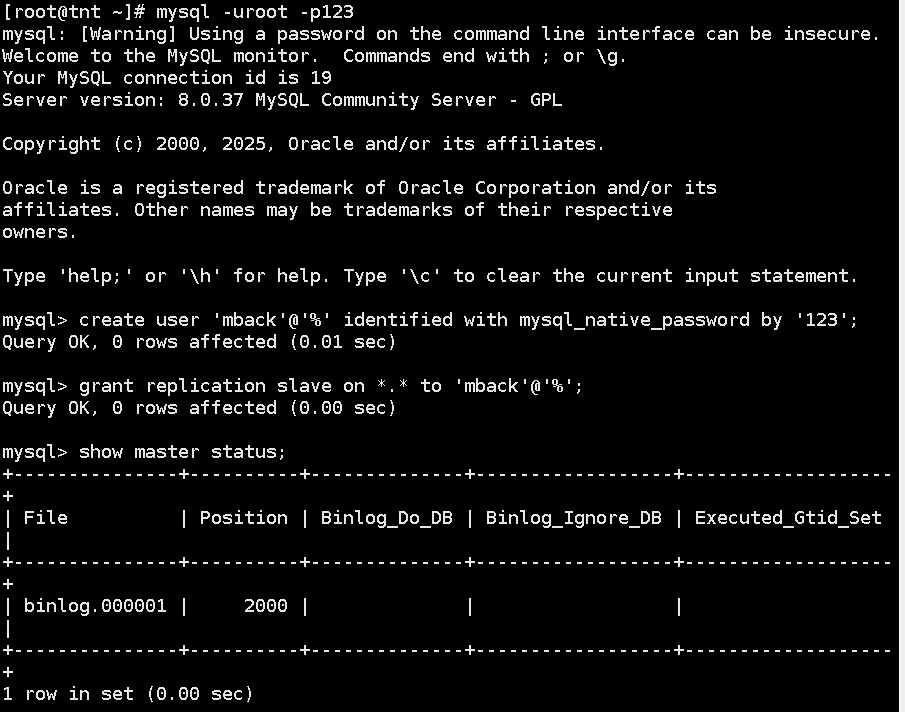
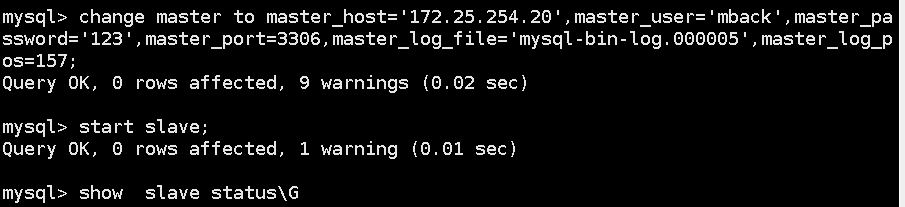
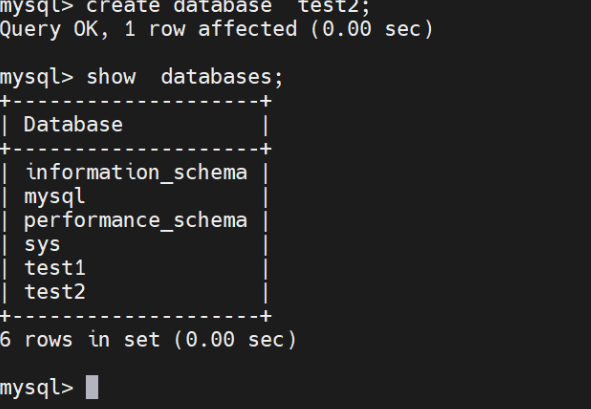
4、安装mysql并进行修改密码,两台虚拟机均进行如下操作:
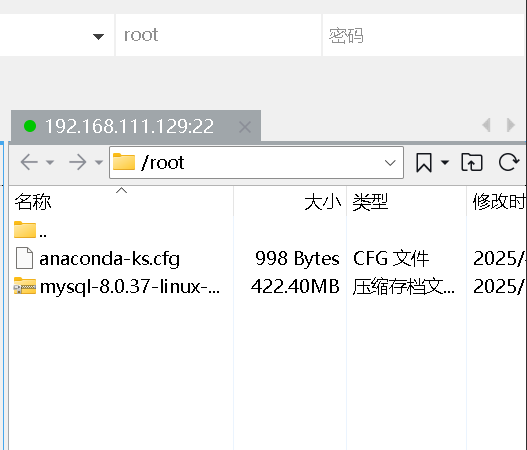
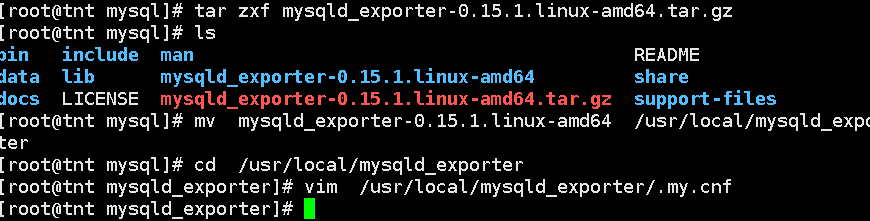
4.1使用xftp上传,解压缩,初始化
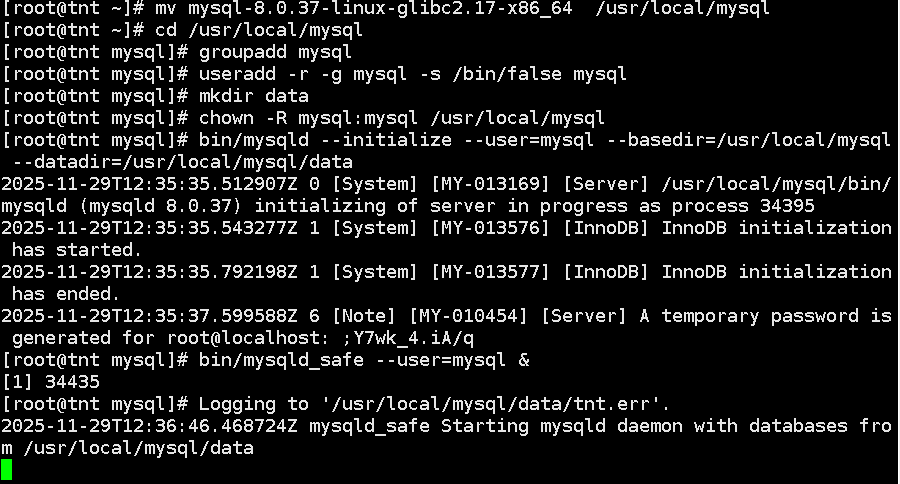
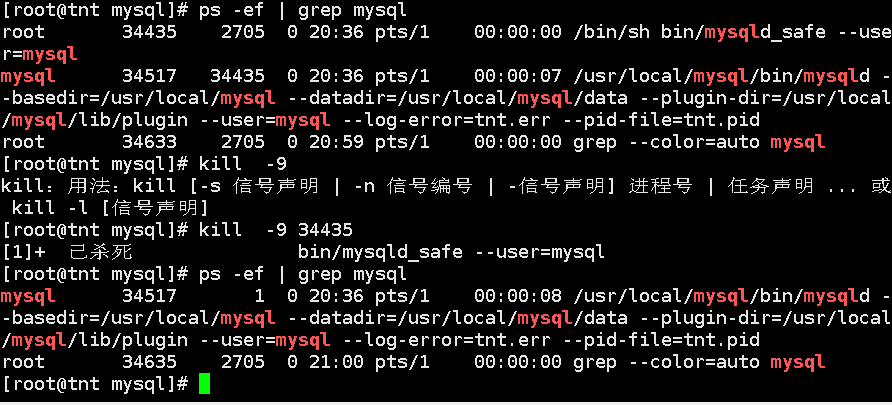
此时另行一终端:
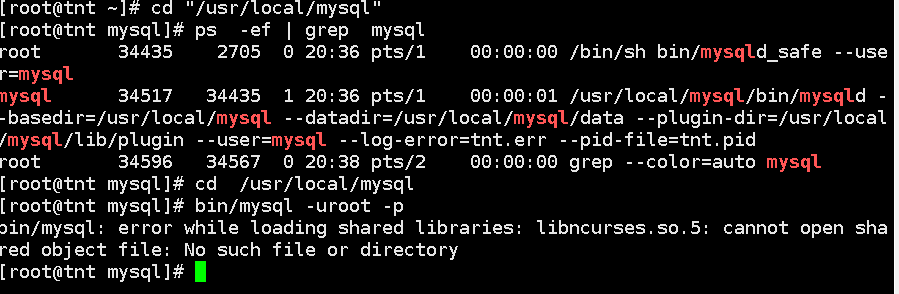
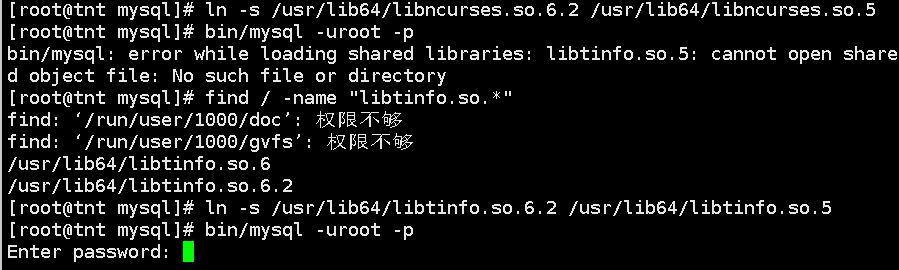
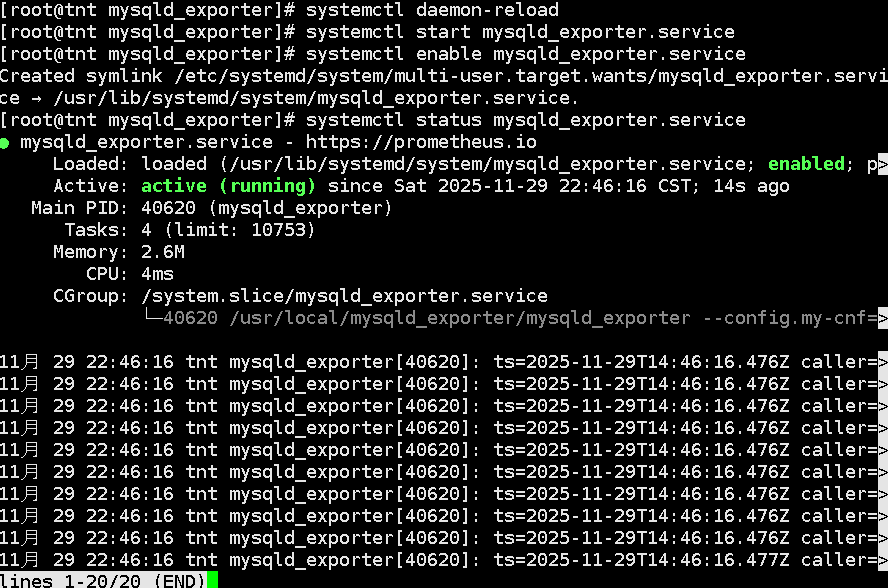
做到无报错即可:
![]()
[client]
port = 3306
socket = /tmp/mysql.sock[mysqld]
port = 3306
basedir = /usr/local/mysql
datadir = /usr/local/mysql/data
tmpdir = /tmp
socket = /tmp/mysql.sock
character-set-server = utf8mb4
collation-server = utf8mb4_general_ci
default-storage-engine=INNODB
log_error = error.log
![]()
export PATH=$PATH:/usr/local/mysql/bin
测试:

tar xvf prometheus-2.53.2.linux-amd64.tar.gz
mv prometheus-2.53.2.linux-amd64 /usr/local/prometheususeradd --no-create-home --shell /bin/false prometheus
chown -R prometheus:prometheus /usr/local/prometheusvim /usr/lib/systemd/system/prometheus.service
[Unit]
Description=Prometheus
Wants=network-online.target
After=network-online.target[Service]
User=prometheus
Group=prometheus
Type=simple
ExecStart=/usr/local/prometheus/prometheus --config.file /usr/local/prometheus/prometheus.yml --storage.tsdb.path /usr/local/prometheus/data[Install]
WantedBy=multi-user.target
systemctl daemon-reload
systemctl enable --now prometheus
systemctl status prometheus
vim /usr/local/prometheus/prometheus.yml
scrape_configs:
- job_name: "prometheus"
static_configs:
- targets: ["192.168.111.130:9090"]- job_name: "mysql"
static_configs:
- targets: ["192.168.111.130:9104"]
labels:
instance: mysqld_exporter
rpm -ivh xxx
yum install grafana-enterprise-11.1.2-1.x86_64.rpm -y
vim /etc/grafana/grafana.ini
################################# Server #################################
# Protocol (http, https, h2, socket)
protocol = http# This is the minimum TLS version allowed. By default, this value is empty. Accepted values are: TLS1.2, TLS1.3. If nothing is set TLS1.2 would be taken
;min_tls_version = ""# The ip address to bind to, empty will bind to all interfaces
;http_addr =# The http port to use
http_port = 3000# The public facing domain name used to access grafana from a browser
domain = localhost# Redirect to correct domain if host header does not match domain
# Prevents DNS rebinding attacks
;enforce_domain = false# The full public facing url you use in browser, used for redirects and emails
# If you use reverse proxy and sub path specify full url (with sub path)
root_url = %(protocol)s://%(domain)s:%(http_port)s/
systemctl enable --now grafana-server
systemctl status grafana-server
# 浏览器其中输入:http:192.168.111.130:3000# 初始账户/密码:admin/admin
# 设置新的密码:123# 在设置界面中选择Home > Connections > Data sources > prometheus
# 设置prometheus监听地址:http://192.168.111.130:9090
# 往下翻 save&test
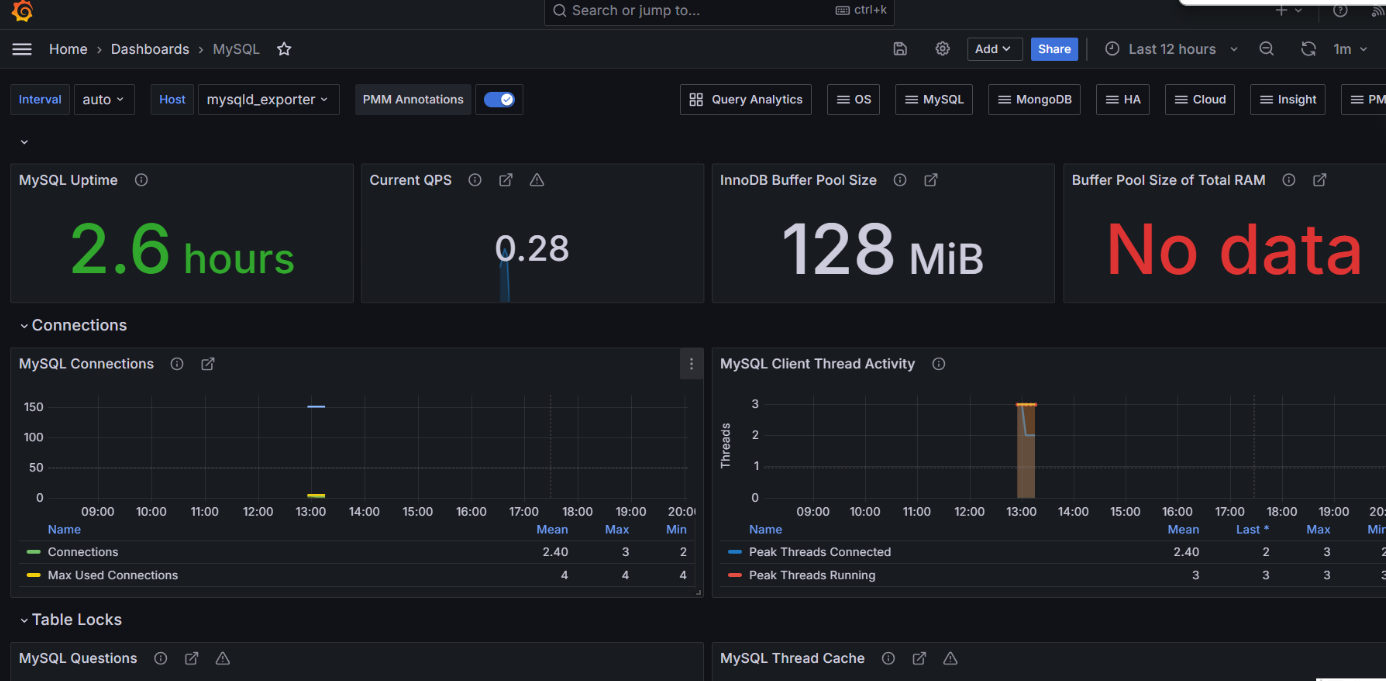
# buliding a dashboard --> 选择Import a dashboard
# 选择监控模版来显示mysql的关键指标,模版ID为7362 --> Load --> Import


 1478
1478

 被折叠的 条评论
为什么被折叠?
被折叠的 条评论
为什么被折叠?
 到【灌水乐园】发言


