 Python实现字符田字格绘制


import matplotlib.pyplot as plt


def draw_minimal_image(rows, cols):
    # 检查输入参数是否为正整数
    if not isinstance(rows, int) or not isinstance(cols, int) or rows <= 0 or cols <= 0:
        raise ValueError("rows and cols must be positive integers")

    # 创建图形和坐标轴对象
    fig, ax = plt.subplots(figsize=(cols, rows))

    # 关闭所有默认边框
    ax.set_frame_on(False)

    # 绘制中心的虚线十字线
    ax.plot([cols / 2, cols / 2], [0, rows], 'k--', lw=1, label='Vertical center line')
    ax.plot([0, cols], [rows / 2, rows / 2], 'k--', lw=1, label='Horizontal center line')

    # 绘制外框
    ax.plot([0, cols], [0, 0], 'k-', lw=1, label='Bottom border')
    ax.plot([0, cols], [rows, rows], 'k-', lw=1, label='Top border')
    ax.plot([0, 0], [0, rows], 'k-', lw=1, label='Left border')
    ax.plot([cols, cols], [0, rows], 'k-', lw=1, label='Right border')

    # 移除刻度和标签
    ax.set_xticks([])
    ax.set_yticks([])

    # 设置图的比例为相同的尺度
    plt.gca().set_aspect('equal', adjustable='box')

    # 移除所有空白边距
    plt.subplots_adjust(left=0, right=1, top=1, bottom=0)

    # 显示图例,将其位置设置为右下角
    ax.legend(loc='lower right')

    # 显示图形
    plt.show()


# 调用函数,设置5行5列
draw_minimal_image(5, 5)
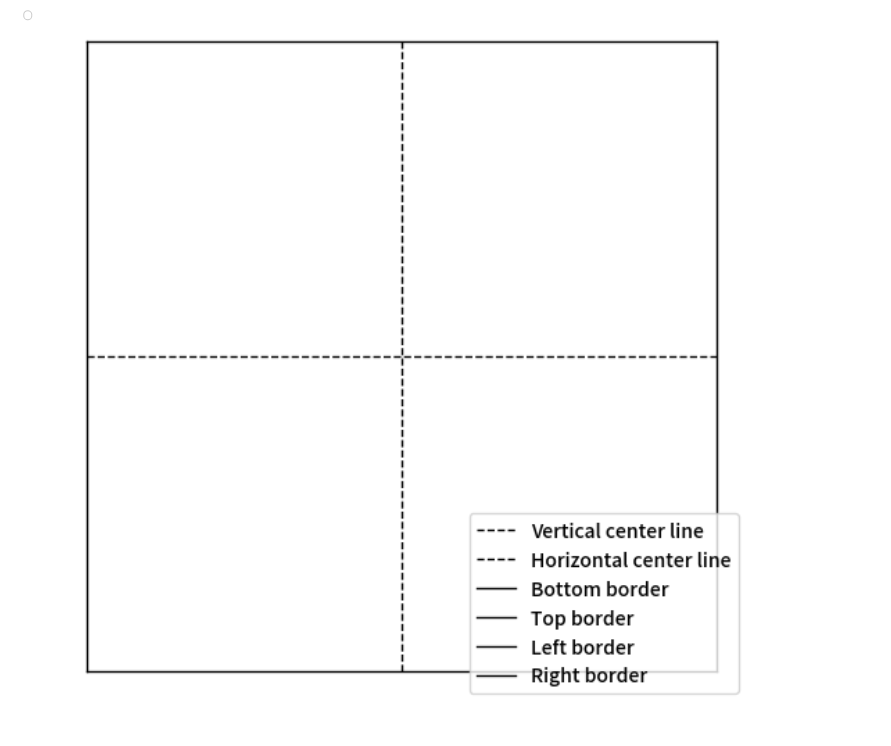
运行结果:


 1137
1137

 被折叠的 条评论
为什么被折叠?
被折叠的 条评论
为什么被折叠?
 到【灌水乐园】发言


