


 使用隐马尔科夫模型分析基金净值数据,预测基金走势。模型通过基金历史净值变化率训练,生成未来净值趋势,适用于如沪深300指数基金等时间序列数据预测。
隐马尔可夫模型是生成模型,可用于分析股票、基金这样的时间序列数据。
用隐马尔科夫模型来预测基金数据。基金净值数据是典型的时间序列数据示例,其数据都是用日期格式来组织的。
cd \Anaconda3\Scripts
pip install hmmlearn
hmm_fund.py
# coding: utf-8
import os, sys
import datetime
import numpy as np
import matplotlib.pyplot as plt
import pandas as pd
from hmmlearn.hmm import GaussianHMM

if len(sys.argv) ==2:
    code = sys.argv[1]
else:
    print('usage: python hmm_fund.py fundcode ')
    sys.exit(1)

if len(code) !=6:
    print('fund code length: 6')
    sys.exit(2)

f1 = code+'.csv'
if not os.path.exists(f1):
    print(f1 +' is not exists. ')
    sys.exit(3)

df = pd.read_csv(f1, index_col='date')
if len(df) <100:
    print(" len(df) <100 ")
    sys.exit(2)

# 基金净值
net_values = np.array(df['jz'].values)
# Take diff of net values and computing rate of change
diff_percentage = 100.0 * np.diff(net_values) / net_values[:-1]

# Stack the percentage diff and net values column-wise for training
X = np.column_stack([net_values[1:], diff_percentage])

print(X[-5:])
print('percent_sum:',X[:,1].sum())

# Create and train Gaussian HMM
print(" Training HMM....")
model = GaussianHMM(n_components=5, covariance_type="diag", n_iter=1000)
model.fit(X)

# Generate data using model
num_samples = 500
samples, _ = model.sample(num_samples)
plt.plot(np.arange(num_samples), samples[:,0], c='black')
plt.title(code)
plt.grid()
plt.show()
基金净值数据格式:
date,jz,ljjz
2016-01-04,1.1141,1.1141
2016-01-05,1.1161,1.1161
2016-01-06,1.1350,1.1350
运行 python hmm_fund.py 660008
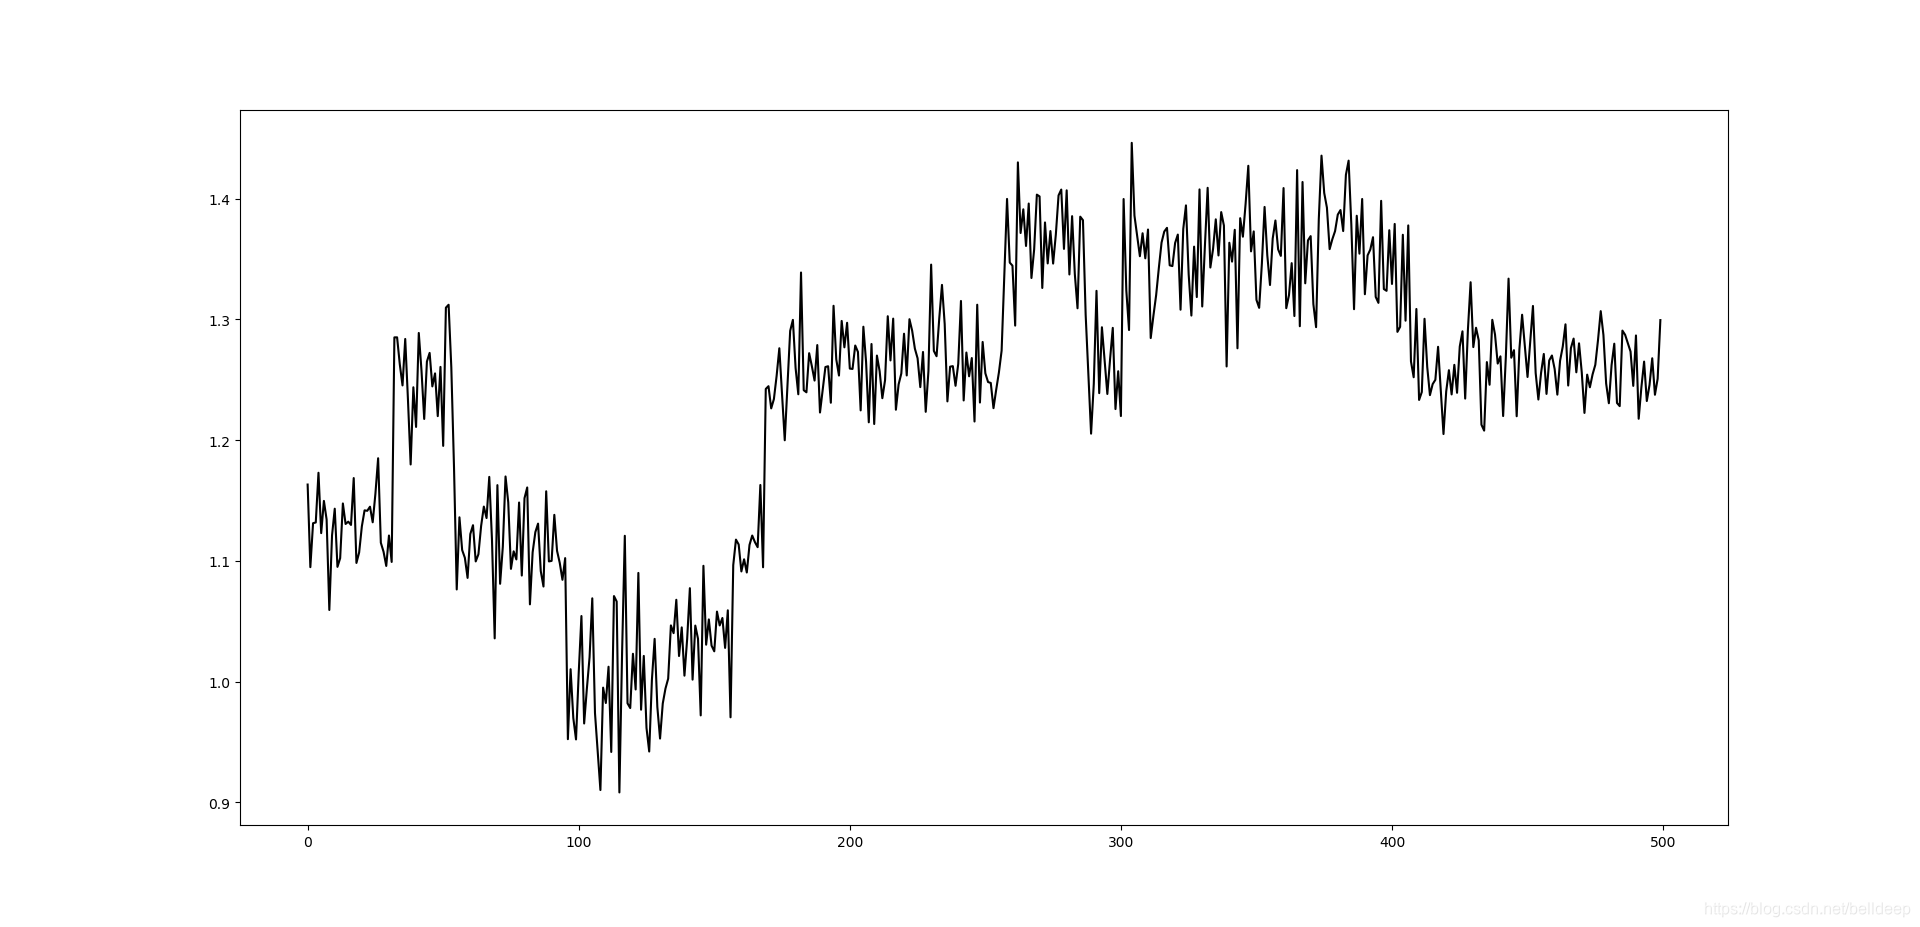
预测 forecast :660008 沪深300指数基金,2020年上半年基金净值在1.44~1.28元之间震荡,年中会有10%下跌,在下半年基金净值在1.33~1.21元之间波动。
参考书:[ Python机器学习经典实例 ] 第8章 解剖时间序列和时序数据
用隐马尔科夫模型分析股票市场数据 hmm_stock.py
年中会有10%下跌,
2020.7.10日预测:上证指数 3450 x 0.9 = 3105 点,沪深300指数基金 1.6768 x 0.9 = 1.5091
以上仅供学习编程参考,不可作为你的股市操作依据。


 1763
1763

 被折叠的 条评论
为什么被折叠?
被折叠的 条评论
为什么被折叠?
 到【灌水乐园】发言


