


 该博客介绍了如何通过已知的呼吸频率来构造呼吸波形,使用Python的numpy和pylab库生成假的呼吸信号。代码展示了如何根据输入参数调整波形的起始斜率、频率、时间和幅度,从而得到逼真的呼吸监测波形。
呼吸检测画出来的波形不好看,用呼吸率“造假”呼吸波形的方法
'''
author : xyang
data : 2021_10_15
function : given that frequency sequency of breath is known, refactor the waves
'''
import numpy as np
import pylab

pi = np.pi


def refactor(k, f, t_start, wave_start, tlen, len=100, ylim=1):
    '''
    :param k: bool型变量,表示开始时波形的斜率,True表示斜率为正,False表示斜率为负
    :param f: frequency sequence, unit of measurement Hz
    :param t_start: start time
    :param wave_start: limited to range ylim, ylim=1 equals default range [-1,1]
    :param tlen: the time of wave sustain,(3s. etc)
    :param ylim: 表示波形的y值范围【-ylim,ylim】
    :param len: 表示在tlen时间内的采样点数
    :return: waves, the axis of time has a length of len
    '''
    t = np.linspace(start=t_start, stop=t_start + tlen, num=int(len), endpoint=False)  # 得到时间轴
    phase = np.arcsin(wave_start) if k else pi - np.arcsin(wave_start)  # 得到初始相位
    waveform = np.sin(2 * pi * f * np.linspace(0, tlen * f, len, False) + phase) * ylim  # 利用周期和呼吸率得到波形
    # 留下波形拼接的接口
    t_start = t_start + tlen
    wave_start = np.sin(2 * pi * f * tlen * f + phase) * ylim
    k = True if waveform[-1] - waveform[-2] > 0 else False
    return waveform, t, t_start, wave_start, k


if __name__ == '__main__':
    rpm = np.array([21, 26, 32, 21, 26, 32])  # beat per min
    fre = rpm / 60
    k = False
    t_start = 20
    wave_start = 0
    tlen = 10

    ts = np.array([])
    ws = np.array([])
    for f in fre:
        waveform, t, t_start, wave_start, k = refactor(k, f, t_start, wave_start, tlen, 300)
        ts = np.append(ts, t)
        ws = np.append(ws, waveform)
    pylab.plot(ts, ws)
    pylab.grid()
    pylab.show()
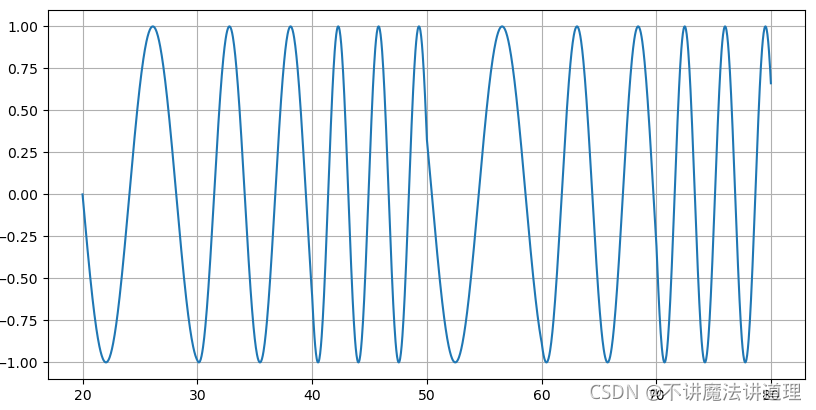
结果:k = False时
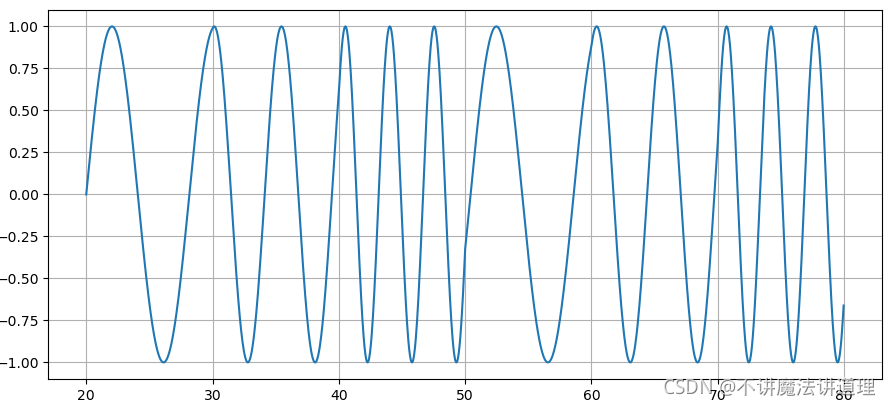
k = True时,


 2404
2404

 被折叠的 条评论
为什么被折叠?
被折叠的 条评论
为什么被折叠?
 到【灌水乐园】发言


