1. 准备工作
if (!requireNamespace("BiocManager", quietly = TRUE))
install.packages("BiocManager")
.libPaths("E:\\R\\test\\packaged")
rm(list = ls())
library(BiocManager)
BiocManager::install('GO.db')
library(GO.db)
BiocManager::install('GenomeInfoDbData')
library(GenomeInfoDbData)
BiocManager::install('HDO.db')
library(HDO.db)
BiocManager::install("clusterProfiler")
library(clusterProfiler)
BiocManager::install("AnnotationHub")
library(AnnotationHub)
BiocManager::install("org.Hs.eg.db")
library(org.Hs.eg.db)
library(ggplot2)
BiocManager::install("DOSE")
library(DOSE)
2. ID转换
go_ythdf2 <- read.table("gene.txt",sep=" ")
go_ythdf2 <- t(go_ythdf2)
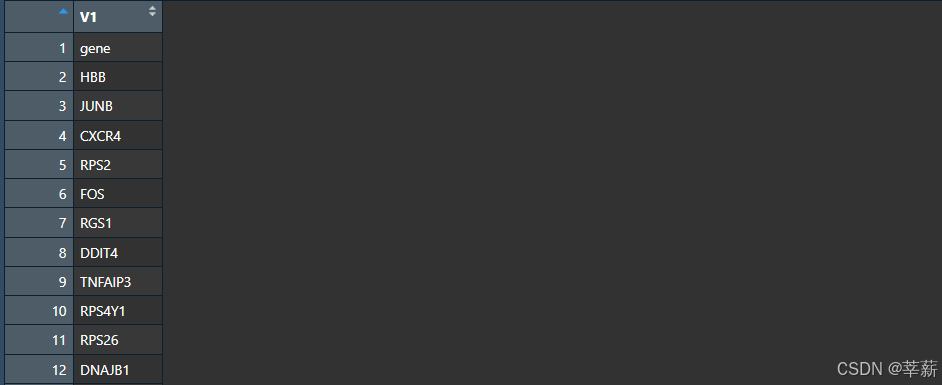
3. 将gene_symbol转化成ENSEMBL
keytypes(org.Hs.eg.db)
keys(org.Hs.eg.db, keytype = "SYMBOL")
go_ythdf2_id_trance <- bitr(go_ythdf2,fromType = "SYMBOL",toType = "ENSEMBL",OrgDb = "org.Hs.eg.db",drop = T)
f <- as.data.frame(go_ythdf2_id_trance[,2])
colnames(f)[1] <- ''
colnames(f) <- "V1"
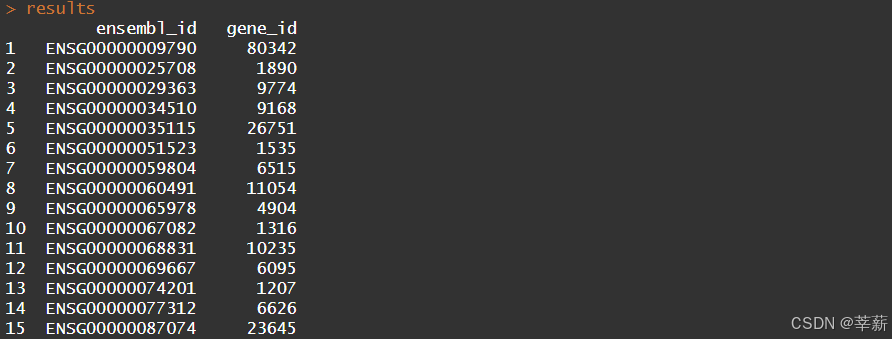
EG2Ensembl=toTable(org.Hs.egENSEMBL)
f=f$V1
geneLists=data.frame(ensembl_id=f)
results=merge(geneLists,EG2Ensembl,by='ensembl_id',all.x=T)
id=na.omit(results$gene_id)
4. 富集
4.1 GO富集
ALL<- enrichGO(OrgDb="org.Hs.eg.db", gene = id, ont = "ALL", readable= TRUE)
BP<- enrichGO(OrgDb="org.Hs.eg.db", gene = id, ont = "BP", readable= TRUE)
CC<- enrichGO(OrgDb="org.Hs.eg.db", gene = id, ont = "CC", readable= TRUE)
MF<- enrichGO(OrgDb="org.Hs.eg.db", gene = id, ont = "MF", readable= TRUE)
write.csv(ALL@result ,file="GO A11 .csv")
write.csv(BP@result ,file="GO BP .csv")
write.csv(CC@result ,file="GO CC .csv")
write.csv(MF@result ,file="GO MF .csv")
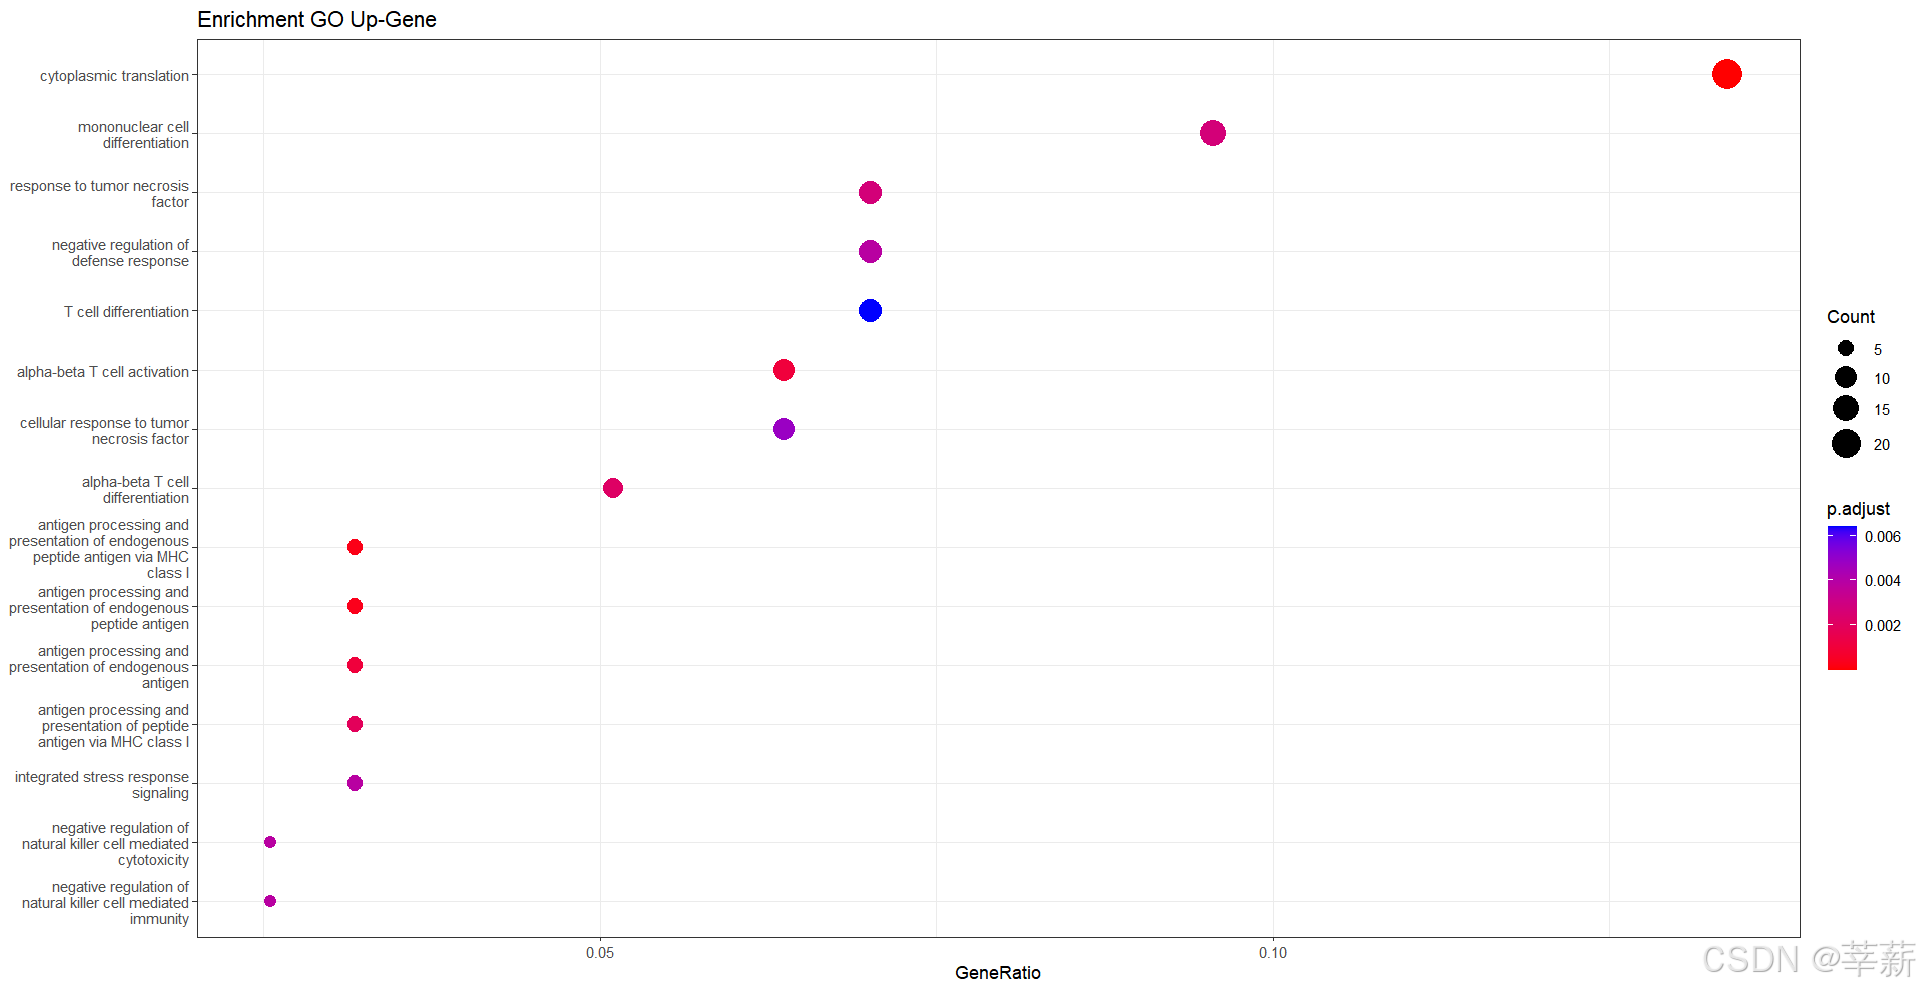
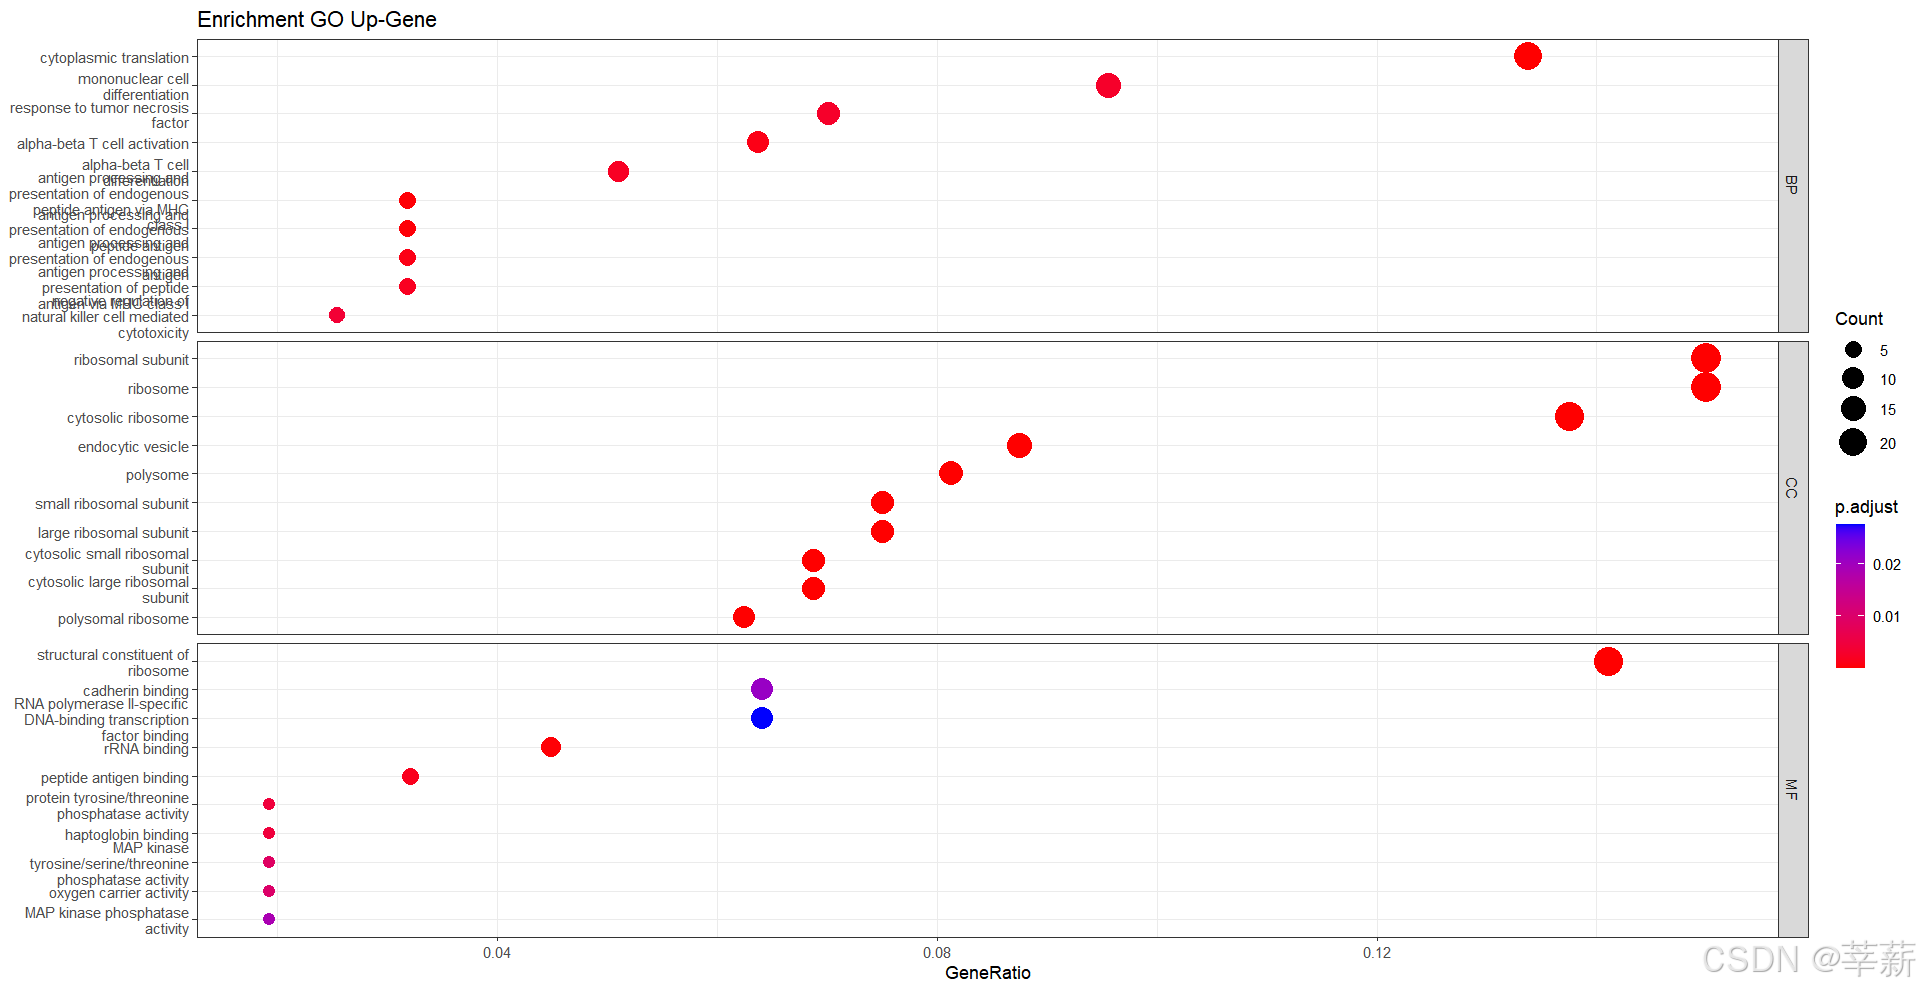
4.1.1 气泡图
dotplot(BP,showCategory=15,title="Enrichment GO Up-Gene")+
scale_color_gradient(low = "red", high = "blue")+
theme_bw()
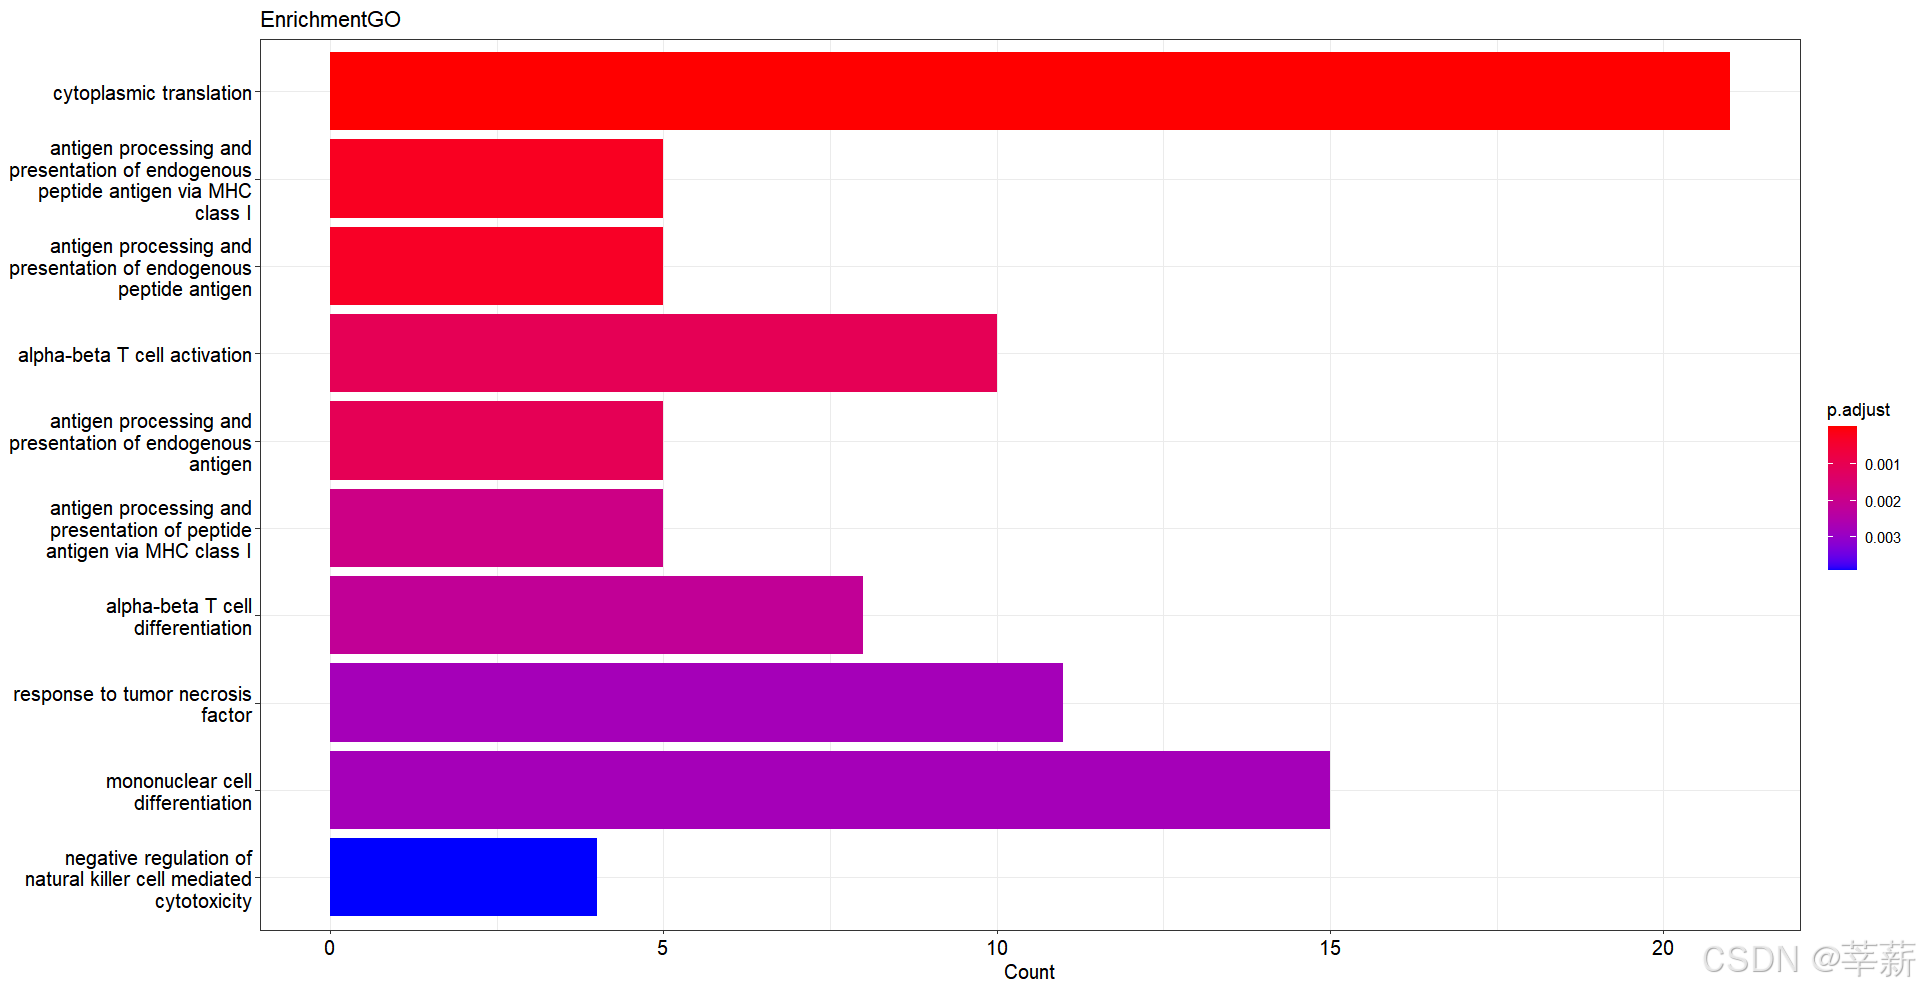
4.1.2 柱状图
barplot(ALL, showCategory=10,title="EnrichmentGO")
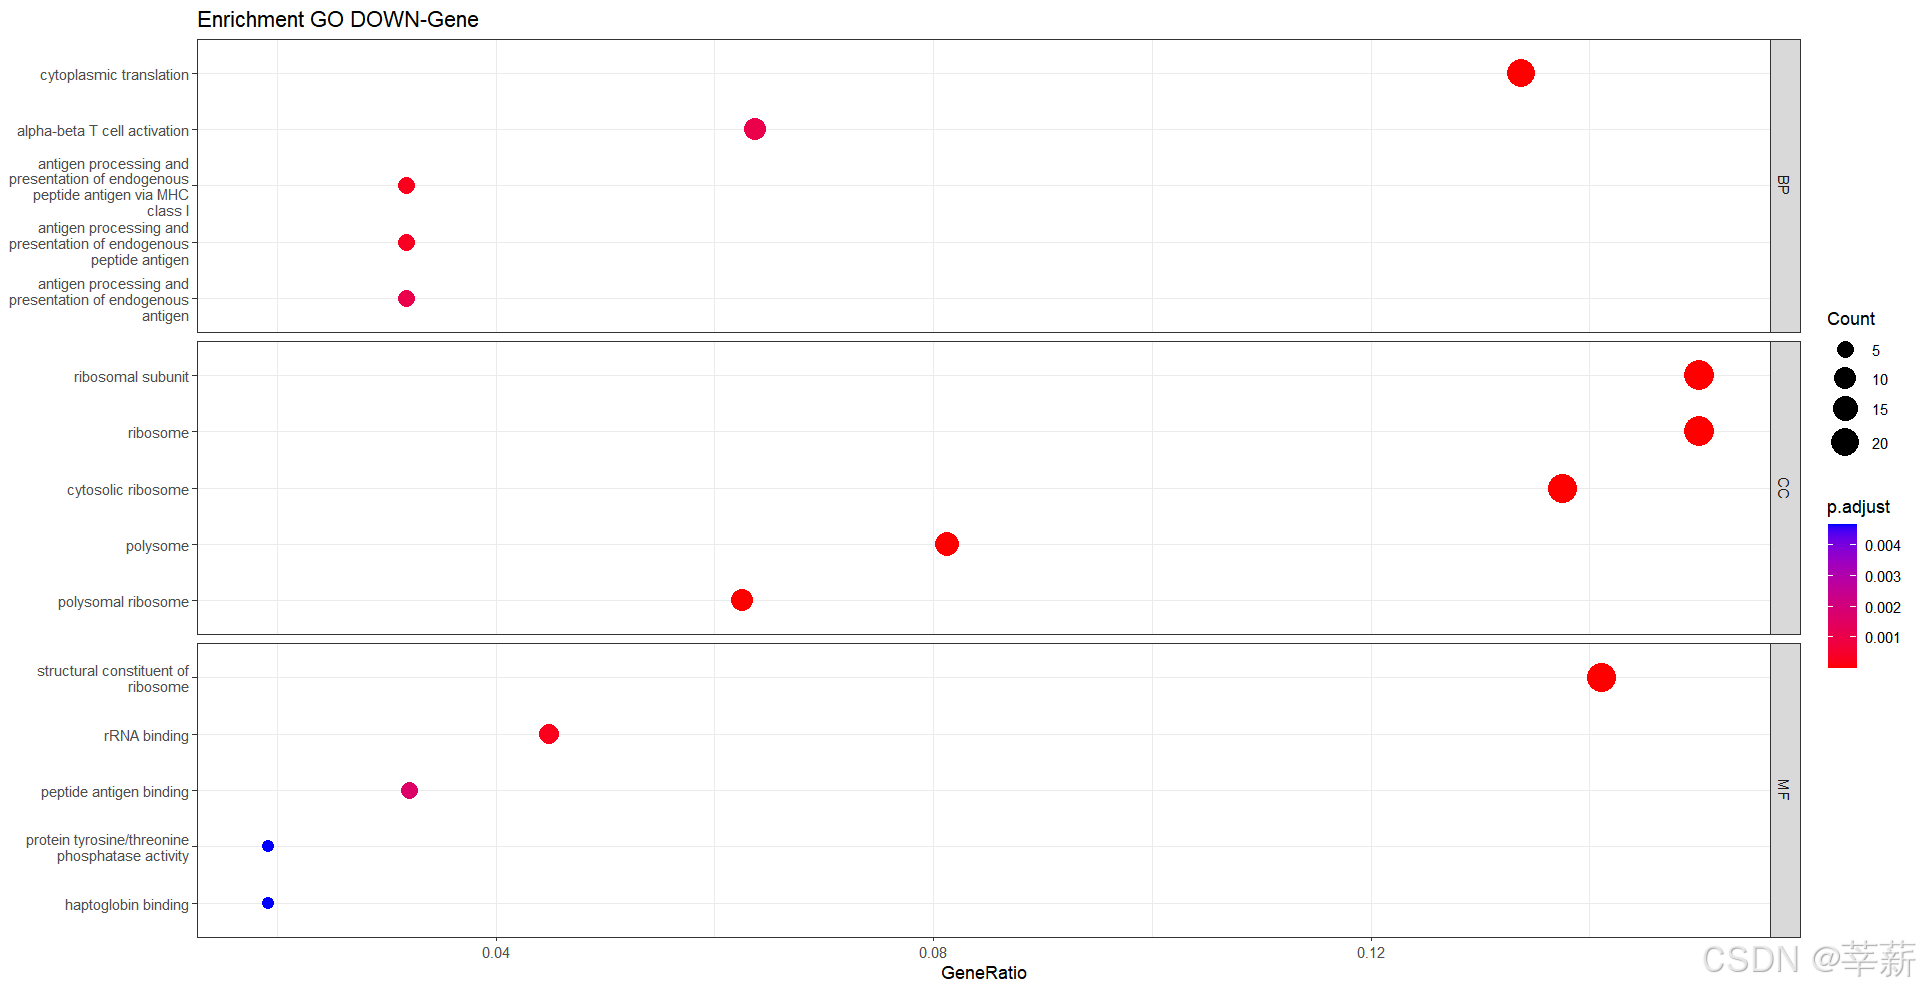
4.1.3 BP,MF,CC分别显示(要加载DOSE包)
4.1.4 按ONTOLOGY分离
dotplot(ALL,split="ONTOLOGY",
showCategory=5,
title="Enrichment GO DOWN-Gene")+
facet_grid(ONTOLOGY~.,scale="free")+
theme_bw()
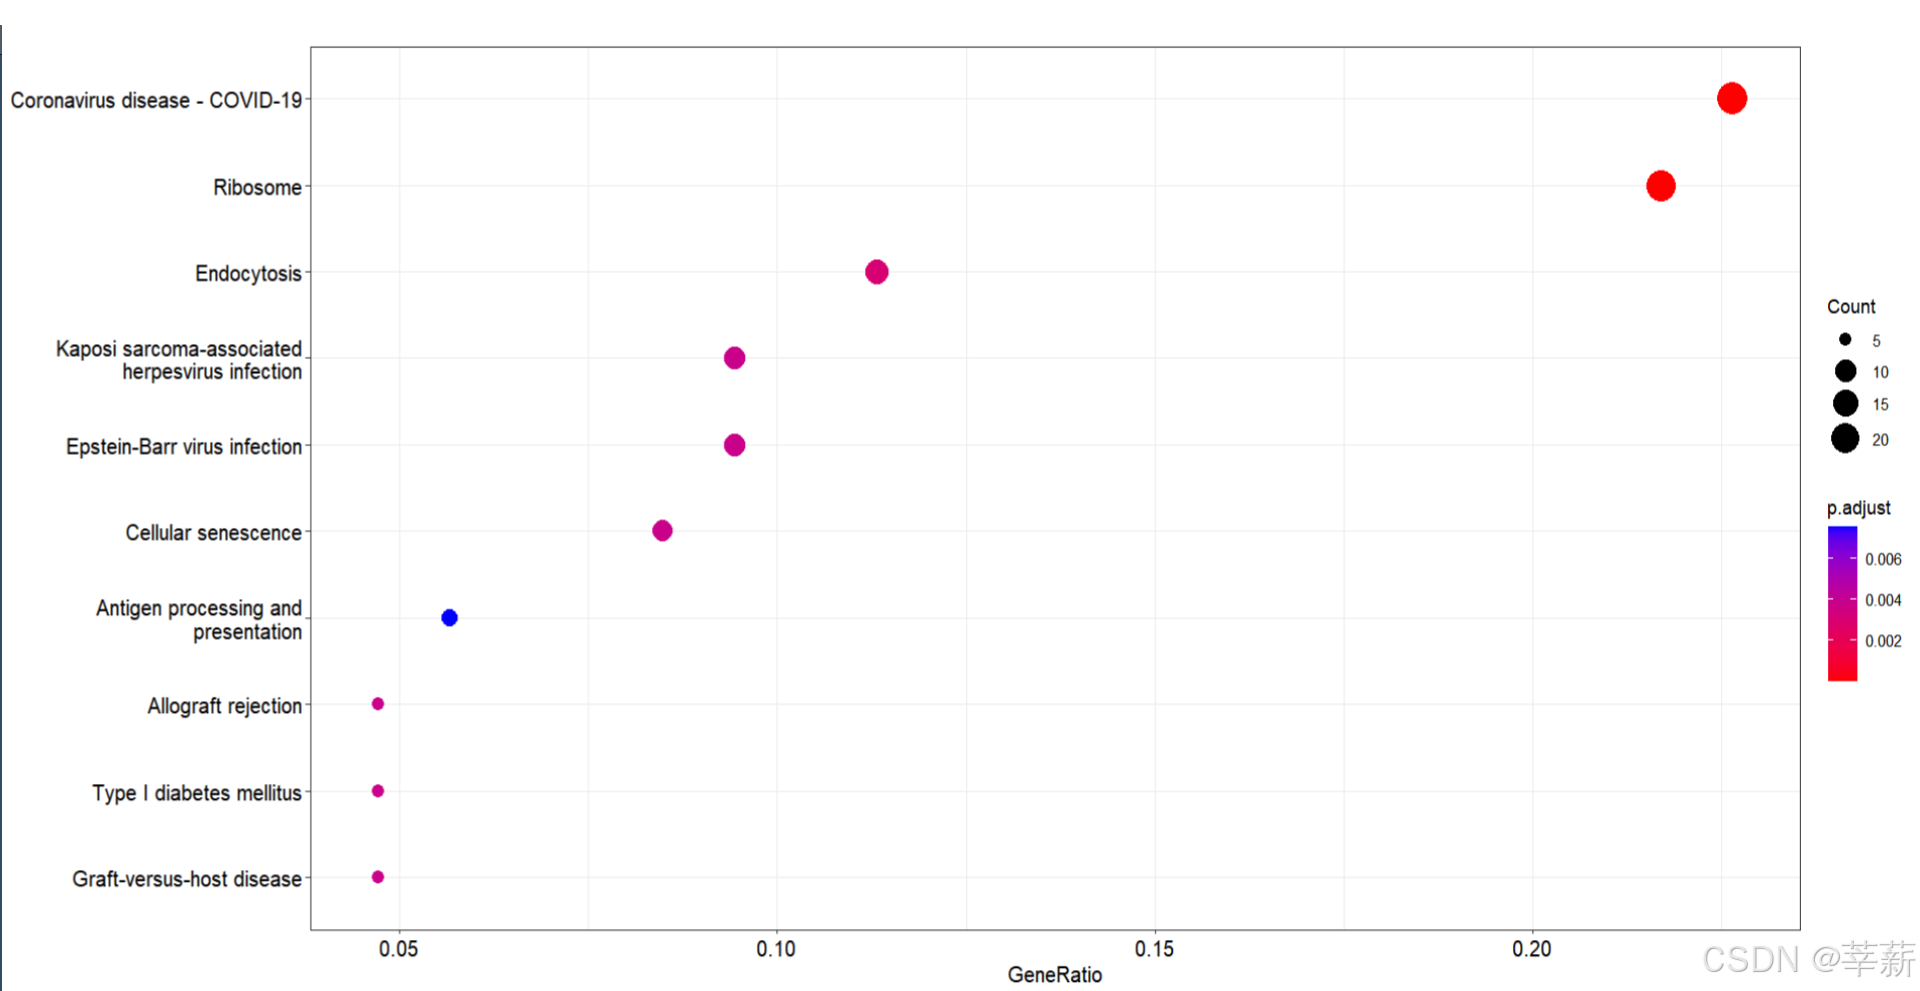
4.2 KEGG分析
KEGG <- enrichKEGG(gene= id,
organism = 'hsa',
pvalueCutoff = 0.05)
4.2.1 气泡图
dotplot(KEGG,font.size=12)
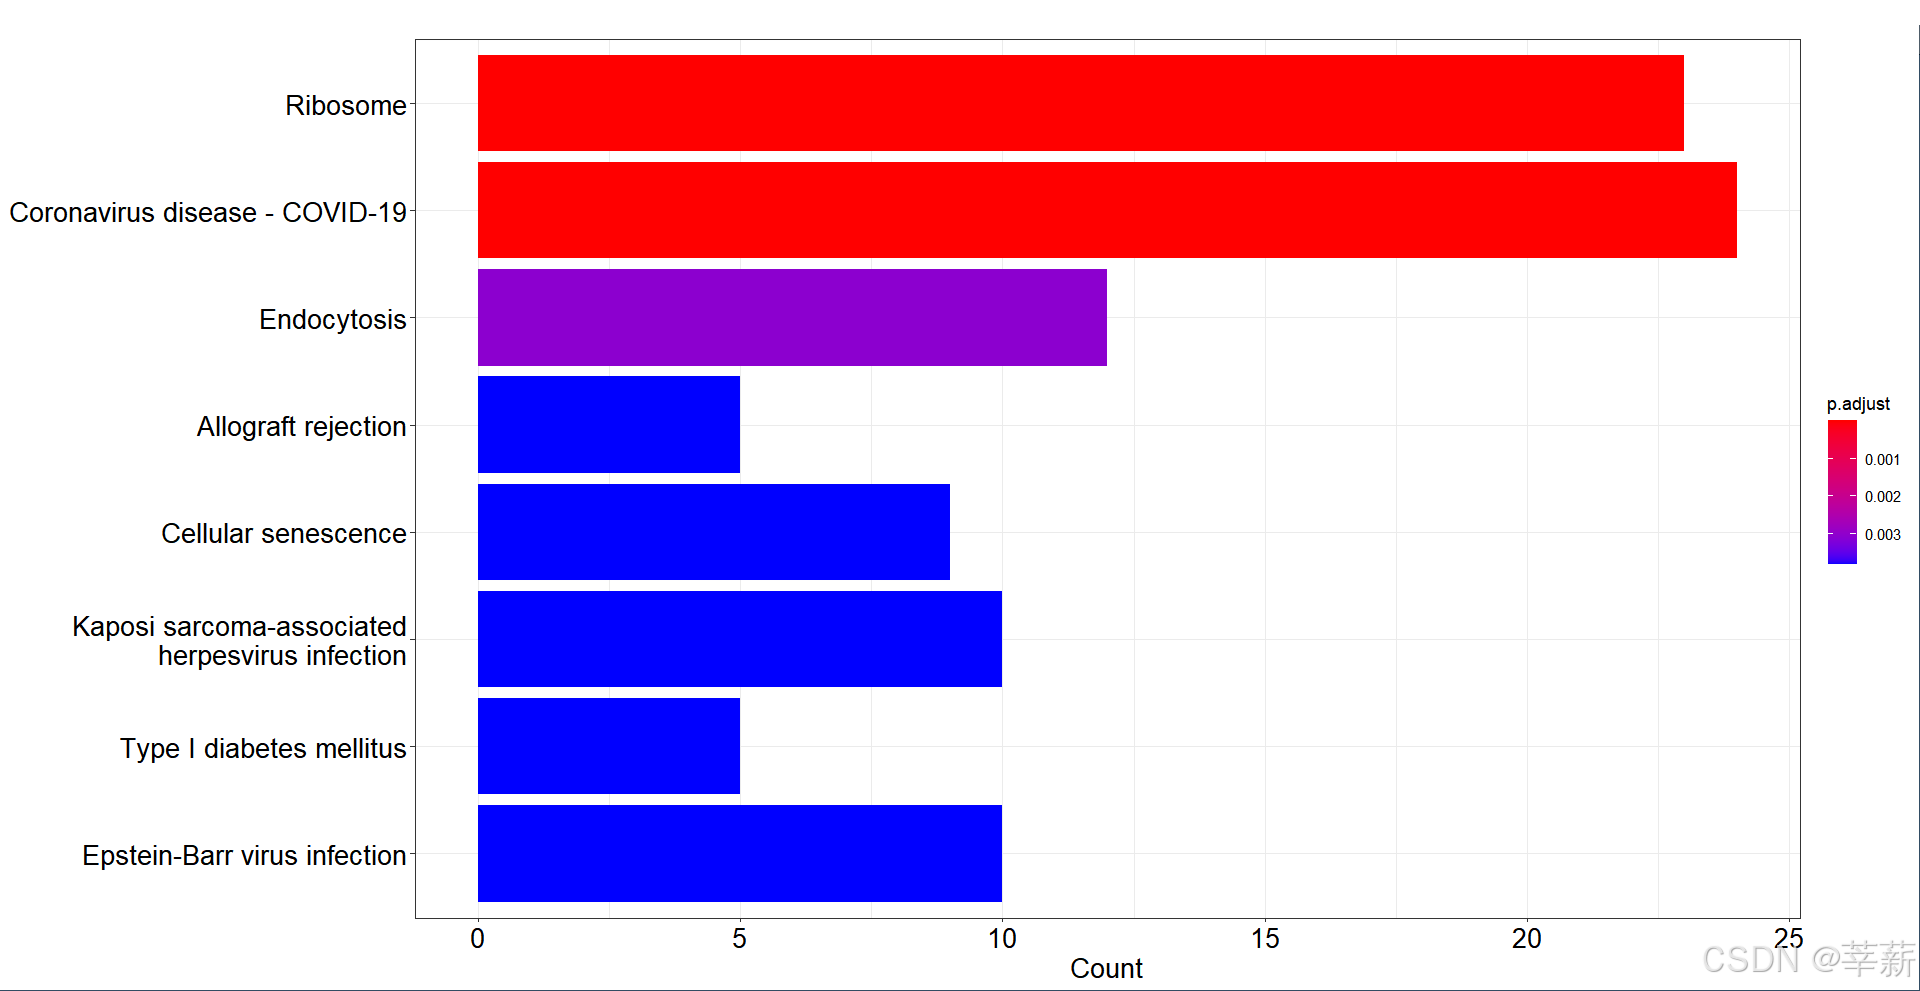
4.2.2 柱状图
barplot(KEGG,font.size=16)
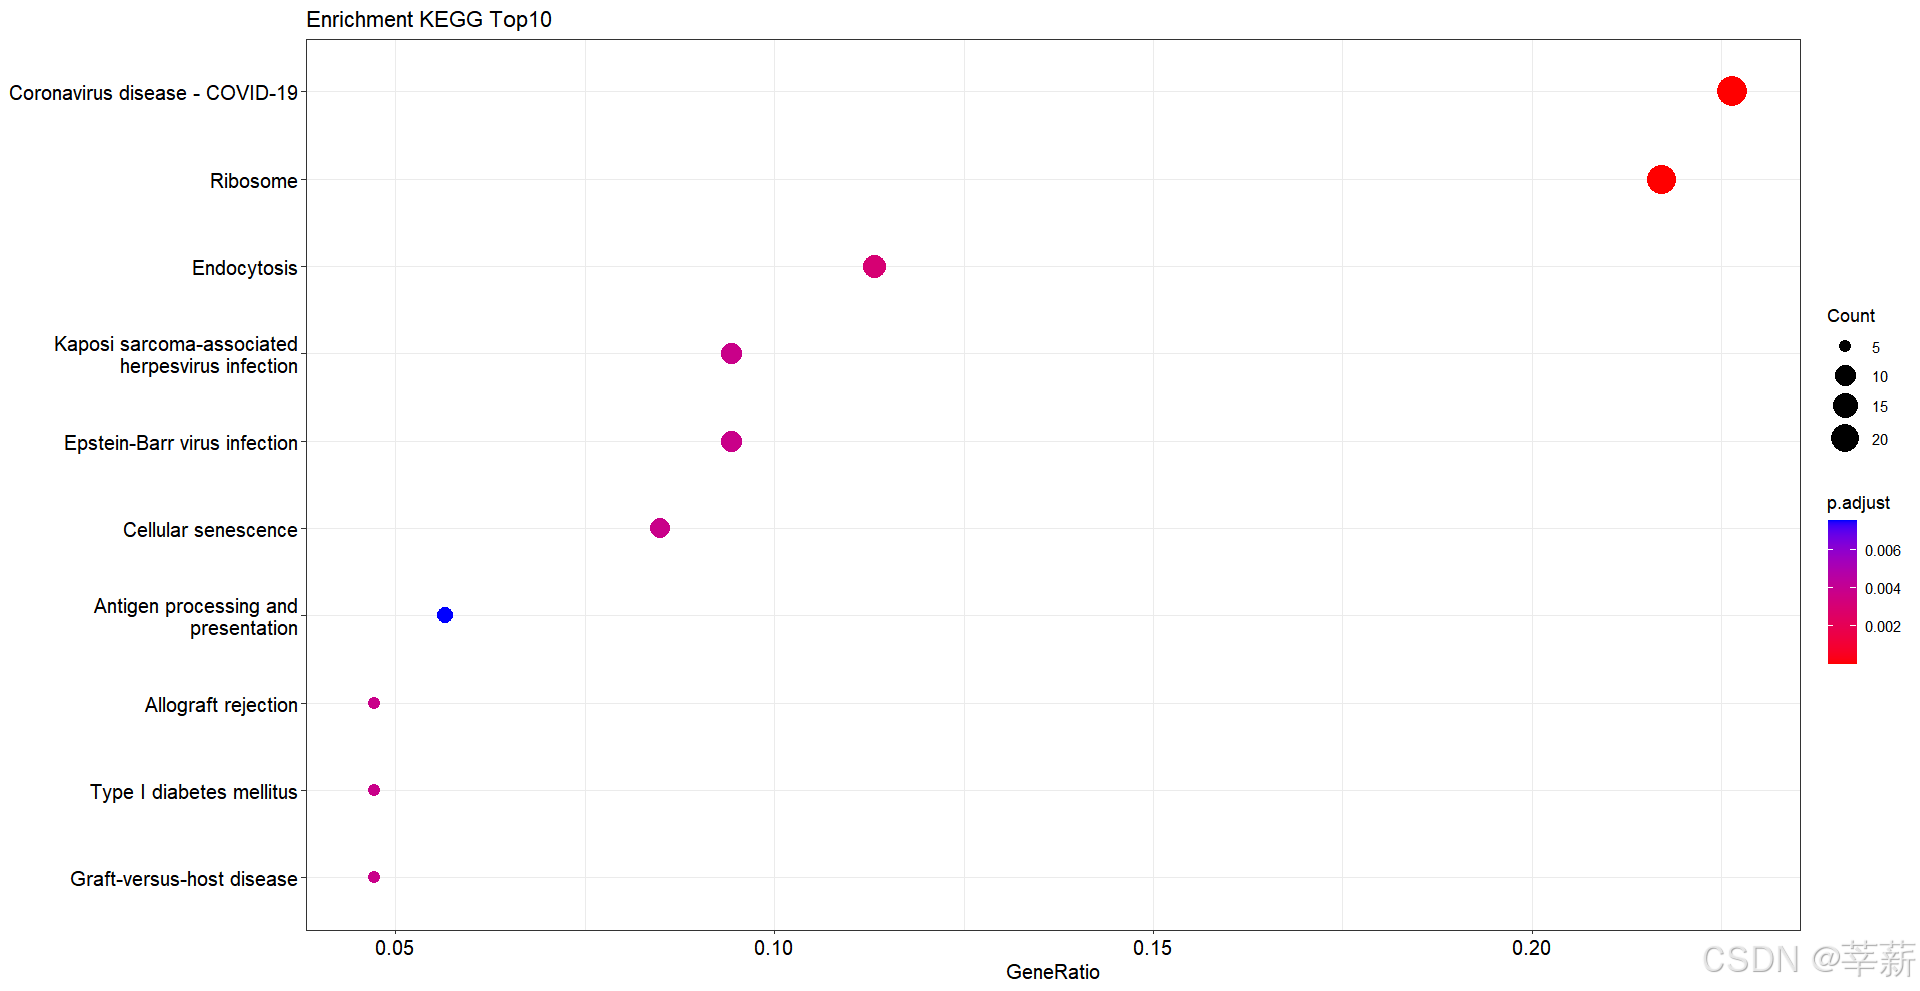
4.2.3 泡泡图
dotplot(KEGG,showCategory=10,title="Enrichment KEGG Top10")
dotplot(KEGG, font.size=8, showCategory=10, title="Enrichment KEGG Top10") + scale_size(rang=c(5.20))


 1358
1358

 被折叠的 条评论
为什么被折叠?
被折叠的 条评论
为什么被折叠?
 到【灌水乐园】发言


