


在数据处理和分析中,我们经常遇到需要将多条曲线的 x 轴统一的情况。这种需求通常出现在需要对不同来源的数据进行比较或整合时。本文将通过一个具体的例子,展示如何使用 C++ 实现这一功能,并通过插值计算新的 y 值,同时确保结果分段存储。
问题描述
我们有一个 std::vector<std::vector<double>> 数据结构,其中存储了三条曲线的数据。第一条曲线的 x 和 y 值分别存储在第 0 和第 1 行,第二条和第三条曲线的 x 和 y 值分别存储在第 2、3 和 2、4 行。这些曲线的 x 轴范围可能不同,并且可能存在不连续的点。我们的目标是统一这三条曲线的 x 轴,并计算每条曲线在新 x 轴上的 y 值。
解决方案
1. 插值函数
首先,我们需要一个插值函数来计算目标 x 值对应的 y 值。如果目标 x 在已有 x 的范围内,则通过线性插值计算 y 值;如果目标 x 超出已有 x 的范围,则返回固定值。
double interpolate(const std::vector<double>& x, const std::vector<double>& y, double target_x) {
    for (size_t i = 0; i < x.size(); ++i) {
        if (x[i] == target_x) {
            return y[i];
        }
    }
    for (size_t i = 0; i < x.size() - 1; i += 2) {
        if (x[i] < target_x && target_x < x[i + 1]) {
            double slope = (y[i + 1] - y[i]) / (x[i + 1] - x[i]);
            return y[i] + slope * (target_x - x[i]);
        }
    }
    if (target_x <= x.front()) {
        return y.front();
    }
    if (target_x >= x.back()) {
        return y.back();
    }
    return 0.0;
}
2. 合并 x 轴
接下来,我们需要将第一条曲线和第二、三条曲线的 x 轴合并成一个统一的 x 轴。这可以通过双指针法实现,逐步将较小的 x 值加入合并后的 x 轴中。
std::vector<double> merge_x(const std::vector<double>& x1, const std::vector<double>& x2) {
    std::vector<double> merged_x;
    size_t i = 0, j = 0;
    while (i < x1.size() && j < x2.size()) {
        if (x1[i] < x2[j]) {
            merged_x.push_back(x1[i]);
            ++i;
        } else if (x1[i] > x2[j]) {
            merged_x.push_back(x2[j]);
            ++j;
        } else {
            merged_x.push_back(x1[i]);
            ++i;
            ++j;
        }
    }
    while (i < x1.size()) {
        merged_x.push_back(x1[i]);
        ++i;
    }
    while (j < x2.size()) {
        merged_x.push_back(x2[j]);
        ++j;
    }
    return merged_x;
}
3. 处理曲线
最后,我们使用合并后的 x 轴,分别计算每条曲线在新 x 轴上的 y 值,并将结果存储到新的 std::vector<std::vector<double>> 中。
std::vector<std::vector<double>> process_curves(const std::vector<std::vector<double>>& para) {
    const std::vector<double>& x1 = para[0];
    const std::vector<double>& y1 = para[1];
    const std::vector<double>& x23 = para[2];
    const std::vector<double>& y2 = para[3];
    const std::vector<double>& y3 = para[4];

    std::vector<double> unified_x = merge_x(x1, x23);

    std::vector<double> new_y1;
    std::vector<double> new_y2;
    std::vector<double> new_y3;

    for (double x : unified_x) {
        new_y1.push_back(interpolate(x1, y1, x));
        new_y2.push_back(interpolate(x23, y2, x));
        new_y3.push_back(interpolate(x23, y3, x));
    }

    return {unified_x, new_y1, new_y2, new_y3};
}
示例代码
以下是完整的代码示例,包括输入数据和输出结果的展示。
#include <iostream>
#include <vector>
#include <algorithm>
// 插值函数
double interpolate(const std::vector<double>& x, const std::vector<double>& y, double target_x) {
for (size_t i = 0; i < x.size(); ++i) {
if (x[i] == target_x) {
return y[i];
}
}
for (size_t i = 0; i < x.size() - 1; i += 2) {
if (x[i] < target_x && target_x < x[i + 1]) {
double slope = (y[i + 1] - y[i]) / (x[i + 1] - x[i]);
return y[i] + slope * (target_x - x[i]);
}
}
if (target_x <= x.front()) {
return y.front();
}
if (target_x >= x.back()) {
return y.back();
}
return 0.0;
}
// 合并 x 轴
std::vector<double> merge_x(const std::vector<double>& x1, const std::vector<double>& x2) {
std::vector<double> merged_x;
size_t i = 0, j = 0;
while (i < x1.size() && j < x2.size()) {
if (x1[i] < x2[j]) {
merged_x.push_back(x1[i]);
++i;
} else if (x1[i] > x2[j]) {
merged_x.push_back(x2[j]);
++j;
} else {
merged_x.push_back(x1[i]);
++i;
++j;
}
}
while (i < x1.size()) {
merged_x.push_back(x1[i]);
++i;
}
while (j < x2.size()) {
merged_x.push_back(x2[j]);
++j;
}
return merged_x;
}
// 处理曲线
std::vector<std::vector<double>> process_curves(const std::vector<std::vector<double>>& para) {
const std::vector<double>& x1 = para[0];
const std::vector<double>& y1 = para[1];
const std::vector<double>& x23 = para[2];
const std::vector<double>& y2 = para[3];
const std::vector<double>& y3 = para[4];
std::vector<double> unified_x = merge_x(x1, x23);
std::vector<double> new_y1;
std::vector<double> new_y2;
std::vector<double> new_y3;
for (double x : unified_x) {
new_y1.push_back(interpolate(x1, y1, x));
new_y2.push_back(interpolate(x23, y2, x));
new_y3.push_back(interpolate(x23, y3, x));
}
return {unified_x, new_y1, new_y2, new_y3};
}
int main() {
std::vector<std::vector<double>> para = {
{0.0, 0.05, 0.05, 0.5, 0.5, 0.97, 0.97, 3.0, 3.0, 3.4}, // x1
{0.078, 0.078, 0.078, 0.093, 0.093, 0.098, 0.098, 0.116, 0.116, 0.156}, // y1
{0.0, 0.57, 0.57, 1.04, 1.04}, // x2 and x3
{45, 45, 50, 58, 55}, // y2
{45, 45, 42, 48, 55} // y3
};
std::vector<std::vector<double>> result = process_curves(para);
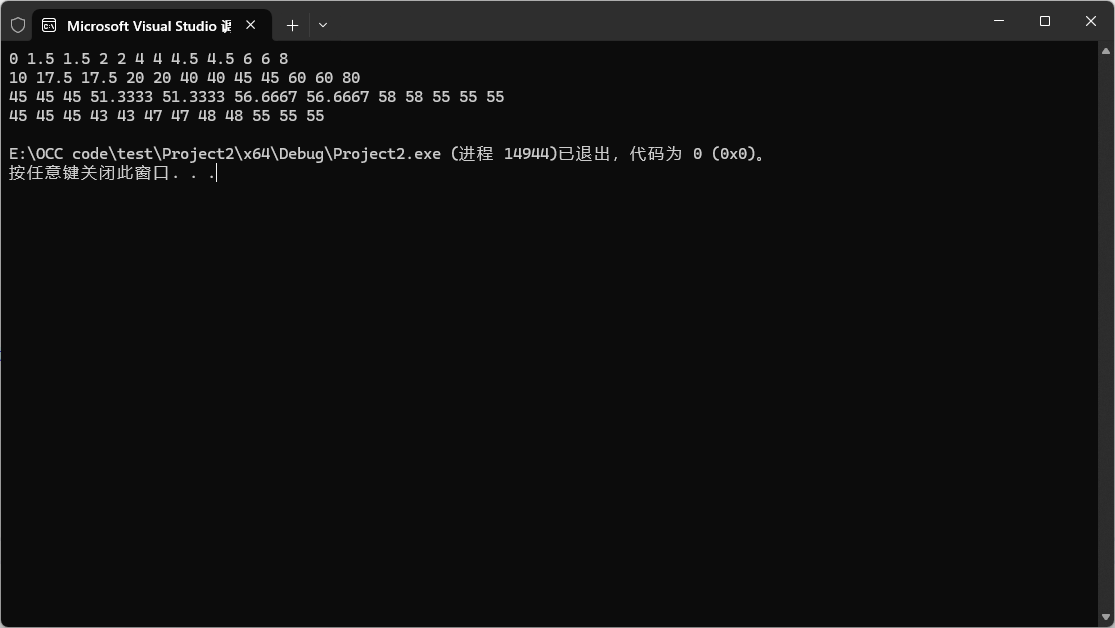
// 输出结果
for (const auto& row : result) {
for (double val : row) {
std::cout << val << " ";
}
std::cout << std::endl;
}
return 0;
}
总结
通过上述代码,我们成功实现了多条曲线 x 轴的统一,并通过插值计算了新的 y 值。这种方法不仅适用于简单的数据处理,还可以扩展到更复杂的数据分析场景。希望本文能为您的数据处理需求提供帮助!


 被折叠的 条评论
为什么被折叠?
被折叠的 条评论
为什么被折叠?
 到【灌水乐园】发言


