


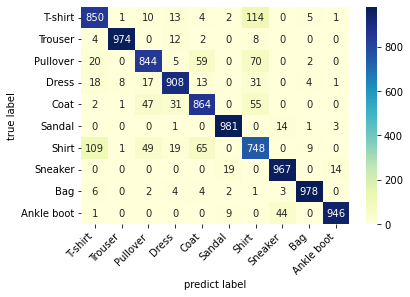
 该博客介绍了如何使用sklearn库的混淆矩阵方法来评估模型预测效果,并通过seaborn库绘制混淆矩阵的热力图。文章详细展示了代码实现过程,包括设置正确和预测标签的旋转,以及使用'YlGnBu'颜色映射。
conf_mat = confusion_matrix(test_data_y, pre_label)
df_cm = pd.DataFrame(conf_mat, index=class_label, columns=class_label)
heatmap = sns.heatmap(df_cm, annot=True, fmt='d', cmap='YlGnBu')
heatmap.yaxis.set_ticklabels(heatmap.yaxis.get_ticklabels(), rotation=0, ha='right')
heatmap.xaxis.set_ticklabels(heatmap.xaxis.get_ticklabels(), rotation=45, ha='right')
plt.ylabel("true label")
plt.xlabel("predict label")
plt.show()
annot: True指标注数据在小格子上


 3730
3730

 被折叠的 条评论
为什么被折叠?
被折叠的 条评论
为什么被折叠?
 到【灌水乐园】发言


