


 该文通过Matlab进行仿真,探索无人机作为飞行基站增强5G网络基础设施的方法。研究内容包括路径优化算法,如单无人机、双无人机、三无人机和四无人机的情况,分析了不同数量无人机的任务完成时间、距离覆盖以及能量消耗。结果显示,通过比较找到了最佳的能效平衡点。
✅作者简介:热爱科研的Matlab仿真开发者,修心和技术同步精进,matlab项目合作可私信。
🍎个人主页:Matlab科研工作室
🍊个人信条:格物致知。
⛄ 内容介绍
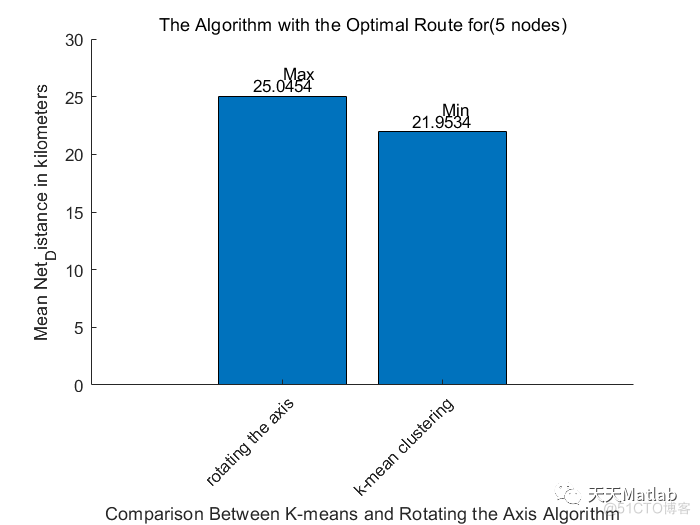
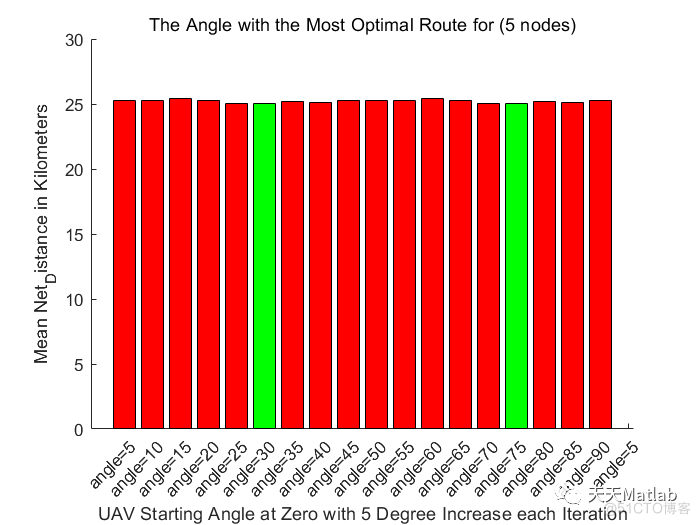
Investigating the Unmanned Aerial Vehicle (UAV) assisted 5G communications in the form of flying base stations (FBSs). The techniques deployed include assessing, improving, and developing optimization methods to route drones that carry Flying Base Station (FBS) enhancing the terrestrial 5G network infrastructure. One way being effectively collecting and transmitting data through line of sight (LoS) communication to support flash crowds, machine type communication (IoTs), analysis of energy consumption, and total time to complete the tasks.
⛄ 部分代码
xv1 = [2 -2 4];
yv1 = [2 2 5.464];
xv2=[2 4 4];
yv2=[2 -1.4642 5.464];
xv3=[2 -2 4];
yv3=[2 2 -1.4642];
fx=[2,4]
fy=[2,5.464]
%these coordinates represent traingle and the tangent in the three drone
%case
lx=[2,2];%lx and ly represent the two axis that cut the circle into 4 parts
ly=[0,4];
velocity=60 %velocity of the drone is 60m/s
power= 50 %power of the drone is 50W
d=zeros(5,1)
n=50; % number of points that you want
center = [2 ,2]; % center coordinates of the circle [x0,y0]
radius = 2; % radius of the circle
angle = 2*pi*rand(n,1);
rng(1)%fixes the points
r = radius*sqrt(rand(n,1));
x = center(1)+r.*cos(angle) ;%x coordinates of the points inscribed in my circle
y = center(2)+r.*sin(angle);%y coordinates of the points inscribed in my circle
x(1)=2;
y(1)=2;%center of the circle coordinates which is the base station in our case where the drone should launch from
v=[x,y]
%first case when we have one drone
figure(1)
plot( x, y, 'r*');
axis equal
X = v;
s = size(X,1);
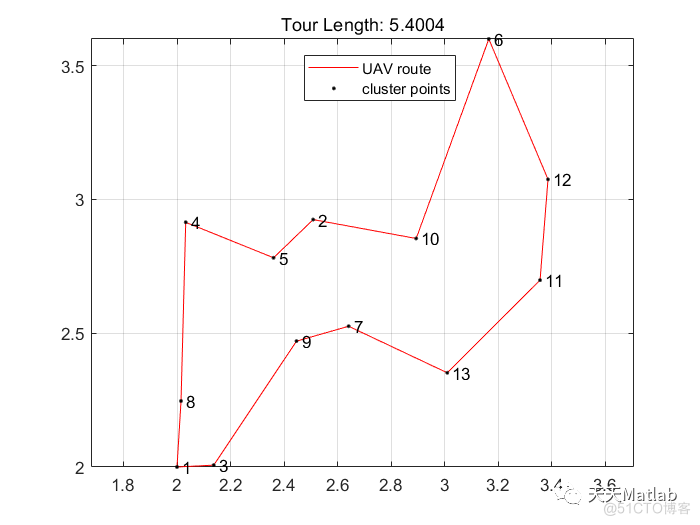
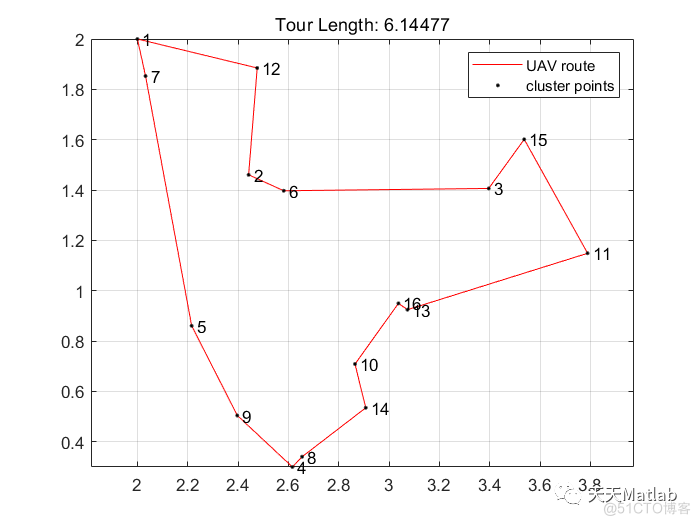
[p,d1] = tspsearch(X,s)%the 2opt algorithm
figure(2)
tspplot(p,X,1)
opts = statset('Display','final');
distance_to_finish_the_task1=d1*1000
distance_onedrone=d1*1000
time1=distance_onedrone/velocity
%%%%%%%%%%%%%%%%%%%%%%%%%%%%%%%%%%%%%%
figure(3)
plot( x, y,'r*',ly,lx, 'r-');
axis equal
x_center = 2;
y_center = 2;% coordinates of the center of the circle
b=v(:,2);% each drone is going through one part of the circle the upper part for y>2 and lower part y<2 that is why the y coordinates are being called
X = v( b<=y_center,:);
s = size(X,1);
[p,d1] = tspsearch(X,s)
figure(4)
tspplot(p,X,1)
X = v( b>=y_center,:);
s = size(X,1);
[p,d2] = tspsearch(X,s)
figure(5)
tspplot(p,X,1)
opts = statset('Display','final');
distance2=[d1*1000 d2*1000];
distance_to_finish_the_task2=max(distance2);
time_to_finish_the_task2=distance_to_finish_the_task2/velocity;
distance_twodrones=(d1+d2)*1000;
time2=((d1*1000/velocity)+(d2*1000/velocity))/2;
energy_consumption2=power*(distance_twodrones/velocity);
%%%%%%%%%%%%%%%%%%%%%%%%%%%%%%%%%%
figure(6)
plot( x, y,'r*',xv3,yv3,'.-r',xv1,yv1,'.-r',xv2,yv2,'.-r',fx,fy, 'r-')
axis equal
a=v(:,1);
b=v(:,2);
in = inpolygon(a,b,xv1,yv1);
g= [a(in),b(in)]
X=g;
s = size(X,1);
[p,d1] = tspsearch(X,s)
figure(7)
tspplot(p,X,1)
in = inpolygon(a,b,xv2,yv2);
l= [a(in),b(in)]
X = l;
s = size(X,1);
[p,d2] = tspsearch(X,s)
figure(8)
tspplot(p,X,1)
in = inpolygon(a,b,xv3,yv3);
m= [a(in),b(in)]
X = m;
s = size(X,1);
[p,d3] = tspsearch(X,s)
figure(9)
tspplot(p,X,1)
opts = statset('Display','final');
distance3=[d1*1000 d2*1000 d3*1000]
distance_to_finish_the_task3=max(distance3)
time_to_finish_the_task3=distance_to_finish_the_task3/velocity
distance_threedrones=(d1+d2+d3)*1000
time3=((d1*1000/velocity)+(d2*1000/velocity)+(d3*1000/velocity))/3
energy_consumption3=power*(distance_threedrones/velocity)
%%%%%%%%%%%%%%%%%%%%%%%%%%%%%%%%%%%%%%%%%
X = v(a<=x_center & b<=y_center,:);
s = size(X,1);
[p,d1] = tspsearch(X,s)
figure(10)
tspplot(p,X,1)
X = v(a<=x_center & b>=y_center,:);
s = size(X,1);
[p,d2] = tspsearch(X,s)
figure(11)
tspplot(p,X,1)
X = v(a>=x_center & b<=y_center,:);
s = size(X,1);
[p,d3] = tspsearch(X,s)
figure(12)
tspplot(p,X,1)
X = v(a>=x_center & b>=y_center,:);
s = size(X,1);
[p,d4] = tspsearch(X,s)
figure(13)
tspplot(p,X,1)
opts = statset('Display','final');
distance4=[d1*1000 d2*1000 d3*1000 d4*1000];
distance_to_finish_the_task4=max(distance4);
time_to_finish_the_task4= distance_to_finish_the_task4/velocity;
distance_fourdrones=(d1+d2+d3+d4)*1000;
time4=((d1*1000/velocity)+(d2*1000/velocity)+(d3*1000/velocity)+(d4*1000/velocity))/4;
energy_consumption4=power*(distance_fourdrones/velocity);
number_of_drones = {'1drone';'2drones';'3drones';'4drones'}
distance = [distance_onedrone;distance_twodrones;distance_threedrones;distance_fourdrones];
time = [time1;time2;time3;time4];
energy_consumption = [energy_consumption1;energy_consumption2;energy_consumption3;energy_consumption4];
time_to_finish_the_task=[time_to_finish_the_task1;time_to_finish_the_task2;time_to_finish_the_task3;time_to_finish_the_task4];
distance_to_finish_the_task=[distance_to_finish_the_task1;distance_to_finish_the_task2;distance_to_finish_the_task3;distance_to_finish_the_task4];
xorigin=xlim %starting from zero
yorigin=ylim %starting from zero
drones_1dist=sqrt(((time1-xorigin(1))^2 )+((energy_consumption1-yorigin(1))^2))
drones_2dist=sqrt(((time2-xorigin(1))^2 )+((energy_consumption2-yorigin(1))^2))
drones_3dist=sqrt(((time3-xorigin(1))^2 )+((energy_consumption3-yorigin(1))^2))
drones_4dist=sqrt(((time4-xorigin(1))^2 )+((energy_consumption4-yorigin(1))^2))
trade_off=[drones_1dist;drones_2dist;drones_3dist;drones_4dist]
best_trade_off=min([drones_2dist,drones_3dist,drones_1dist,drones_4dist])
table = array2table(trade_off);
table.Properties.VariableNames = {'distance_fourdrones'}
bar(trade_off)
%%%%%
timee= 7 + (9-7).*rand(n,1)
hovering_time=sum(timee)
total_energy_consumption1=power*((distance_onedrone/velocity)+hovering_time);
total_energy_consumption2=power*((distance_twodrones/velocity)+hovering_time);
total_energy_consumption3=power*((distance_threedrones/velocity)+hovering_time);
total_energy_consumption4=power*((distance_fourdrones/velocity)+hovering_time);
total_energy_consumption=[total_energy_consumption1;total_energy_consumption2;total_energy_consumption3;total_energy_consumption4];
total_time=[time1+hovering_time;time2+hovering_time;time3+hovering_time;time4+hovering_time];
total_time_to_finish_the_task=[time_to_finish_the_task1+hovering_time;time_to_finish_the_task2+hovering_time;time_to_finish_the_task3+hovering_time;time_to_finish_the_task4+hovering_time];
D=[distance_onedrone;distance_twodrones;distance_threedrones;distance_fourdrones];
drone_one1=[time1;time_to_finish_the_task1];
drone_one2=[time2;time_to_finish_the_task2];
drone_one3=[time3;time_to_finish_the_task3];
drone_one4=[time4;time_to_finish_the_task4];
data = [drone_one1 drone_one2 drone_one3 drone_one4 ];
figure(14)
hb = bar(data)
set(hb(1), 'FaceColor','r')
set(hb(2), 'FaceColor','b')
set(hb(3), 'FaceColor','g')
set(hb(4), 'FaceColor','y')
ylabel('Time in sec');
set(gca,'XTickLabel',{'average time spent by the drones','time to complete the task'})
set(hb, {'DisplayName'}, {'one drone','two drones','three drones','four drones'}')
legend()
figure(15)
labels = {'one drone','two drones','three drones','four drones'};
plot(total_time_to_finish_the_task,distance_to_finish_the_task,'o',total_time_to_finish_the_task,distance_to_finish_the_task)
text(total_time_to_finish_the_task,distance_to_finish_the_task,labels,'VerticalAlignment','bottom','HorizontalAlignment','right')
ylabel('Distance Covered by the UAV with the Longest Route');
xlabel('Time to complete the task in sec');
figure(16)
labels = {'one drone','two drones','three drones','four drones'};
plot(total_time_to_finish_the_task,total_energy_consumption,'o',total_time_to_finish_the_task,total_energy_consumption)
text(total_time_to_finish_the_task,total_energy_consumption,labels,'VerticalAlignment','bottom','HorizontalAlignment','right')
ylabel('Total Energy Consumption in Joules');
xlabel('Time to complete the Task by the UAVs in sec');
figure(17)
labels = {'one drone','two drones','three drones','four drones'};
plot(time,energy_consumption,'o',time,energy_consumption)
ylabel('Energy Consumption in Joules Excluding Houvering Energy');
xlabel('Time to Complete the Task by the Drones in sec Excluding houvering time');
text(time,energy_consumption,labels,'VerticalAlignment','bottom','HorizontalAlignment','right')
figure(18)
labels = {'one drone','two drones','three drones','four drones'};
plot(total_time,total_energy_consumption,'o',total_time,total_energy_consumption)
text(total_time,total_energy_consumption,labels,'VerticalAlignment','bottom','HorizontalAlignment','right')
ylabel('Total Energy Consumption in Joules ');
xlabel('Average Time Spent by the UAVs in sec');
figure(19)
[maxBar,maxIndex] = max(trade_off);
[minBar,minIndex] = min(trade_off);
figure(100)
bar(trade_off)
text(minIndex-0.5,minBar+5,'Best Trade Off')
set(gca,'XTickLabel',{'one drone','two drones','three drone','four drones'})
xtickangle(45)
xlabel('Number of Drones');
ylabel('Euclidean Distance From the Origin to Each Drone in Meters')
title('Best Trade off')
box off
⛄ 运行结果


 4005
4005

 被折叠的 条评论
为什么被折叠?
被折叠的 条评论
为什么被折叠?
 到【灌水乐园】发言


