


💥💥💞💞欢迎来到本博客❤️❤️💥💥
🏆博主优势:🌞🌞🌞博客内容尽量做到思维缜密,逻辑清晰,为了方便读者。
⛳️座右铭:行百里者,半于九十。
📋📋📋本文目录如下:🎁🎁🎁
目录
💥1 概述
CoVeni 是一个用于计算和可视化病毒传播的脚本。它旨在模拟病毒在人口中的传播过程,并提供一些直觉上的验证。该脚本可以根据不同的参数设置来模拟不同类型的人群,并考虑到日常接触、旅行等因素对病毒传播的影响。CoVeni 脚本通过模拟病毒在人群中的传播过程来计算疫情的发展趋势。它考虑了人口中不同类型的人,以及它们之间的接触情况。脚本允许用户定义不同类型的人,并通过设置不同的概率参数来模拟他们的行为和反应。这些概率可以反映出人们的日常活动、行为习惯和防护措施等因素。脚本根据每个人的接触半径以及每天的接触次数来模拟日常接触。用户可以通过调整接触半径和接触次数来探索不同的传播情景。CoVeni 脚本还考虑了人群中的旅行行为。它允许选定的个体在某一天进行旅行,然后在下一天返回,以模拟人口流动对疫情传播的影响。脚本提供了对疫情传播过程的可视化,包括人口中感染者的分布、每天新增感染者的情况以及 R 值的变化趋势等。CoVeni 脚本为研究人口中病毒传播的动态过程提供了一个简单而有效的模拟工具,可以帮助人们更好地理解疫情的发展趋势,并评估不同干预措施的效果。
📚2 运行结果
主函数部分代码:
%{
Script 'CoVeni.m' is written to visualize some aspects of virusses (or
anything infectuous) in a population and to test some of my intuitions. An
improved version that allows societies of a realistic size and overcomes
the problem that infected regions tend to quickly become 100% infected is
available as 'CoVici.m'. The once-intended CoVidi.m script did not
materialize (yet).
This script simulates the percolation of the virus in a society the members
of which have a certain number of daily contacts. There may be different
types of persons in the population with different characterisitics.
Remarks:
0) Person-types are defined through the probabilities that certain events
happen or behaviours are expressed. All probabilities are per day
1) The number of contacts that each person has per day is set by the
contact radius rC that defines a square of size (2*rC+1)^2, centered around
the person. So rC=1/2/3 gives 8/24/48 contacts. In absence of travel, the
contacts do not change between days.
2) Travel is implemented in the form of day trips: the selected persons go
to another location as first thing in the day, and come back the next day.
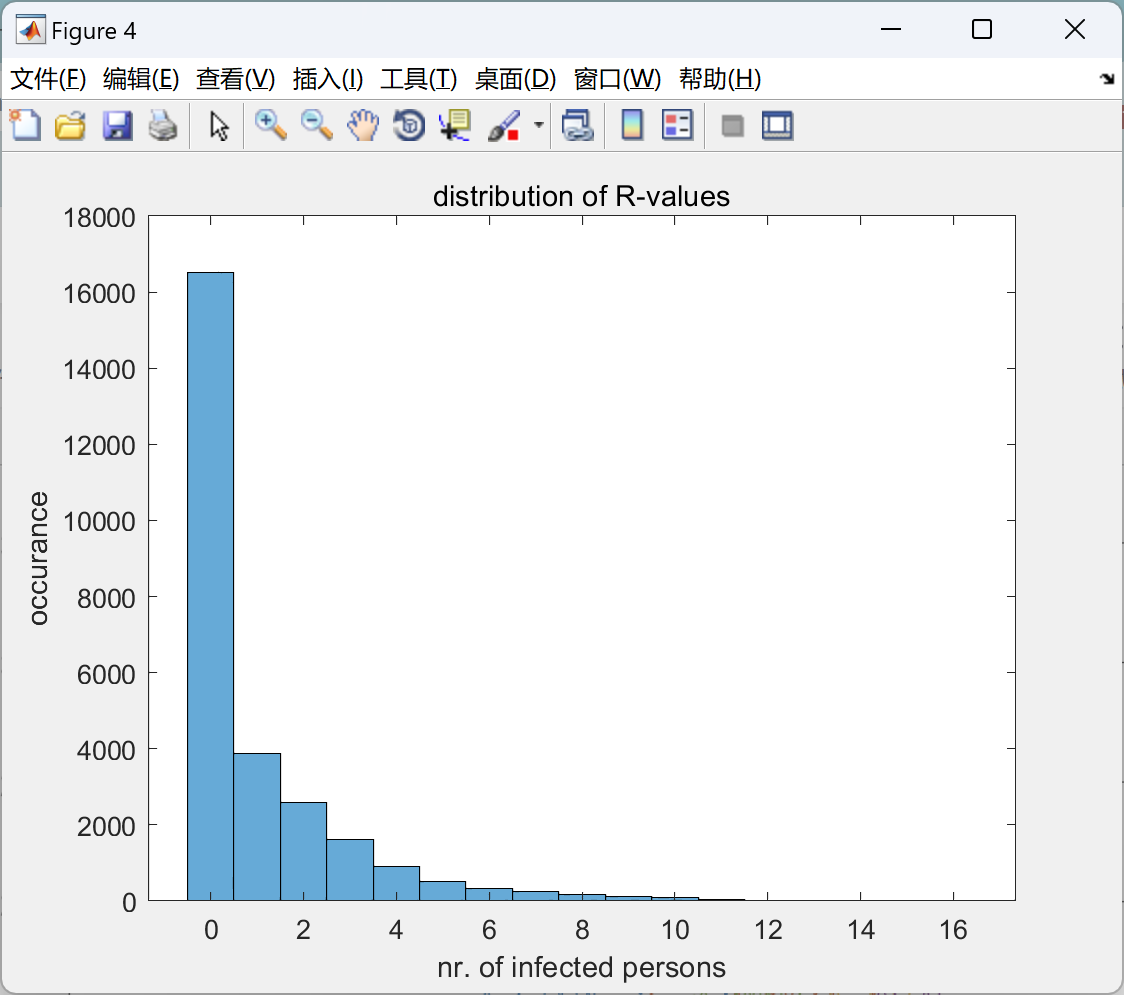
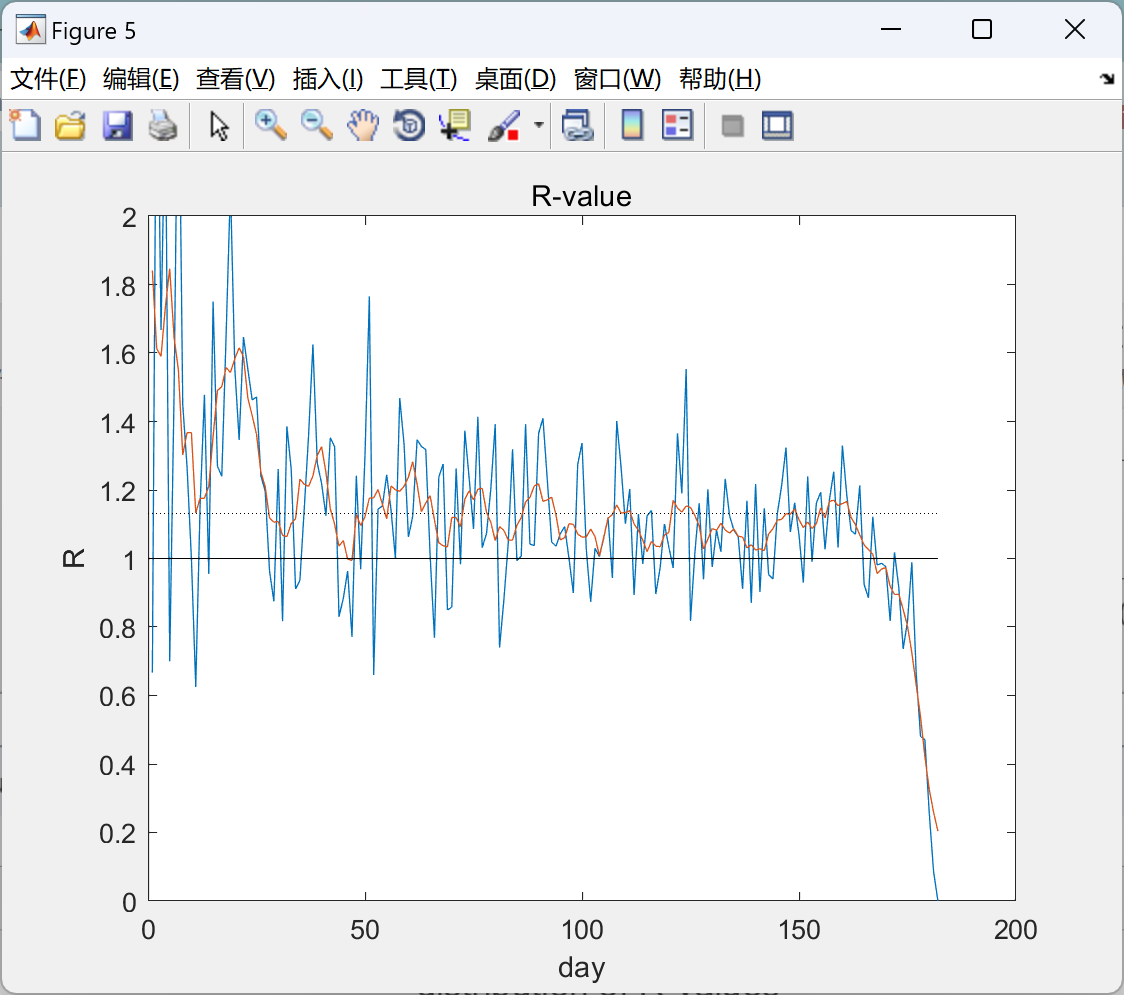
3) The daily R-factor is calculated as the average number of infections per
person for persons infected on that day. The used methods leads to
significant underestimation of R towards the end of the simulation, i.e.
when not all persons from that day have recovered or died.
4) Plotting the color map takes up a considerable fraction of the
calculation time.
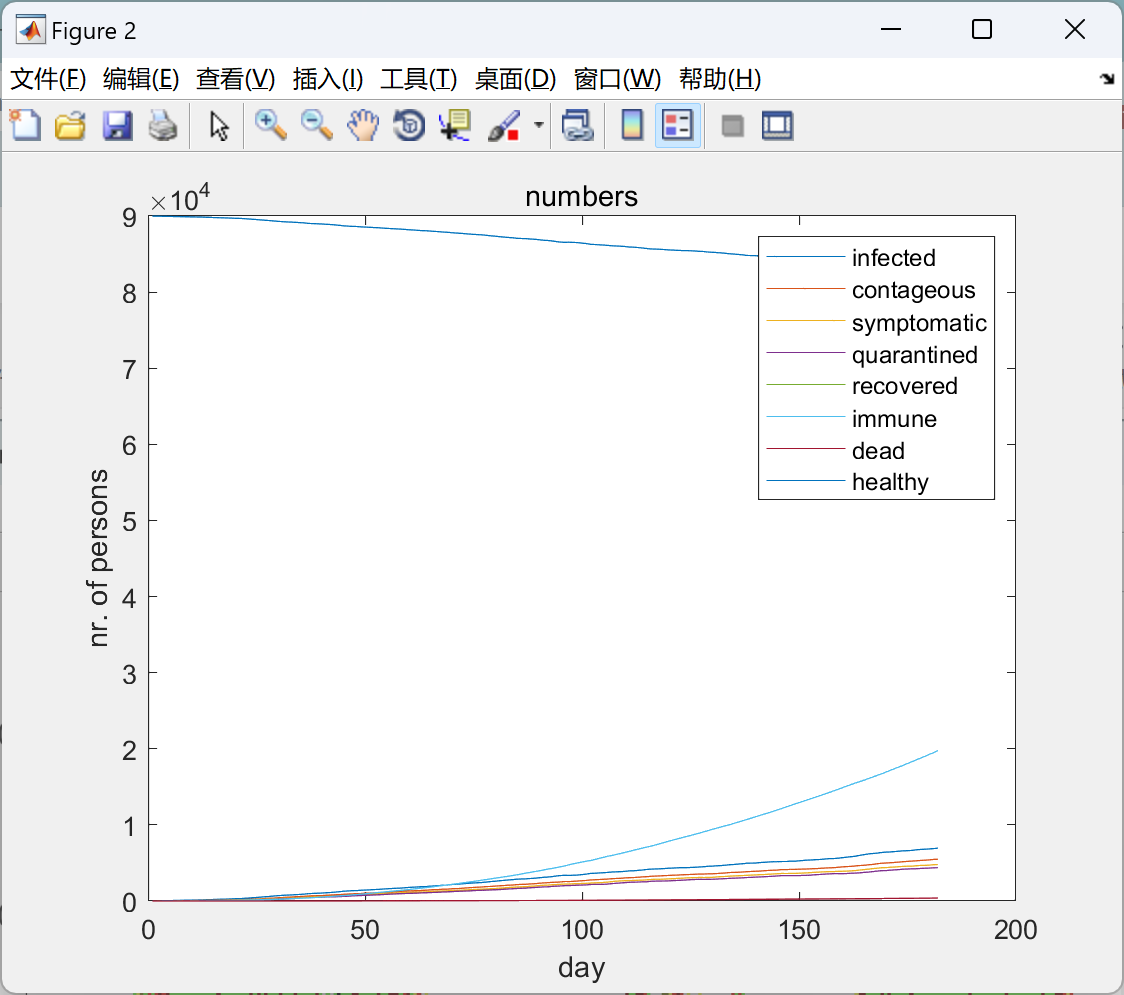
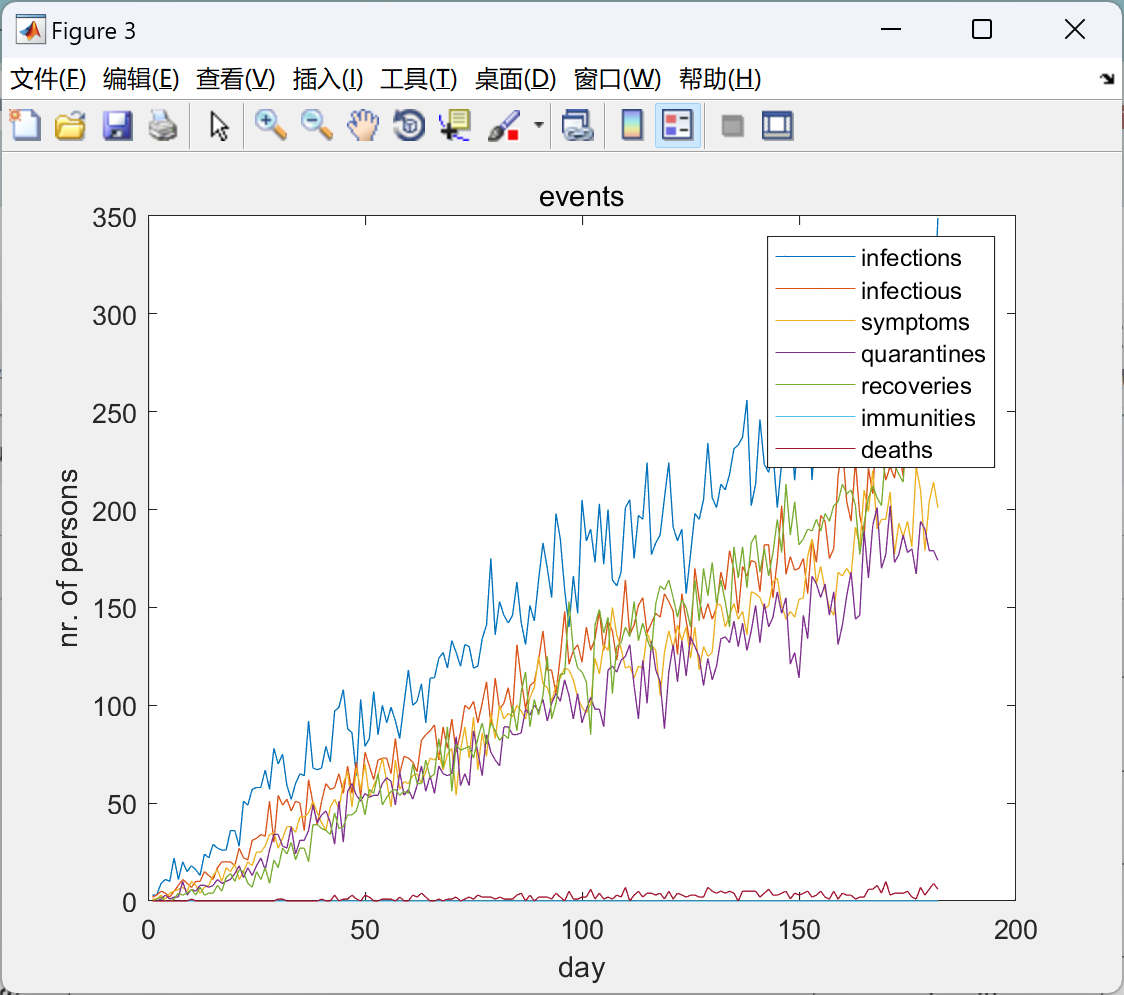
Legend of arrays 'out.events' and 'out.numbers':
1-infections
2-infectious
3-symptoms
4-quarantines
5-recoveries
6-immunities
7-deaths
8-healthy (out.numbers only)
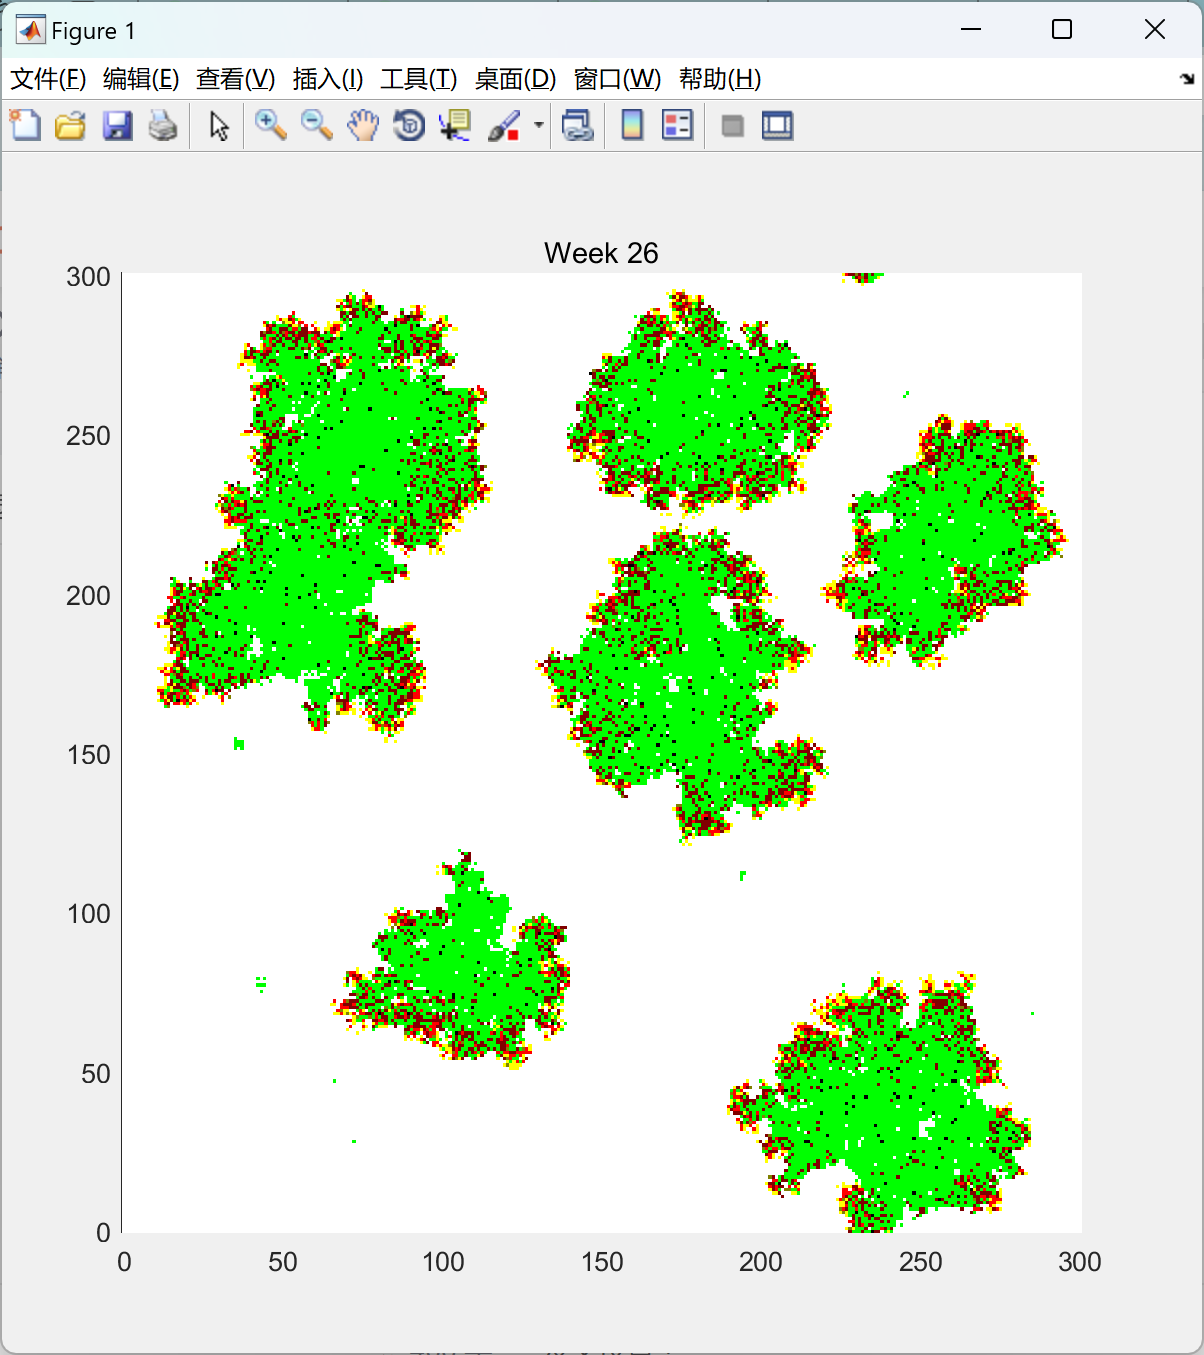
Legend of the 2D color map:
white - healthy, not immune
yellow - infected
red - infectious
green - immune
black - death
dark colors: in quarantaine
DISCLAIMER: This program is written as a hobby project. It does not pretend
to reflect the current state-of-the-art in modeling of infectious diseases
and it might make questionable or incorrect assumptions.
%}
clear
%% User input from file
[FileName,PathName]=uigetfile('jobs\*.dat'); %job file must have .dat extension
InputFile = [PathName,FileName];🎉3 参考文献
文章中一些内容引自网络,会注明出处或引用为参考文献,难免有未尽之处,如有不妥,请随时联系删除。
[1]谢欧. 基于多智能体的急性呼吸道病毒传播建模及仿真研究[D].湖南理工学院,2023.DOI:10.27906/d.cnki.gnghy.2023.000177.
[2]栾志成. 新冠病毒肺炎传播的仿真与建模[D].天津理工大学,2023.DOI:10.27360/d.cnki.gtlgy.2023.001329.
🌈4 Matlab代码实现


 629
629

 被折叠的 条评论
为什么被折叠?
被折叠的 条评论
为什么被折叠?
 到【灌水乐园】发言


