


一、为什么使用prometheus监控k8s集群
- 与k8s高度集成:与k8s的组件高度集成,以获取有关Pod、容器和服务的指标数据
- 方便查询数据:支持PromQL,一种多维的灵活查询语言,查询数据更方便简洁
- 使用“拉”模型:通过HTTP上的拉取时间序列收集数据,相比“推”模型降低压力
- 可扩展性强:Prometheus具有水平扩展的能力,可以通过添加更多的实例来处理大规模的监控数据,这使得它非常适合用于监控大型K8s集群
二、部署prometheus
版本信息:
prometheus版本:3.1.0node-exporter版本:1.8.2
kubernetes版本:1.28.14
拉取prometheus docker镜像
docker pull prom/prometheus
推送镜像到harbor仓库中
docker tag prom/prometheus:latest harbor.com/k8s_repository/prometheus:3.1.0

docker push harbor.com/k8s_repository/prometheus:3.1.0
编写prometheus部署的yaml,创建prometheus所需的ServiceAccount、ClusterRolebinding、Service、Ingress、Deployment、Configmap
#创建SA
apiVersion: v1
kind: ServiceAccount
metadata:
  name: prometheus
  namespace: monitor

---
#创建clusterrole
apiVersion: rbac.authorization.k8s.io/v1
kind: ClusterRole
metadata:
  name: prometheus
rules:
- apiGroups:
  - ""
  resources:
  - nodes
  - services
  - endpoints
  - pods
  - nodes/proxy
  - nodes/proxy
  verbs:
  - get
  - list
  - watch
- apiGroups:
  - "extenstions"
  resources:
    - ingresses
  verbs:
  - get
  - list
  - watch
- apiGroups:
  - ""
  resources:
  - configmaps
  - nodes/metrics
  verbs:
  - get
- nonResourceURLs:
  - /metrics
  verbs:
  - get

---
#创建clusterrolebinding
apiVersion: rbac.authorization.k8s.io/v1
kind: ClusterRoleBinding
metadata:
  name: prometheus
roleRef:
  apiGroup: rbac.authorization.k8s.io
  kind: ClusterRole
  name: prometheus
subjects:
- kind: ServiceAccount
  name: prometheus
  namespace: monitor

---
#创建svc
apiVersion: v1
kind: Service
metadata:
  name: prometheus-svc
  namespace: monitor
  labels:
    app: prometheus
spec:
  selector:
    app: prometheus
  type: NodePort
  ports:
    - name: web
      nodePort: 32224
      port: 9090
      targetPort: http

---
#创建ingress
apiVersion: networking.k8s.io/v1
kind: Ingress
metadata:
  name: prometheus-ingress
  namespace: monitor
spec:
  ingressClassName: nginx
  rules:
  - host: www.myprometheus.com
    http:
      paths:
      - path: /
        pathType: Prefix
        backend:
          service:
            name:  prometheus-svc
            port:
              number: 9090
---
#创建deployment
apiVersion: apps/v1
kind: Deployment
metadata:
  name: prometheus
  namespace: monitor
  labels:
    app: prometheus
spec:
  selector:
    matchLabels:
      app: prometheus
  replicas: 1
  template:
    metadata:
      labels:
        app: prometheus
    spec:
      serviceAccountName: prometheus
      initContainers:
      - name: "change-permission-of-directory"
        image: 192.168.119.150/myrepo/busybox:stable-glibc
        command: ["/bin/sh"]
        args: ["-c","chown -R 65534:65534 /prometheus"]
        securityContext:
          privileged: true
        volumeMounts:
        - mountPath: "/etc/prometheus"
          name: config-volume
        - mountPath: "/prometheus"
          name: data
      containers:
      - image: 192.168.119.150/k8s_repository/prometheus:3.1.0
        name: prometheus
        args:
        - "--config.file=/etc/prometheus/prometheus.yml"#指定prometheus配置文件路径
        - "--storage.tsdb.path=/prometheus"#指定tsdb数据库存储路径
        - "--web.enable-lifecycle"#允许热更新,curl localhost:9090/-/reload 进行热更新
        - "--web.console.libraries=/usr/share/prometheus/console_libraries"
        - "--web.console.templates=/usr/share/prometheus/consoles"
        ports:
        - containerPort: 9090
          name: http
        volumeMounts:
        - mountPath: "/etc/prometheus"
          name: config-volume
        - mountPath: "/prometheus"
          name: data
        resources:
          requests:
            cpu: 100m
            memory: 512Mi
          limits:
            cpu: 100m
            memory: 512Mi
      volumes:
      - name: data
        hostPath:
          path: /data/prometheus
      - configMap:
          name: prometheus-config
        name: config-volume
---
#创建configmap
apiVersion: v1
kind: ConfigMap
metadata:
  name: prometheus-config
  namespace: monitor
data:
  prometheus.yml: |
    global:
      scrape_interval: 15s
      evaluation_interval: 15s
    scrape_configs:
    - job_name: 'prometheus'
      static_configs:
      - targets: ['localhost:9090']
kubectl apply 部署prometheus所需的yaml
kubectl apply -f prometheus.yaml
三、metrics
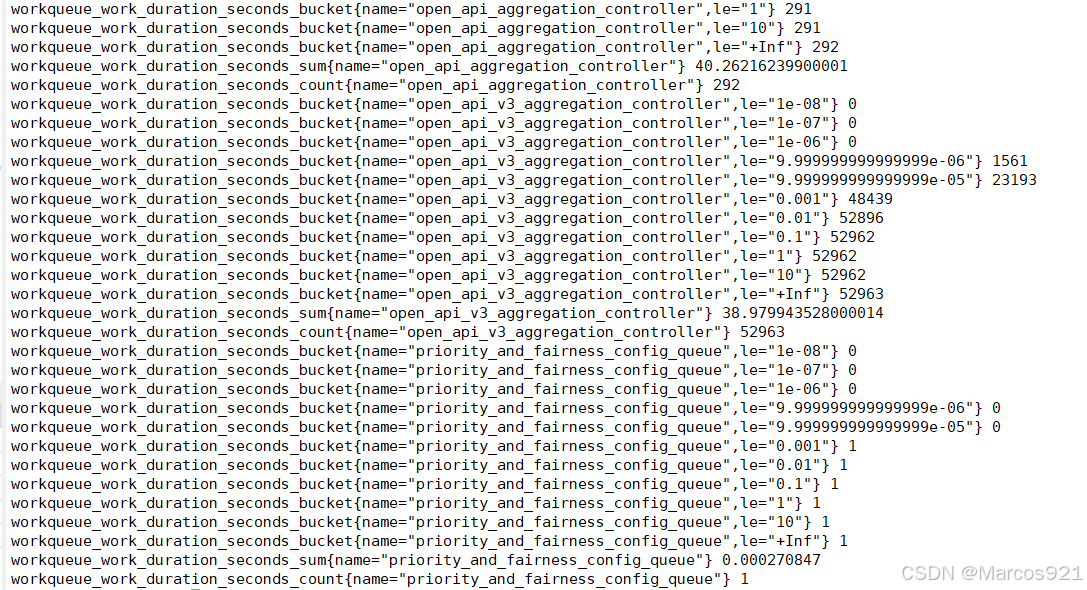
prometheus的pod自带收集数据的接口,我们通过curl {pod IP}:9090/metrics的方式,就可以收集到prometheus这个pod的指标,如下图所示
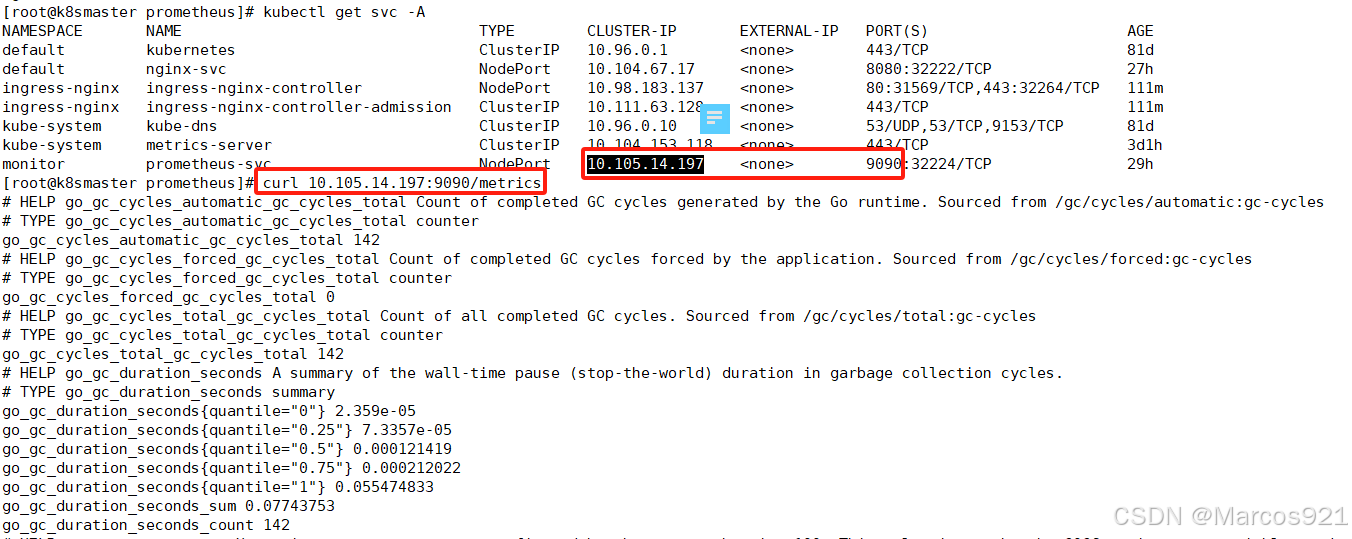
每个指标的格式都相同,指标的格式为:指标名{标签}:指标值
例如下面这个指标
promhttp_metric_handler_requests_total{code="200", instance="localhost:9090", job="prometheus"} 834
- 指标名:promhttp_metric_handler_requests_total
- 标签:{code="200", instance="localhost:9090", job="prometheus"}
- 指标值:834
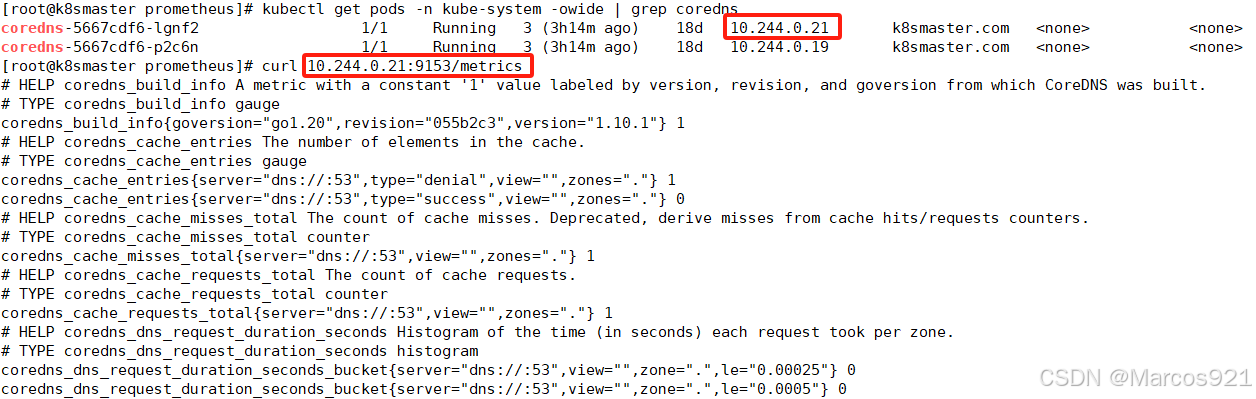
k8s的核心组件,如:kube-apiserver、scheduler、controller-manger、etcd、core-dns都会暴露metrics,提供监控数据接口,下图是访问coredns的metrics
四、访问prometheus的web界面
因为我们在上面的yaml中定义了prometheus的ingress,所以我们可以访问我们自定义的域名www.myprometheus.com来访问prometheus的web界面。
如果prometheus启动正常的话,访问网址就会进入如下的界面
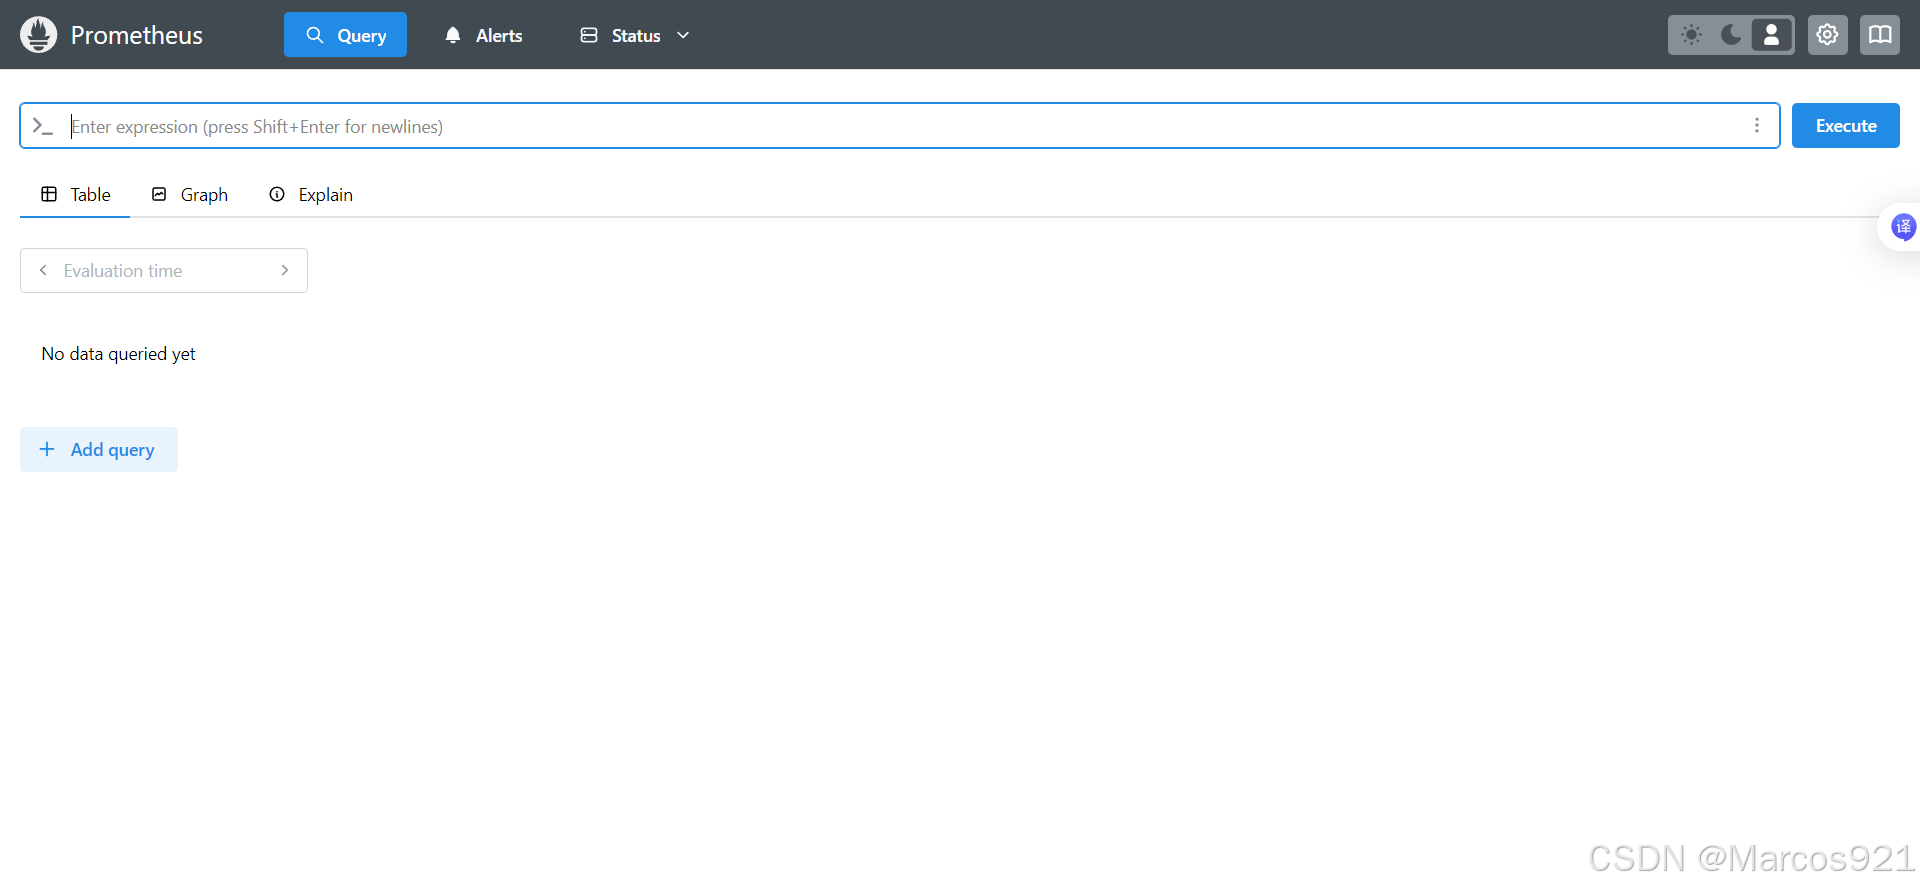
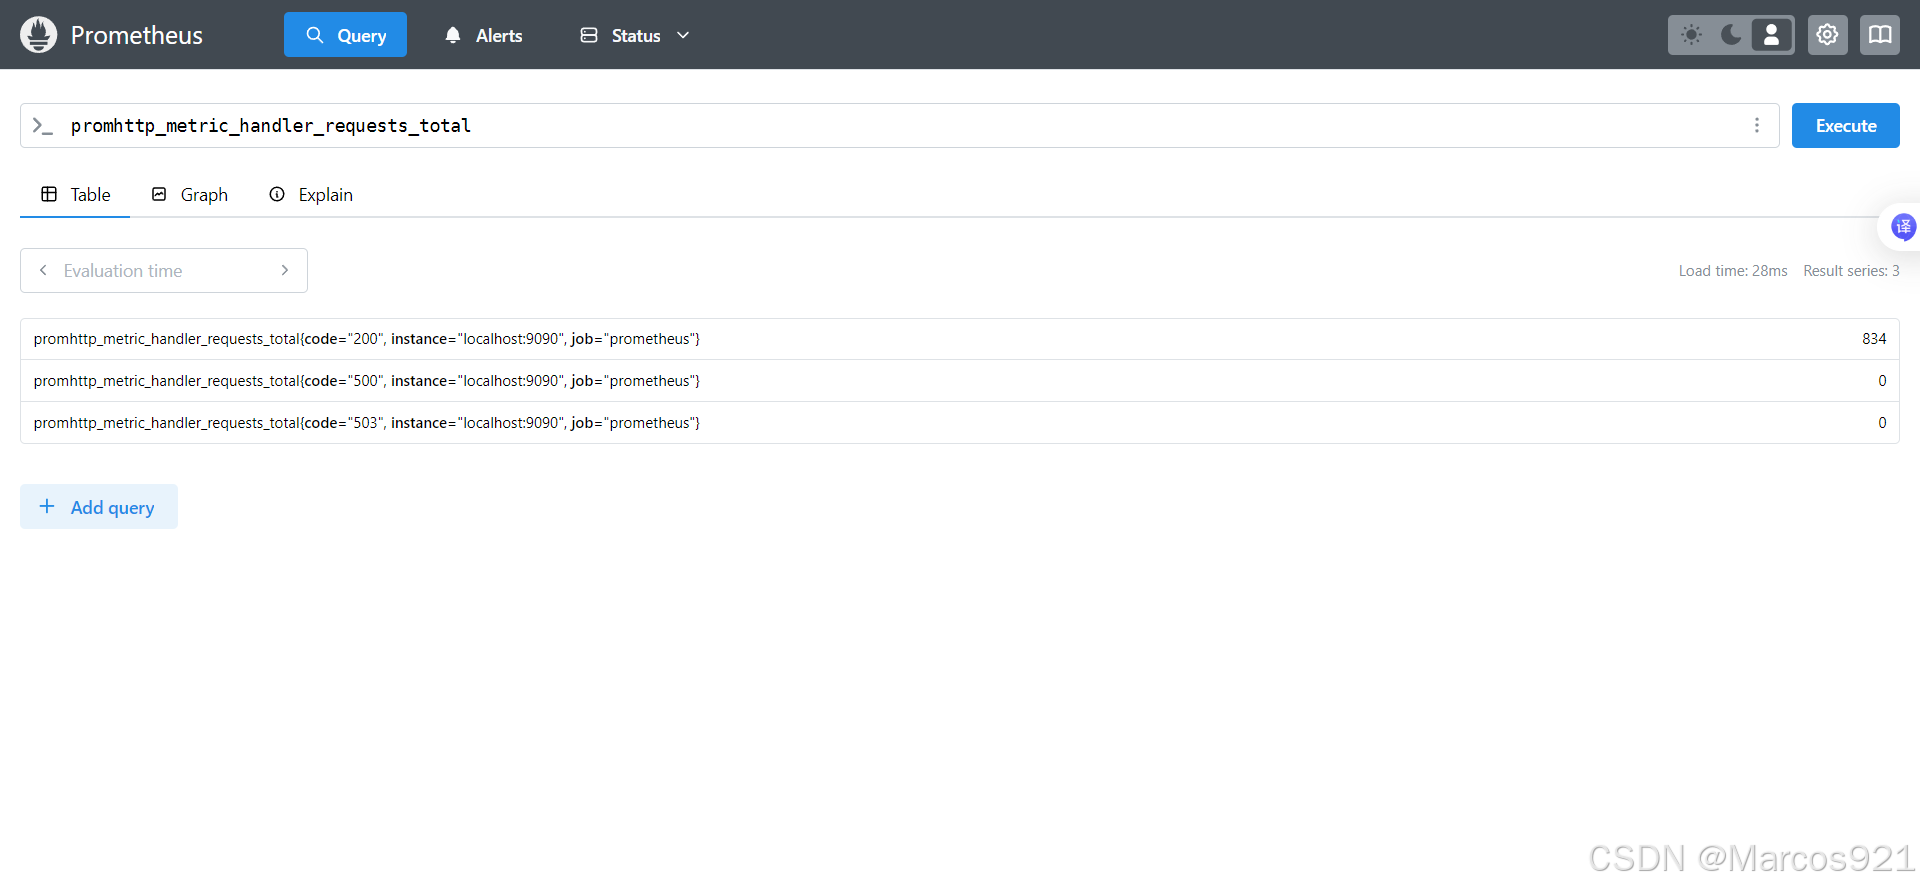
在prometheus的web界面,我们可以按照prometheus指标来查询该指标的值,点击右边的蓝色按钮进行查询
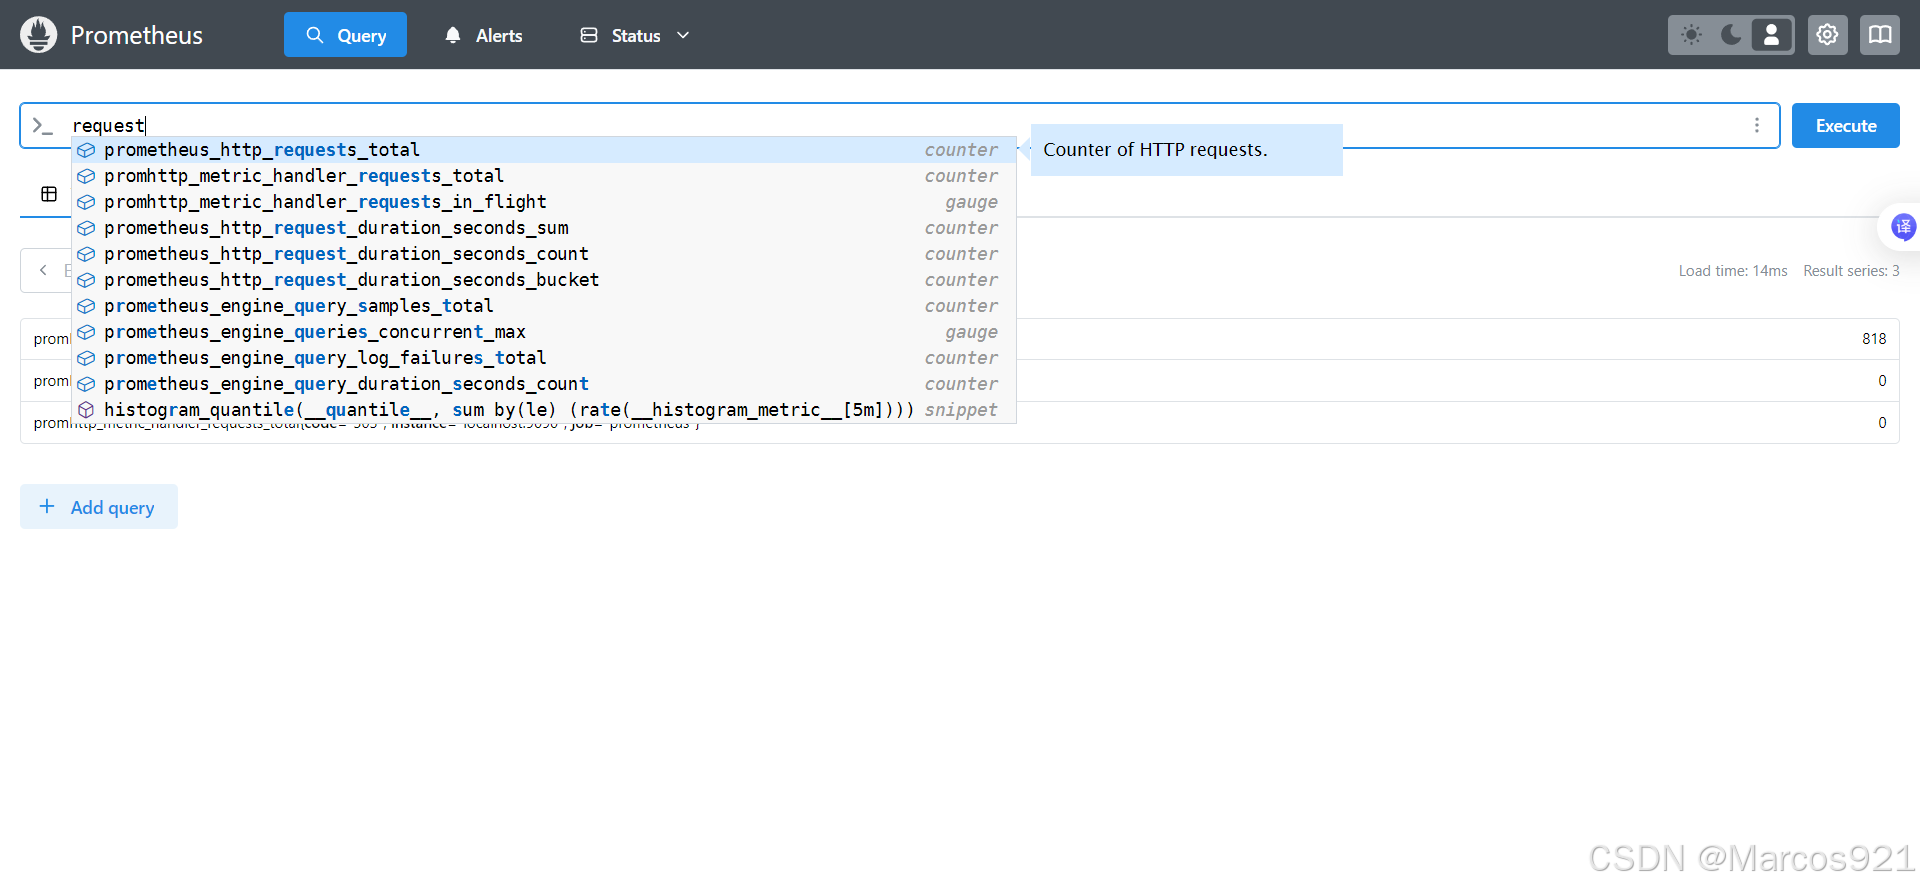
例如下方指标为promhttp_metric_handler_requests_total 的 值为 834
| promhttp_metric_handler_requests_total{code="200", instance="localhost:9090", job="prometheus"} | 834 |
五、prometheus监控k8s核心组件
我们已经知道,通过curl {pod IP}:9090/metrics的方式,就可以收集到prometheus这个pod的指标,同样的,kube-apiserver、scheduler、controller-manger、etcd、core-dns这些k8s核心组件的pod也提供了metrics接口,我们可以通过curl的方式访问到kube-apiserver这个pod的metrics
curl -k --cert /etc/kubernetes/pki/apiserver-kubelet-client.crt --key /etc/kubernetes/pki/apiserver-kubelet-client.key --cacert /etc/kubernetes/pki/ca.crt https://10.96.0.1/metrics
执行上述指令后,会获得到kube-apiserver的指标
编写prometheus的configmap,添加coredns和kube-apiserver的监控项
apiVersion: v1
kind: ConfigMap
metadata:
  name: prometheus-config
  namespace: monitor
data:
  prometheus.yml: |
    global:
      scrape_interval: 15s
      evaluation_interval: 15s
    scrape_configs:
    - job_name: 'prometheus'
      static_configs:
      - targets: ['localhost:9090']
    - job_name: 'coredns'#coredns监控项
      static_configs:
      - targets: ['10.96.0.10:9153']
    - job_name: 'kube-apiserver'#添加kube-apiserver监控项
      scheme: https
      tls_config:
        insecure_skip_verify: true
        ca_file: '/var/run/secrets/kubernetes.io/serviceaccount/ca.crt'
      bearer_token_file: '/var/run/secrets/kubernetes.io/serviceaccount/token'
      static_configs:
      - targets: ['10.96.0.1:443']
apply configmap的yaml
kubectl apply -f prometheus-configmap.yaml
执行命令让prometheus重新加载配置文件
curl -XPOST 10.105.14.197:9090/-/reload
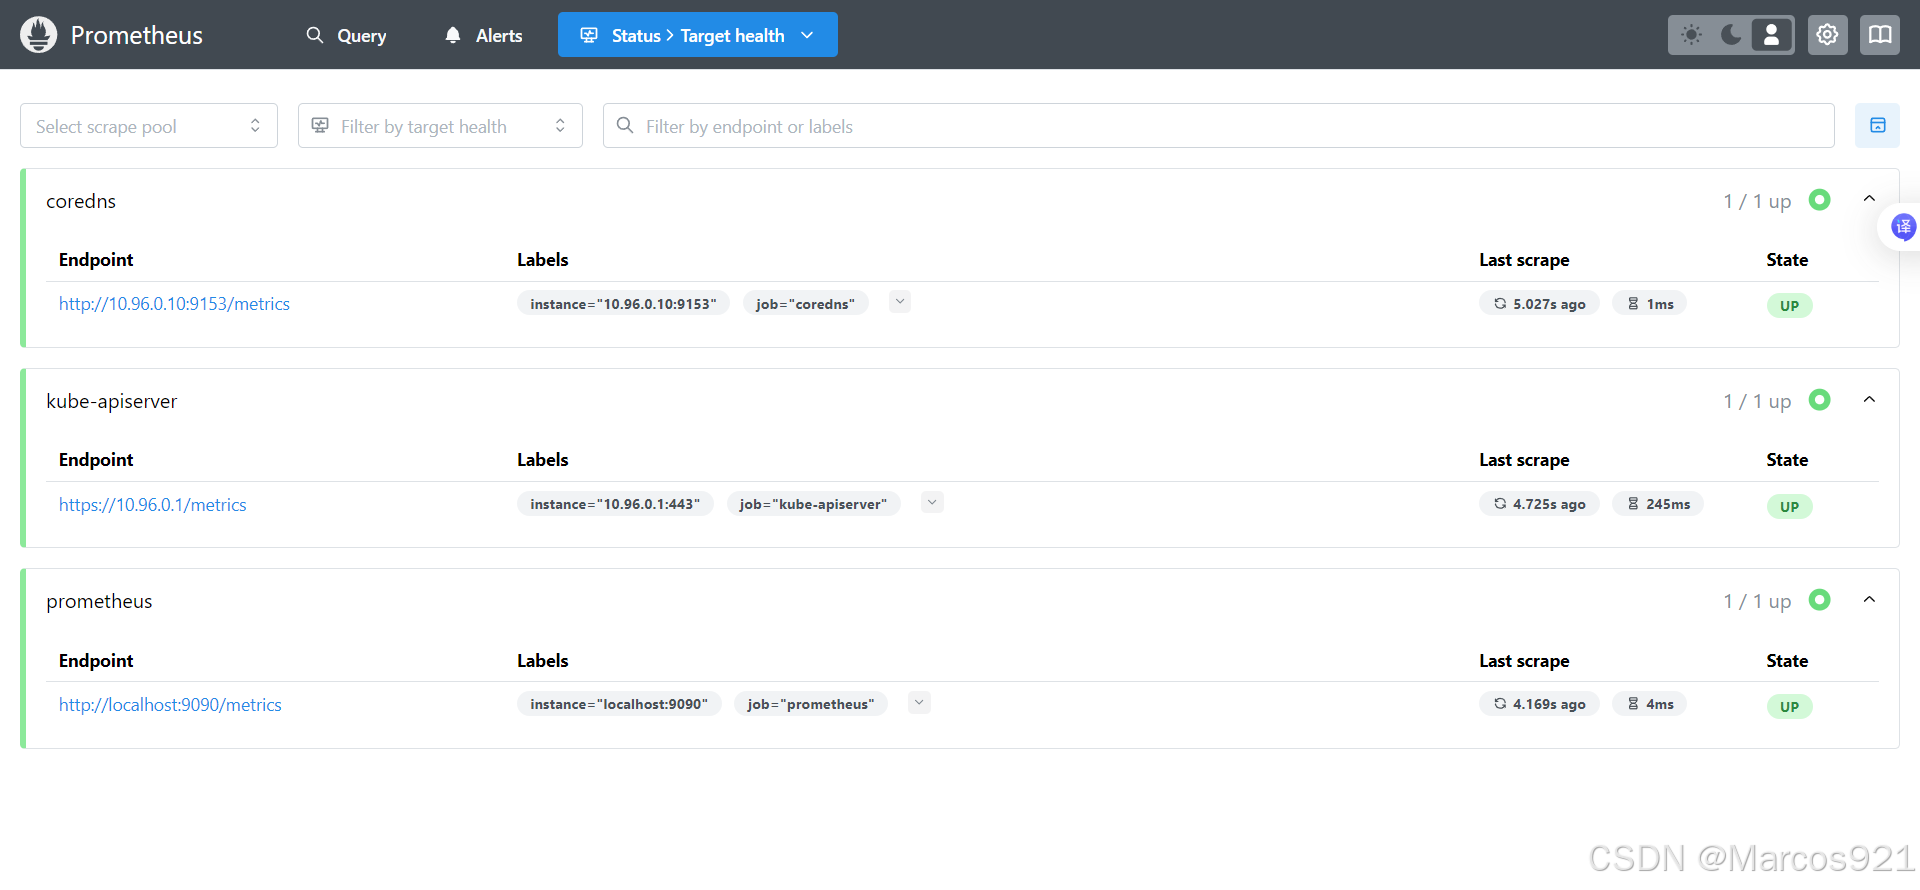
重新访问prometheus web界面,可以看到coredns和kube-apiserver都已经被监控上了
六、prometheus监控node
我们使用node-exporter来监控node的指标
创建node-exporter的daemonset,在每个node上部署node-exporter,收集指标
apiVersion: apps/v1
kind: DaemonSet
metadata:
  name: node-exporter
  namespace: monitor
  labels:
    app: node-exporter
spec:
  selector:
    matchLabels:
      app: node-exporter
  template:
    metadata:
      labels:
        app: node-exporter
    spec:
      hostPID: true
      hostIPC: true
      hostNetwork: true
      nodeSelector:
        kubernetes.io/os: linux
      containers:
      - name: node-exporter
        image: 192.168.119.150/k8s_repository/node-exporter:1.8.2
        args:
        - --web.listen-address=$(HOSTIP):9100
        - --path.procfs=/host/proc
        - --path.sysfs=/host/sys
        - --path.rootfs=/host/root
        - --collector.filesystem.ignored-mount-points=^/(dev|proc|sys|var/lib/docker/.+)($|/)
        - --collector.filesystem.ignored-fs-types=^(autofs|binfmt_misc|cgroup|configfs|debugfs|devpts|devtmpfs|fusectl|hugetlbfs|mqueue|overlay|proc|procfs|pstore|rpc_pipefs|securityfs|sysfs|tracefs)$
        ports:
        - containerPort: 9100
        env:
        - name: HOSTIP
          valueFrom:
            fieldRef:
              fieldPath: status.hostIP
        resources:
          requests:
            cpu: 150m
            memory: 180Mi
          limits:
            cpu: 150m
            memory: 180Mi
        securityContext:
          runAsNonRoot: true
          runAsUser: 65534
        volumeMounts:
        - name: proc
          mountPath: /host/proc
        - name: sys
          mountPath: /host/sys
        - name: root
          mountPath: /host/root
          mountPropagation: HostToContainer
          readOnly: true
      tolerations:
      - operator: "Exists"
      volumes:
      - name: proc
        hostPath:
          path: /proc
      - name: dev
        hostPath:
          path: /dev
      - name: sys
        hostPath:
          path: /sys
      - name: root
        hostPath:
          path: /
我们需要先知道prometheus抓取数据的流程,prometheus抓取数据的流程如下:
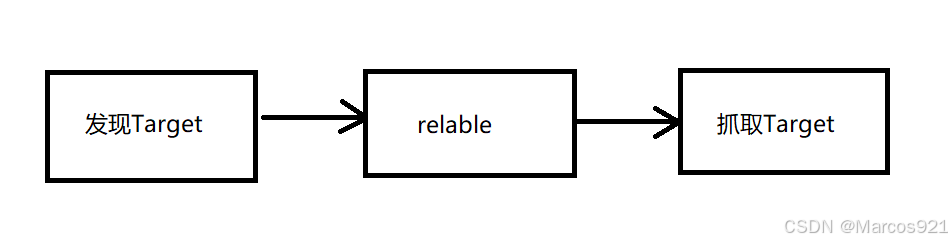
在抓取Target数据之前,我们会有发现Target和relabel这两个步骤,在发现Target之后,我们有可能想要对发现的Target进行修改,这时我们就可以用relabel来修改发现的Target
修改prometheus的configmap,修改配置文件,在配置文件加入下面三行,做node-exporter的自动发现
- job_name: 'node-exporter'
  kubernetes_sd_configs:
    - role: node
重新加载prometheus后,发现node-exporter已经被自动发现了,但是没处于up状态。这是因为自动发现的endpoint的端口不对,我们需要继续修改配置文件,通过prometheus的relabel机制修改监控的端口
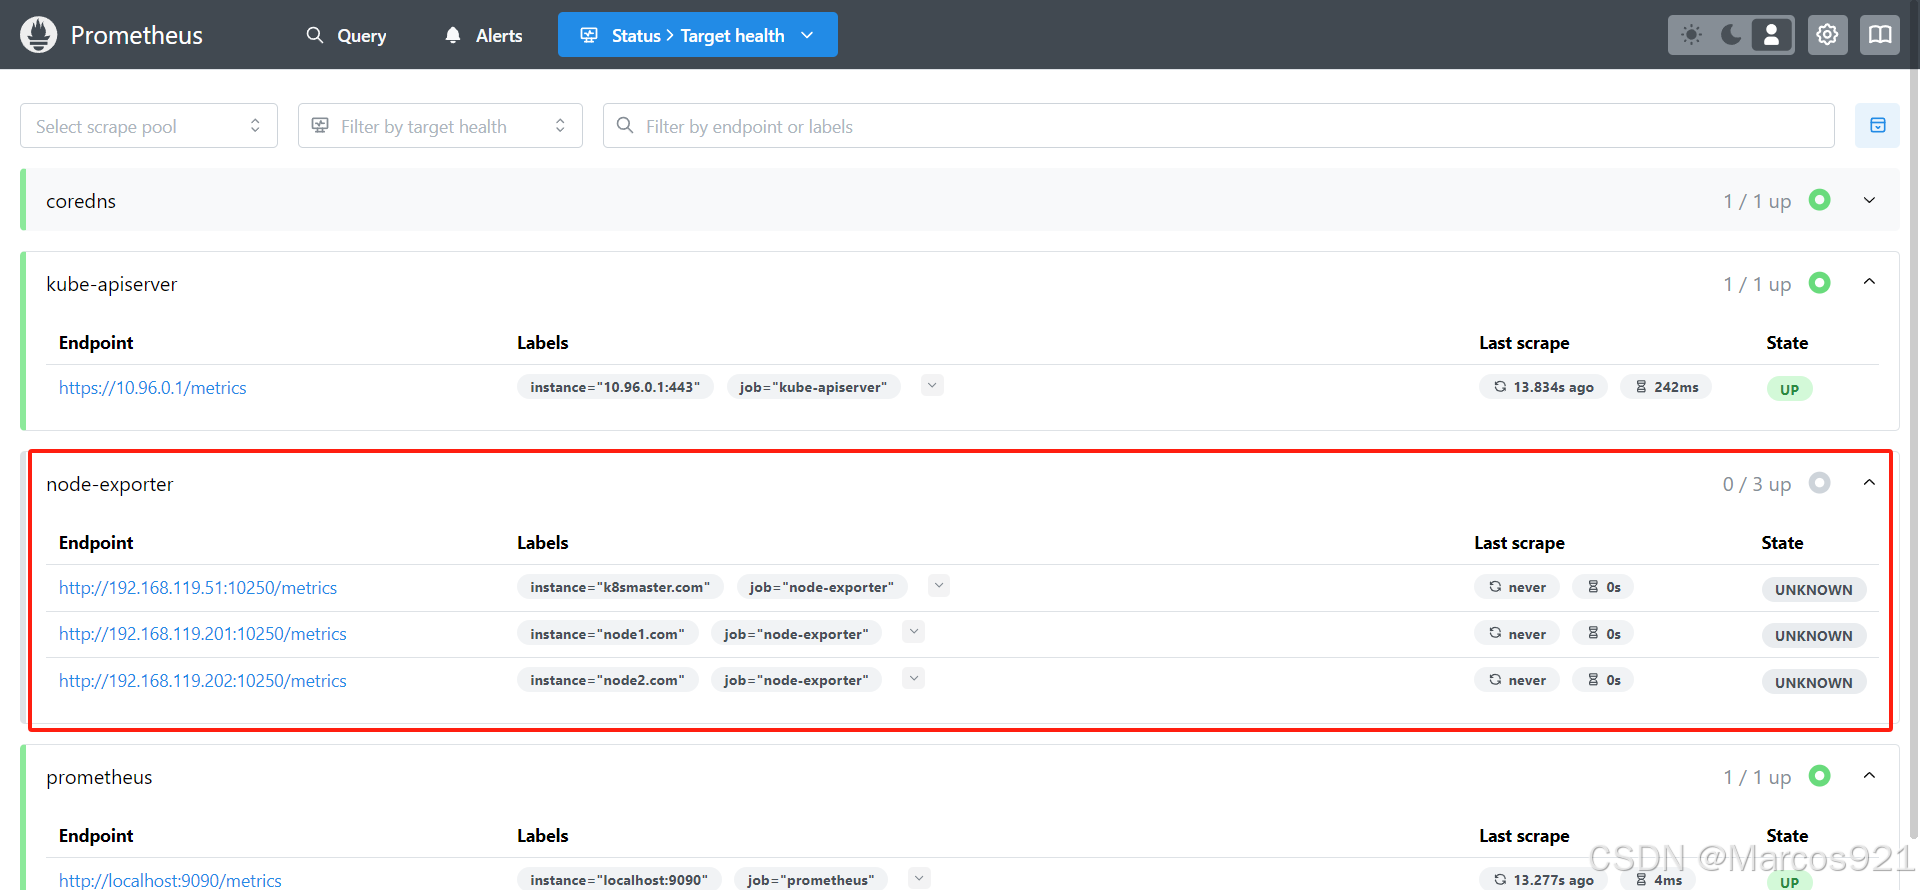
在prometheus的配置文件中增加relabel_config配置
    - job_name: 'node-exporter'
      kubernetes_sd_configs:
        - role: node
      relabel_configs:
      - source_labels: [__address__]
        regex: '(.*):10250'
        replacement: '${1}:9100'
        target_label: __address__
        action: replace
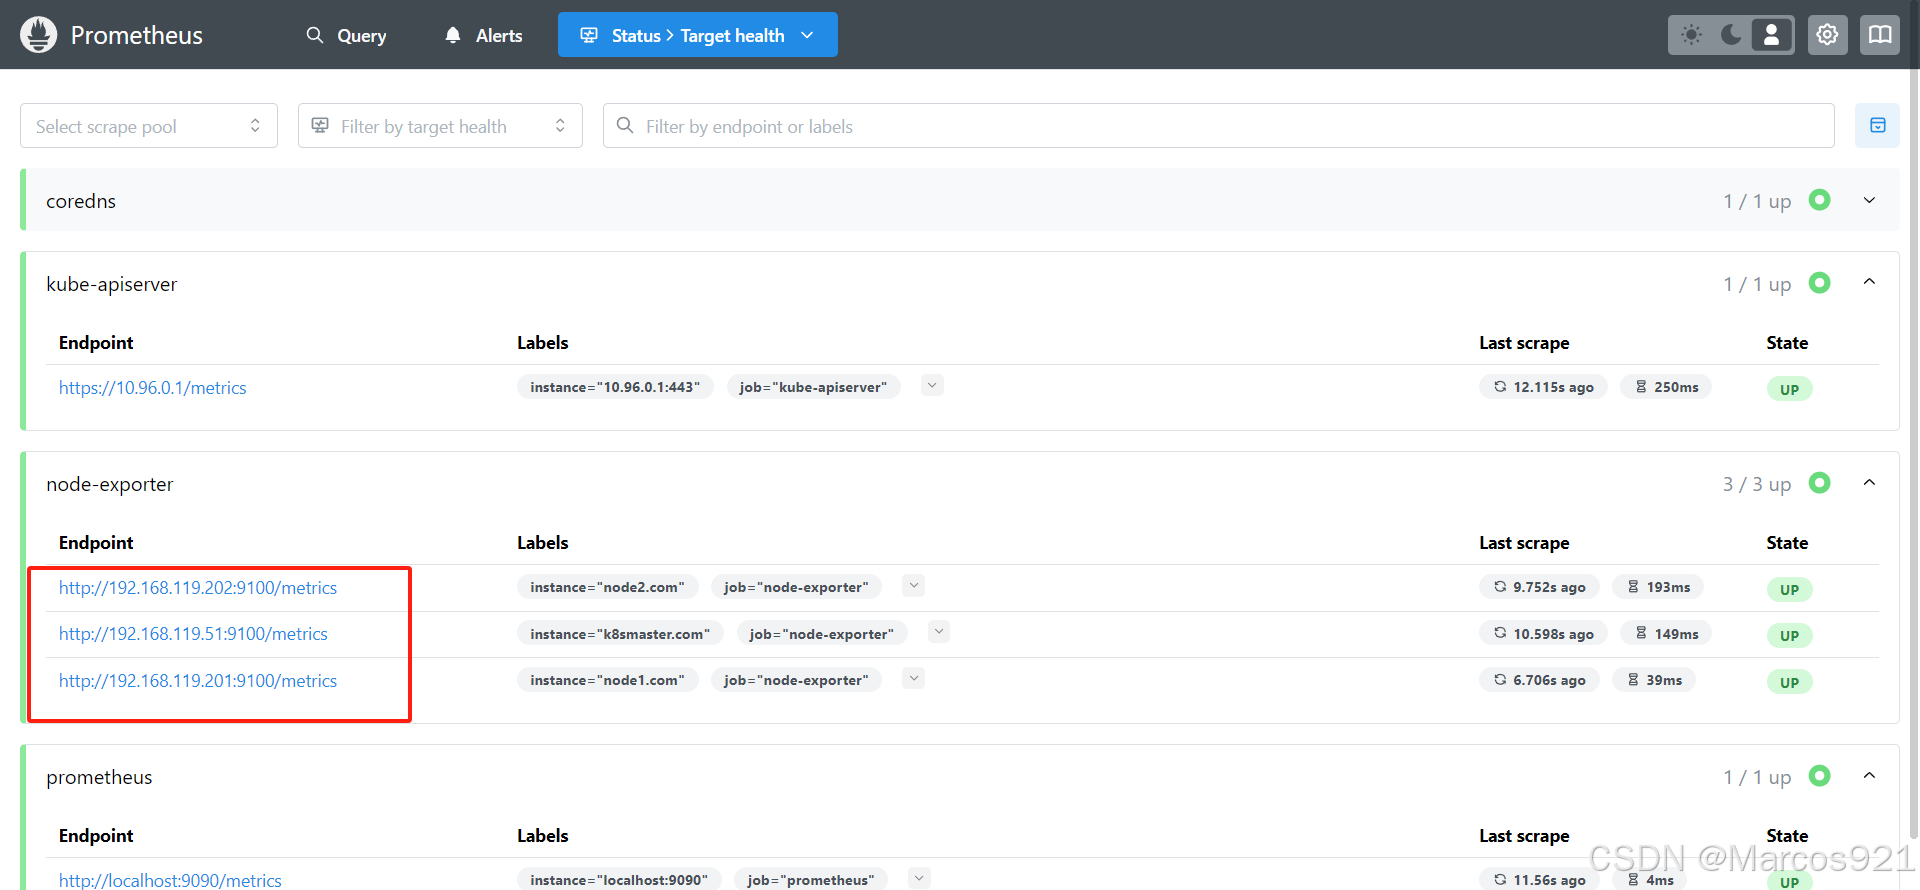
可以看到,通过relabel,我们已经将10250端口改为了9100端口,node-exporter也变为了up状态
七、prometheus监控pod
pod级别的监控,我们由cadvisor实现
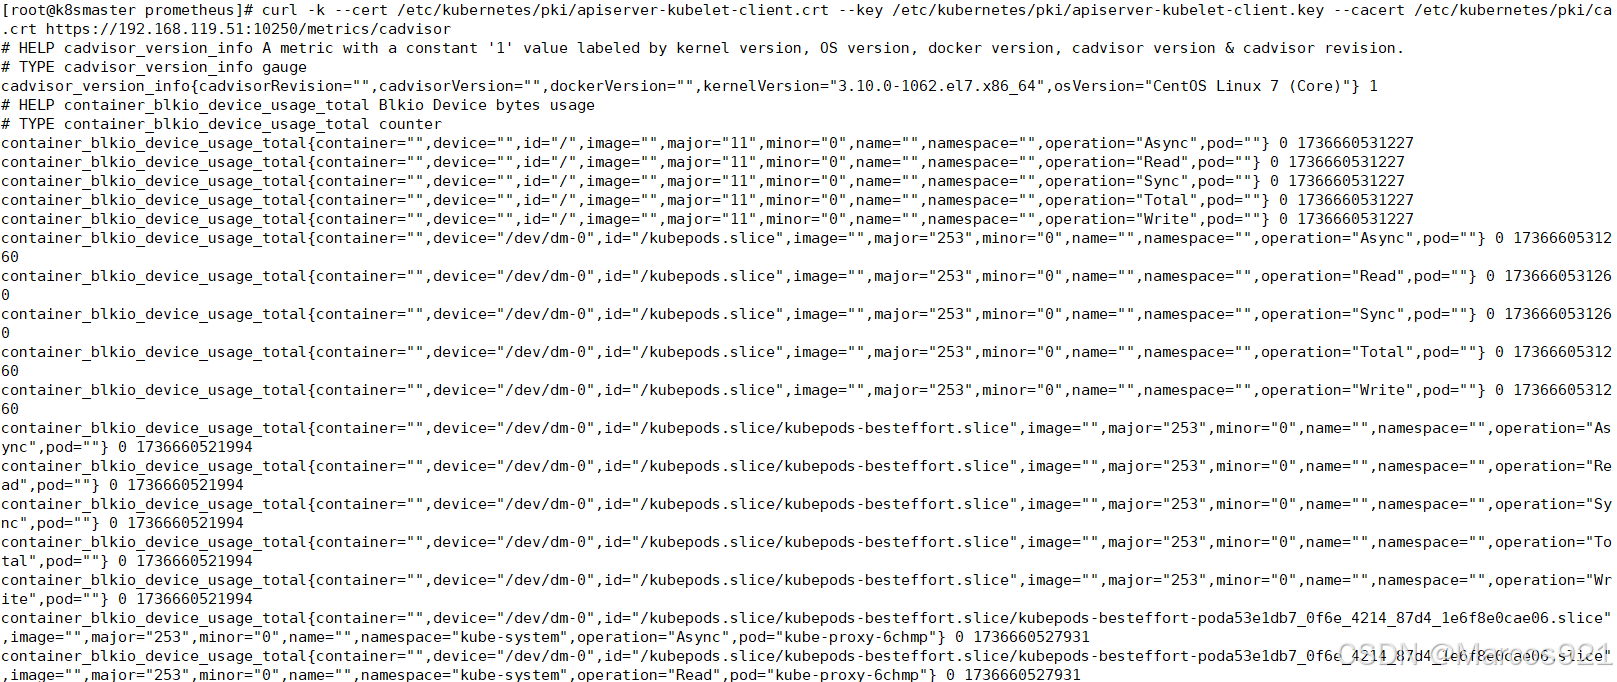
通过curl {nodeIP}:10250/metrics/cadvisor , 访问pod级别的指标
curl -k --cert /etc/kubernetes/pki/apiserver-kubelet-client.crt --key /etc/kubernetes/pki/apiserver-kubelet-client.key --cacert /etc/kubernetes/pki/ca.crt https://{nodeIP}:10250/metrics/cadvisor
在prometheus的configmap中新增如下配置,并apply configmap
- job_name: 'cadvisor'
  kubernetes_sd_configs:
    - role: node
  scheme: https
  tls_config:
    insecure_skip_verify: true
    ca_file: '/var/run/secrets/kubernetes.io/serviceaccount/ca.crt'
  bearer_token_file: '/var/run/secrets/kubernetes.io/serviceaccount/token'
  relabel_configs:
  - target_label: __metrics_path__
    replacement: /metrics/cadvisor
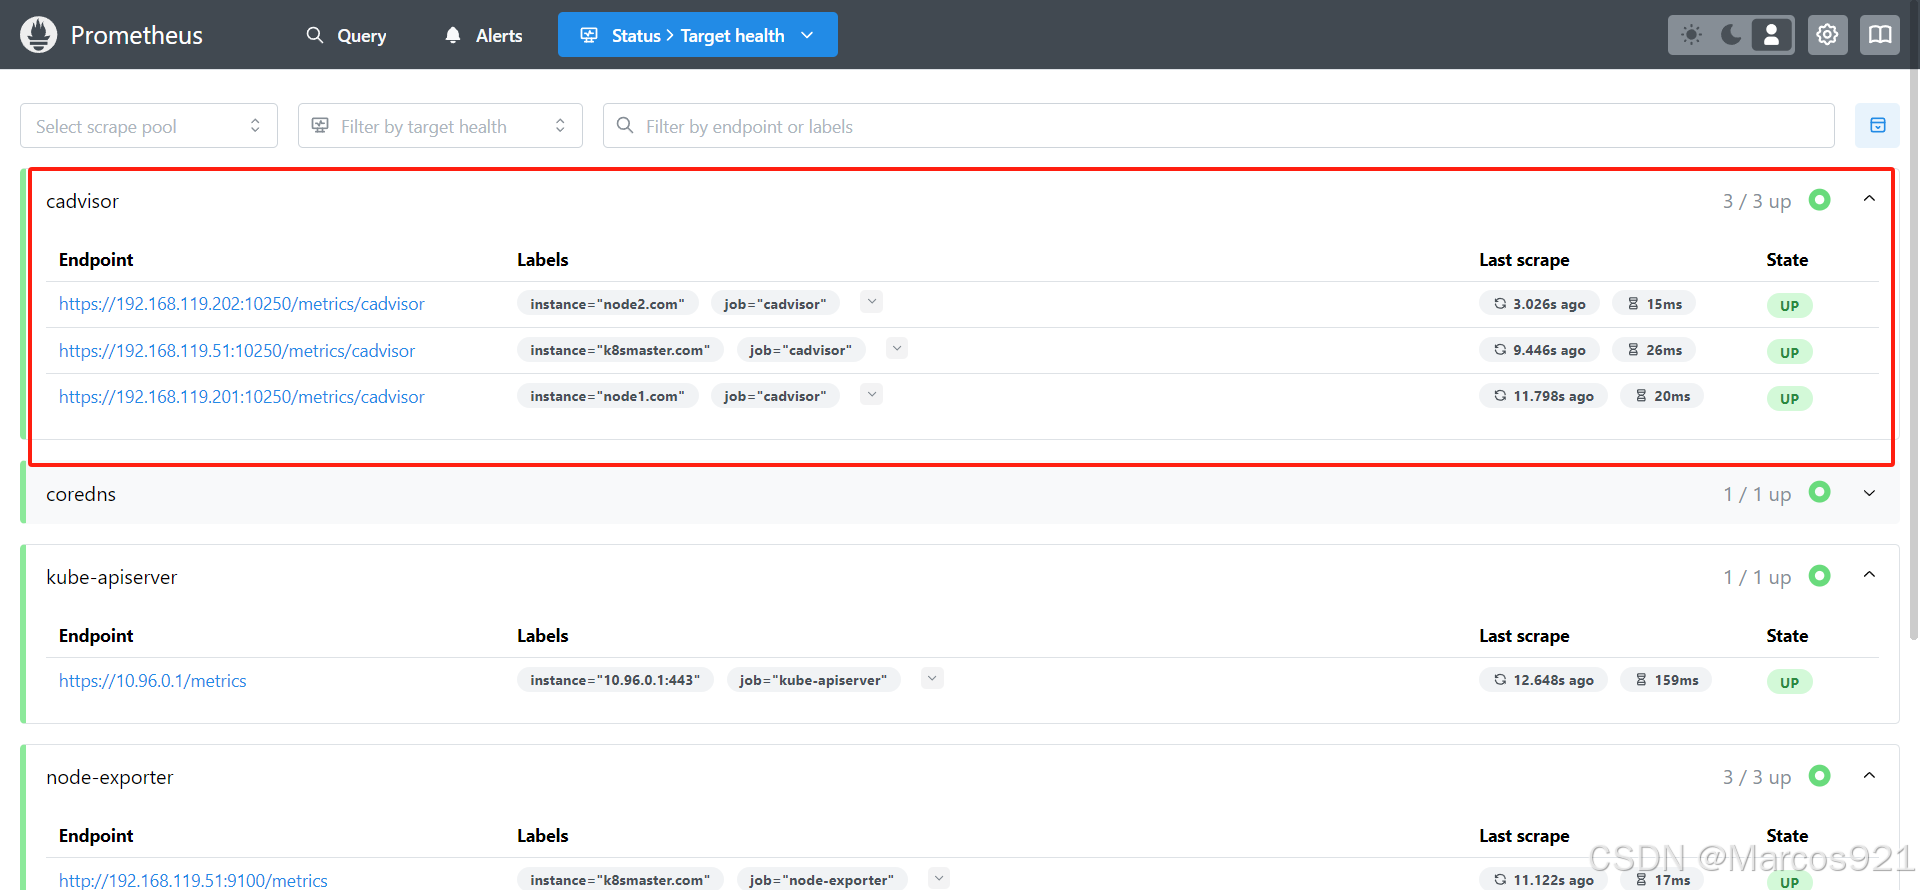
reload prometheus后,发现cadvisor也已经被监控上了


 263
263

 被折叠的 条评论
为什么被折叠?
被折叠的 条评论
为什么被折叠?
 到【灌水乐园】发言


