


from pylab import *
from numpy import *
import matplotlib.pyplot as plt

x = linspace(-10,10,5)
y = x ** 2

x2 = linspace(-20,20,100)
y2 = x2 ** 2

figure()
plot(x,y,'r')
plot(x2,y2,'b')
xlabel('x')
ylabel('y')
title('title')
plt.show()
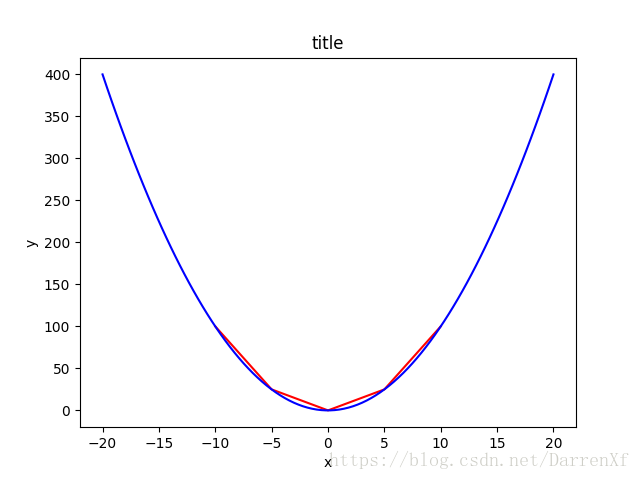
 本文介绍如何使用Python的Matplotlib库绘制二次函数图像。通过设置不同的数据点数量展示图像的细节变化,并对比不同分辨率下图像的区别。
from pylab import *
from numpy import *
import matplotlib.pyplot as plt
x = linspace(-10,10,5)
y = x ** 2
x2 = linspace(-20,20,100)
y2 = x2 ** 2
figure()
plot(x,y,'r')
plot(x2,y2,'b')
xlabel('x')
ylabel('y')
title('title')
plt.show()
 5672
5672

 被折叠的 条评论
为什么被折叠?
被折叠的 条评论
为什么被折叠?
 到【灌水乐园】发言


