


 博客介绍了基于已知类别和预测得分的数据处理流程。先对数据按得分排序,以得分各值为阈值计算精确率和召回率,还涉及生成假数据,假数据中 score 大于 0.5 时,label 以 70% 取‘t’,最后进行绘图。
流程
- 一组数据,已知类别和预测得分,按得分排序
- 将得分的各个值作为阈值,计算精确率和召回率
- 绘制图像
生成假数据
数据:label,score
假数据中 score大于0.5,则label以70%取‘t’,以此类推
import random

data = []
for i in range(200):
    score = random.random()
    if score > 0.5:
        if random.random() > 0.3:
            label = 't'
        else:
            label = 'f'
    else:
        if random.random() > 0.7:
            label = 't'
        else:
            label = 'f'
    data.append([label, score])

data.sort(key=lambda x:x[1])
for label, score in data:
    print(f'label: {label}, score: {score:.2f}')

################ print ####################
label: f, score: 0.09
label: t, score: 0.14
label: t, score: 0.15
label: f, score: 0.23
label: f, score: 0.28
label: f, score: 0.32
label: f, score: 0.37
label: t, score: 0.40
label: t, score: 0.46
label: f, score: 0.48
label: f, score: 0.50
label: t, score: 0.68
label: t, score: 0.70
label: t, score: 0.73
label: f, score: 0.75
label: t, score: 0.78
label: f, score: 0.84
label: f, score: 0.85
label: t, score: 0.89
label: t, score: 0.90

进程已结束,退出代码0
PR计算
def pr_eavl(data, score):
    data.sort()
    tp = len([i for i in data if i[0]=='t' and i[1]>score])
    fp = len([i for i in data if i[0]=='f' and i[1]>score])
    tn = len([i for i in data if i[0]=='f' and i[1]<score])
    fn = len([i for i in data if i[0]=='t' and i[1]<score])

    p = tp / (tp + fp)
    r = tp / (tp + fn)

    return p, r
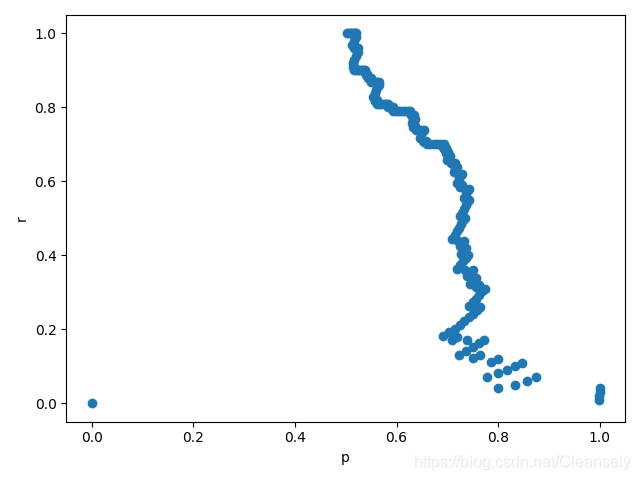
绘图
from matplotlib import pyplot as plt

p_list = []
r_list = []
for i in data:
    p, r = pr_eavl(data, i[1])
    p_list.append(p)
    r_list.append(r)

plt.scatter(p_list, r_list)
plt.xlabel('p')
plt.ylabel('r')
plt.show()


 6134
6134

 被折叠的 条评论
为什么被折叠?
被折叠的 条评论
为什么被折叠?
 到【灌水乐园】发言


