


1.通过官方示例了解使用beyla
官方文档原文链接:Grafana Beyla | Grafana Beyla documentation
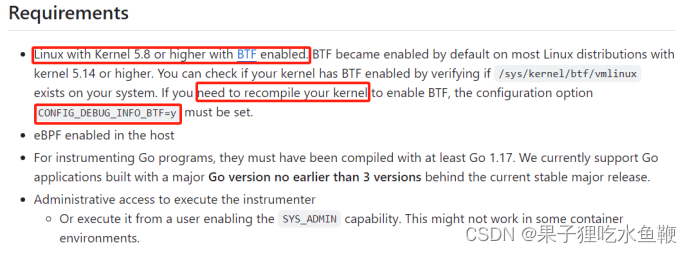
根据官方文档要求内核至少升级至5.8以上并开启BTF重新编译,5.14以上内核版本默认开启BTF。
1.1环境准备
Centos 7.9 内核版本 默认:3.10 2C 2G
Centos 7.9 内核版本 默认:3.10 1C 2G
1.2编译内核启动beyla(失败案例,希望指导)
1.2.1内核编译工具准备(编译5以上版本内核至少需要devtoolset-5的编译工具包)
Centos 7.9 系统下载 5.14版本内核,进入内核编译页面查看配置项。
#可通过centos-release-scl源安装devtoolset包
yum install centos-release-scl

#devtoolset对应gcc的版本
devtoolset-9对应gcc9.x.x版本

#下载并安装gcc
yum install devtoolset-9

#添加源
vi /etc/yum.repos.d/CentOS-SCLo-scl.repo

#直接把下面这段覆盖[centos-sclo-sclo]
[centos-sclo-sclo]
name=CentOS-7 - SCLo sclo
baseurl=http://mirror.centos.org/centos/7/sclo/$basearch/rh/
#mirrorlist=http://mirrorlist.centos.org?arch=$basearch&release=7&repo=sclo-sclo
gpgcheck=1
enabled=1
gpgkey=file:///etc/pki/rpm-gpg/RPM-GPG-KEY-CentOS-SIG-SCLo

#激活gcc版本
scl enable devtoolset-9 bash

#下载ncurses库的支持(若在进入内核编译页面出现报错,可能因为其它工具缺失,使用以下命令尝试)
sudo yum install ncurses-devel

#下载词法分析器生成器
sudo yum install flex

#下载Bison词法分析器
sudo yum install bison
1.2.2重新编译内核(以下为5.14示例)
#下载指定版本内核
wget https://mirrors.aliyun.com/linux-kernel/v5.x/linux-5.14.tar.xz
#解压
tar -xJf linux-5.14.tar.xz
#进入目录
cd linux-5.14
#生成内核配置文件.config
make mrproper
cp -v /boot/config-$(uname -r) .config
#进入Linux内核配置界面
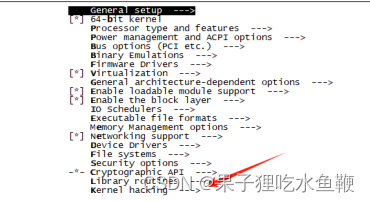
make menuconfig
第一步
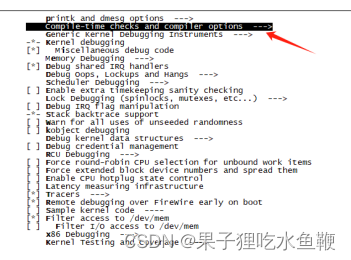
第二步
第三步
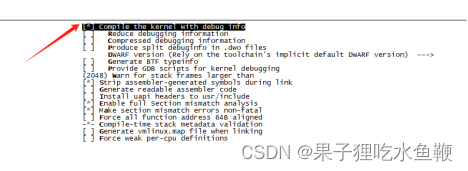
官方文档给出的配置项是CONFIG_DEBUG_INFO_BTF,但是内核编辑页面只有Compile the kernel with debug info (NEW)这个配置是类似的
在配置界面中找到 Kernel hacking -> Compile-time checks and compiler options,勾选 Compile the kernel with debug info (NEW) (CONFIG_DEBUG_INFO_BTF)
清理构建过程中生成的临时文件和目标文件
make clean
使用所有可用的核心加速编译(2C2G机器大概需要3-4小时编译,且使用5.14重新编译后的内核,主机无法启动)
make -j $(nproc)
安装新编译的内核和模块
sudo make modules_install
sudo make install
更新引导加载器配置
sudo mkinitrd -v -f /boot/initramfs-$(uname -r).img $(uname -r)
sudo grub2-mkconfig -o /boot/grub2/grub.cfg
查看内核
awk -F\' '$1=="menuentry " {print i++ " : " $2}' /etc/grub2.cfg
设置新的内核为grub2的默认版本
grub2-set-default 1
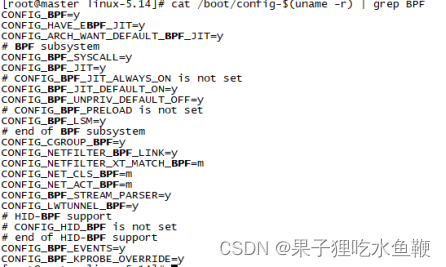
查看当前内核配置
cat /boot/config-$(uname -r) | grep BPF
cat /boot/config-$(uname -r) | grep BTF
官方文档声明的5.14版本以上内核默认开启BTF配置,后续在尝试安装5.15版本内核后查看内核配置,并没有开启BTF的配置。
执行cat /boot/config-$(uname -r) | grep BTF命令后CONFIG_DEBUG_INFO_BTF=y此项配置是被注释的。关于bpf的配置倒是都支持的。
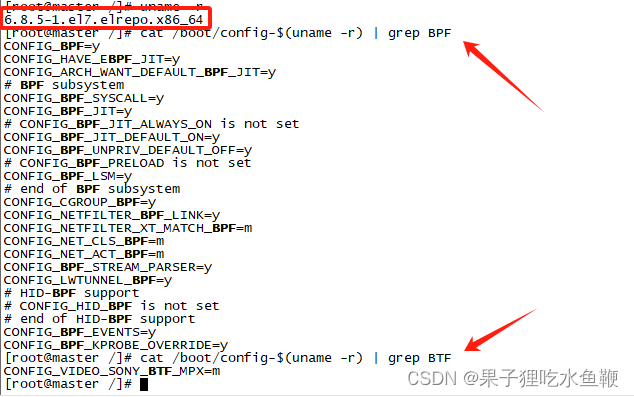
开启Compile the kernel with debug info并重新编译5.15版本内核后,同样遇到主机无法启动的问题。故而选择6.8.5版本内核。

6.8.5版本在安装并启用后查看内核配置文件,并无CONFIG_DEBUG_INFO_BTF此项配置,且内核目录中没有BTF目录。
1.2.3其它问题
(1).centos 7.9 使用默认3.10内核,部署k8s集群后,升级5.15/6.8内核,1.20版本的k8s服务无法启动(解决办法:先升级内核再部署)
(2).centos 7.9 6.8版本内核安装完成后 1.23版本的k8s服务启动正常,集群初始化失败。(解决办法:使用v1.28.0版本k8s安装初始化无异常)
(3).在centos7.9系统上使用 6.8.5版本内核,成功部署k8s集群后,根据官方示例,部署beyla出现报错

出现不支持BTF报错,但是在主机中查看内核配置项,没有出现BTF相关配置,对BPF也是支持的。
2.使用ubuntu系统尝试使用beyla
2.1环境准备
Ubuntu 22.04.2 内核版本 默认:5.15.0-76-generic 2C 2G
Ubuntu 22.04.2 内核版本 默认:5.15.0-76-generic 1C 2G
k8s一主一从集群搭建可以参考我的另一个博客:基于ubuntu 22.04 安装k8s一主一从集群(包括dashboard)-优快云博客
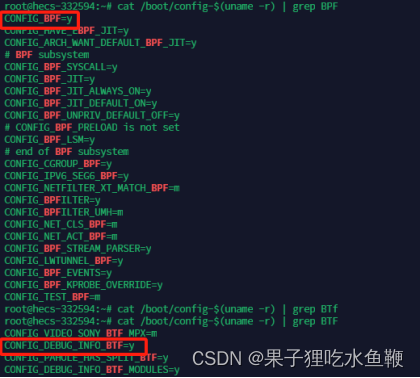
查看内核配置项---支持bpf且BTF是默认开启的
2.2按照官方示例部署使用
2.2.1部署准备
*参考官方示例中,准备grafana cloud空间并生成otel令牌作为beyla采集数据流向的端点。
*k8s版本为1.28。
*根据官方文档在集群启动两个轻量级的go服务。
2.2.1.1grafana cloud 注册获取14天免费空间,生成凭据。
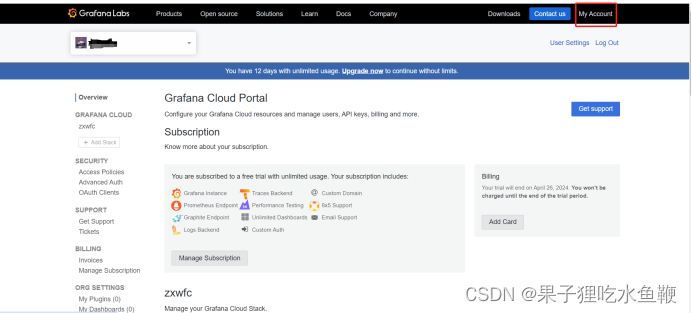
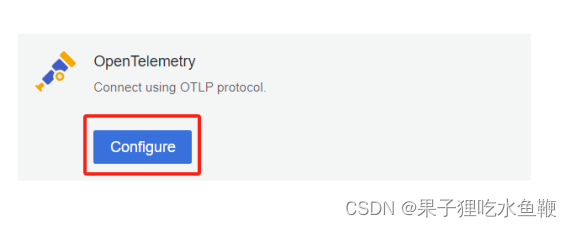
2.2.1.2找到OpenTelemetry点击configure
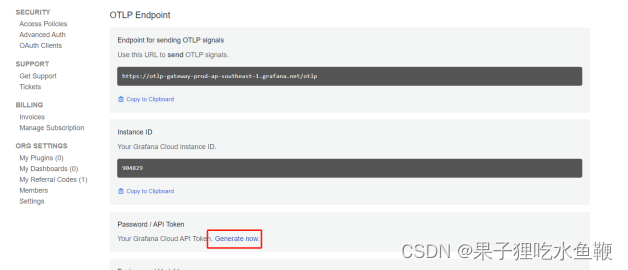
2.2.1.3生成API令牌
2.2.2部署beyla并测试
2.2.2.1k8s集群上部署beyla
官方示例:Beyla and Kubernetes walkthrough | Grafana Beyla documentation
两个go语言的demo:
kind: Deployment
apiVersion: apps/v1
metadata:
  name: docs
spec:
  replicas: 2
  selector:
    matchLabels:
      app: docs
  template:
    metadata:
      labels:
        app: docs
    spec:
      containers:
        - name: docs-server
          image: httpd:latest
          ports:
            - containerPort: 80
              protocol: TCP
              name: http
---
apiVersion: v1
kind: Service
metadata:
  name: docs
spec:
  selector:
    app: docs
  ports:
    - protocol: TCP
      port: 80
---
kind: Deployment
apiVersion: apps/v1
metadata:
  name: website
spec:
  replicas: 2
  selector:
    matchLabels:
      app: website
  template:
    metadata:
      labels:
        app: website
    spec:
      containers:
        - name: website-server
          image: httpd:latest
          ports:
            - containerPort: 80
              protocol: TCP
              name: http
---
apiVersion: v1
kind: Service
metadata:
  name: website
spec:
  selector:
    app: website
  ports:
    - protocol: TCP
      port: 80
beyla部署的yaml:
# 新建命名空间
apiVersion: v1
kind: Namespace
metadata:
  name: beyla
  labels:
    purpose: development

#设置beyla数据流向的端点
ApiVersion: v1
kind: Secret
metadata:
  namespace: beyla
  name: grafana-credentials
type: Opaque
stringData:
  #grafana cloud的免费端点
  otlp-endpoint: "https://otlp-gateway-prod-eu-west-0.grafana.net/otlp"
  #上面生成的令牌
  otlp-headers: "Authorization=Basic ...rest of the secret header value..."

***********************************
#创建账户绑定权限等yaml省略(官网上有)
***********************************
#注:官网示例中对ClusterRole设置的权限过少,建议使用*来代替,否则beyla启动会没有权限操作
#后续示例中有写好的

#beyla启动的配置文件
apiVersion: v1
kind: ConfigMap
metadata:
  namespace: beyla
  name: beyla-config
data:
  beyla-config.yml: |
    # this is required to enable kubernetes discovery and metadata
    attributes:
      kubernetes:
        enable: true
    # this will provide automatic routes report while minimizing cardinality
    routes:
      unmatched: heuristic
    # let's instrument only the docs server
    discovery:
      services:
        - k8s_deployment_name: "^docs$" #需要监控的服务名称
        - k8s_deployment_name: "^website$" #需要监控的服务名称

#以守护进程的方式在每个节点都安装beyla
apiVersion: apps/v1
kind: DaemonSet
metadata:
  namespace: beyla
  name: beyla
spec:
  selector:
    matchLabels:
      instrumentation: beyla
  template:
    metadata:
      labels:
        instrumentation: beyla
    spec:
      serviceAccountName: beyla
      hostPID: true # mandatory!
      containers:
        - name: beyla
          image: grafana/beyla:1.2
          imagePullPolicy: IfNotPresent
          securityContext:
            privileged: true # mandatory!
            readOnlyRootFilesystem: true
          volumeMounts:
            - mountPath: /config
              name: beyla-config
            - mountPath: /var/run/beyla
              name: var-run-beyla
          env:
            - name: BEYLA_CONFIG_PATH
              value: "/config/beyla-config.yml"
            - name: OTEL_EXPORTER_OTLP_ENDPOINT
              valueFrom:
                secretKeyRef:
                  name: grafana-credentials
                  key: otlp-endpoint
            - name: OTEL_EXPORTER_OTLP_HEADERS
              valueFrom:
                secretKeyRef:
                  name: grafana-credentials
                  key: otlp-headers
      volumes:
        - name: beyla-config
          configMap:
            name: beyla-config
        - name: var-run-beyla
          emptyDir: {}
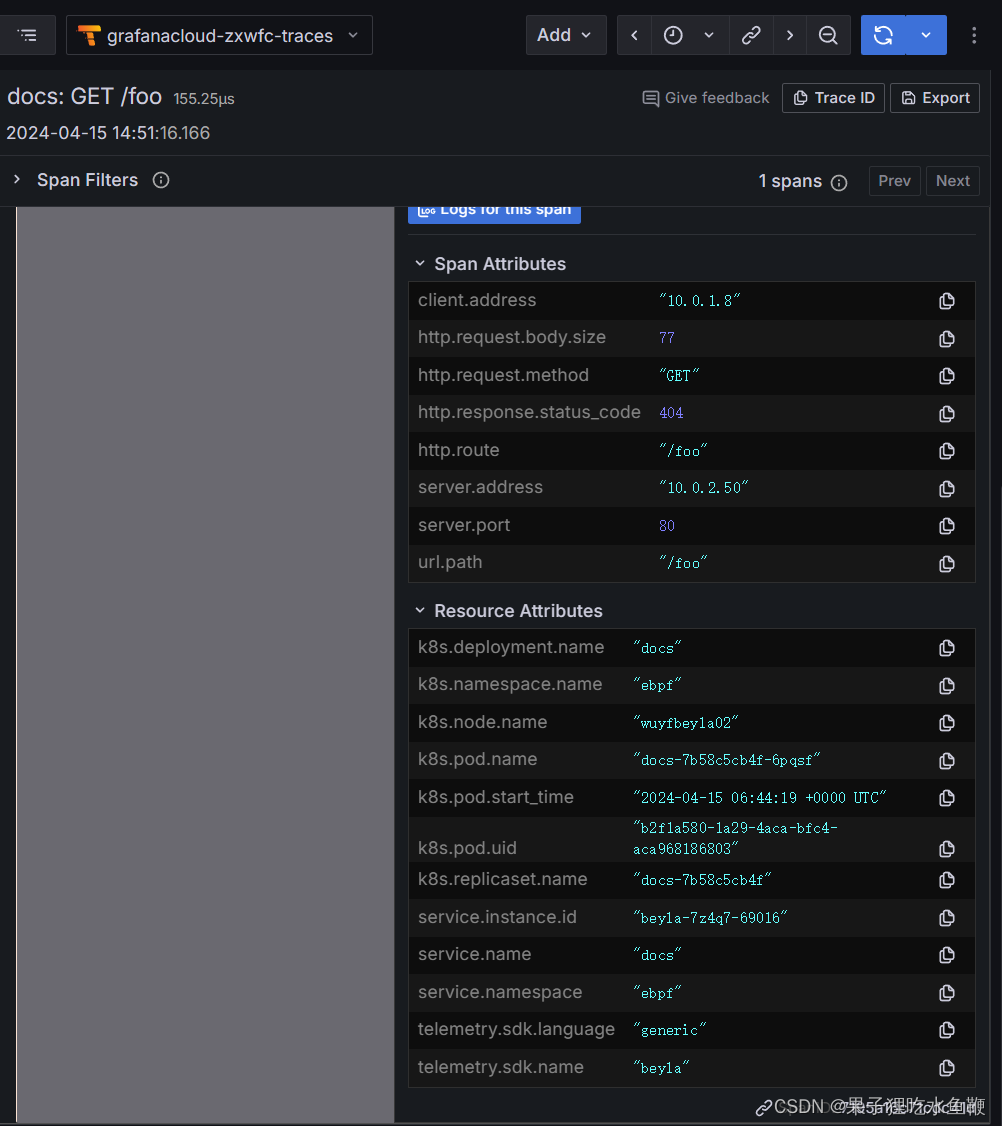
2.2.2.2主机请求被监控的doc服务。
curl http://集群ip:80
curl http://集群ip:80/foo
2.2.2.3进入grafana的仪表盘
tarce数据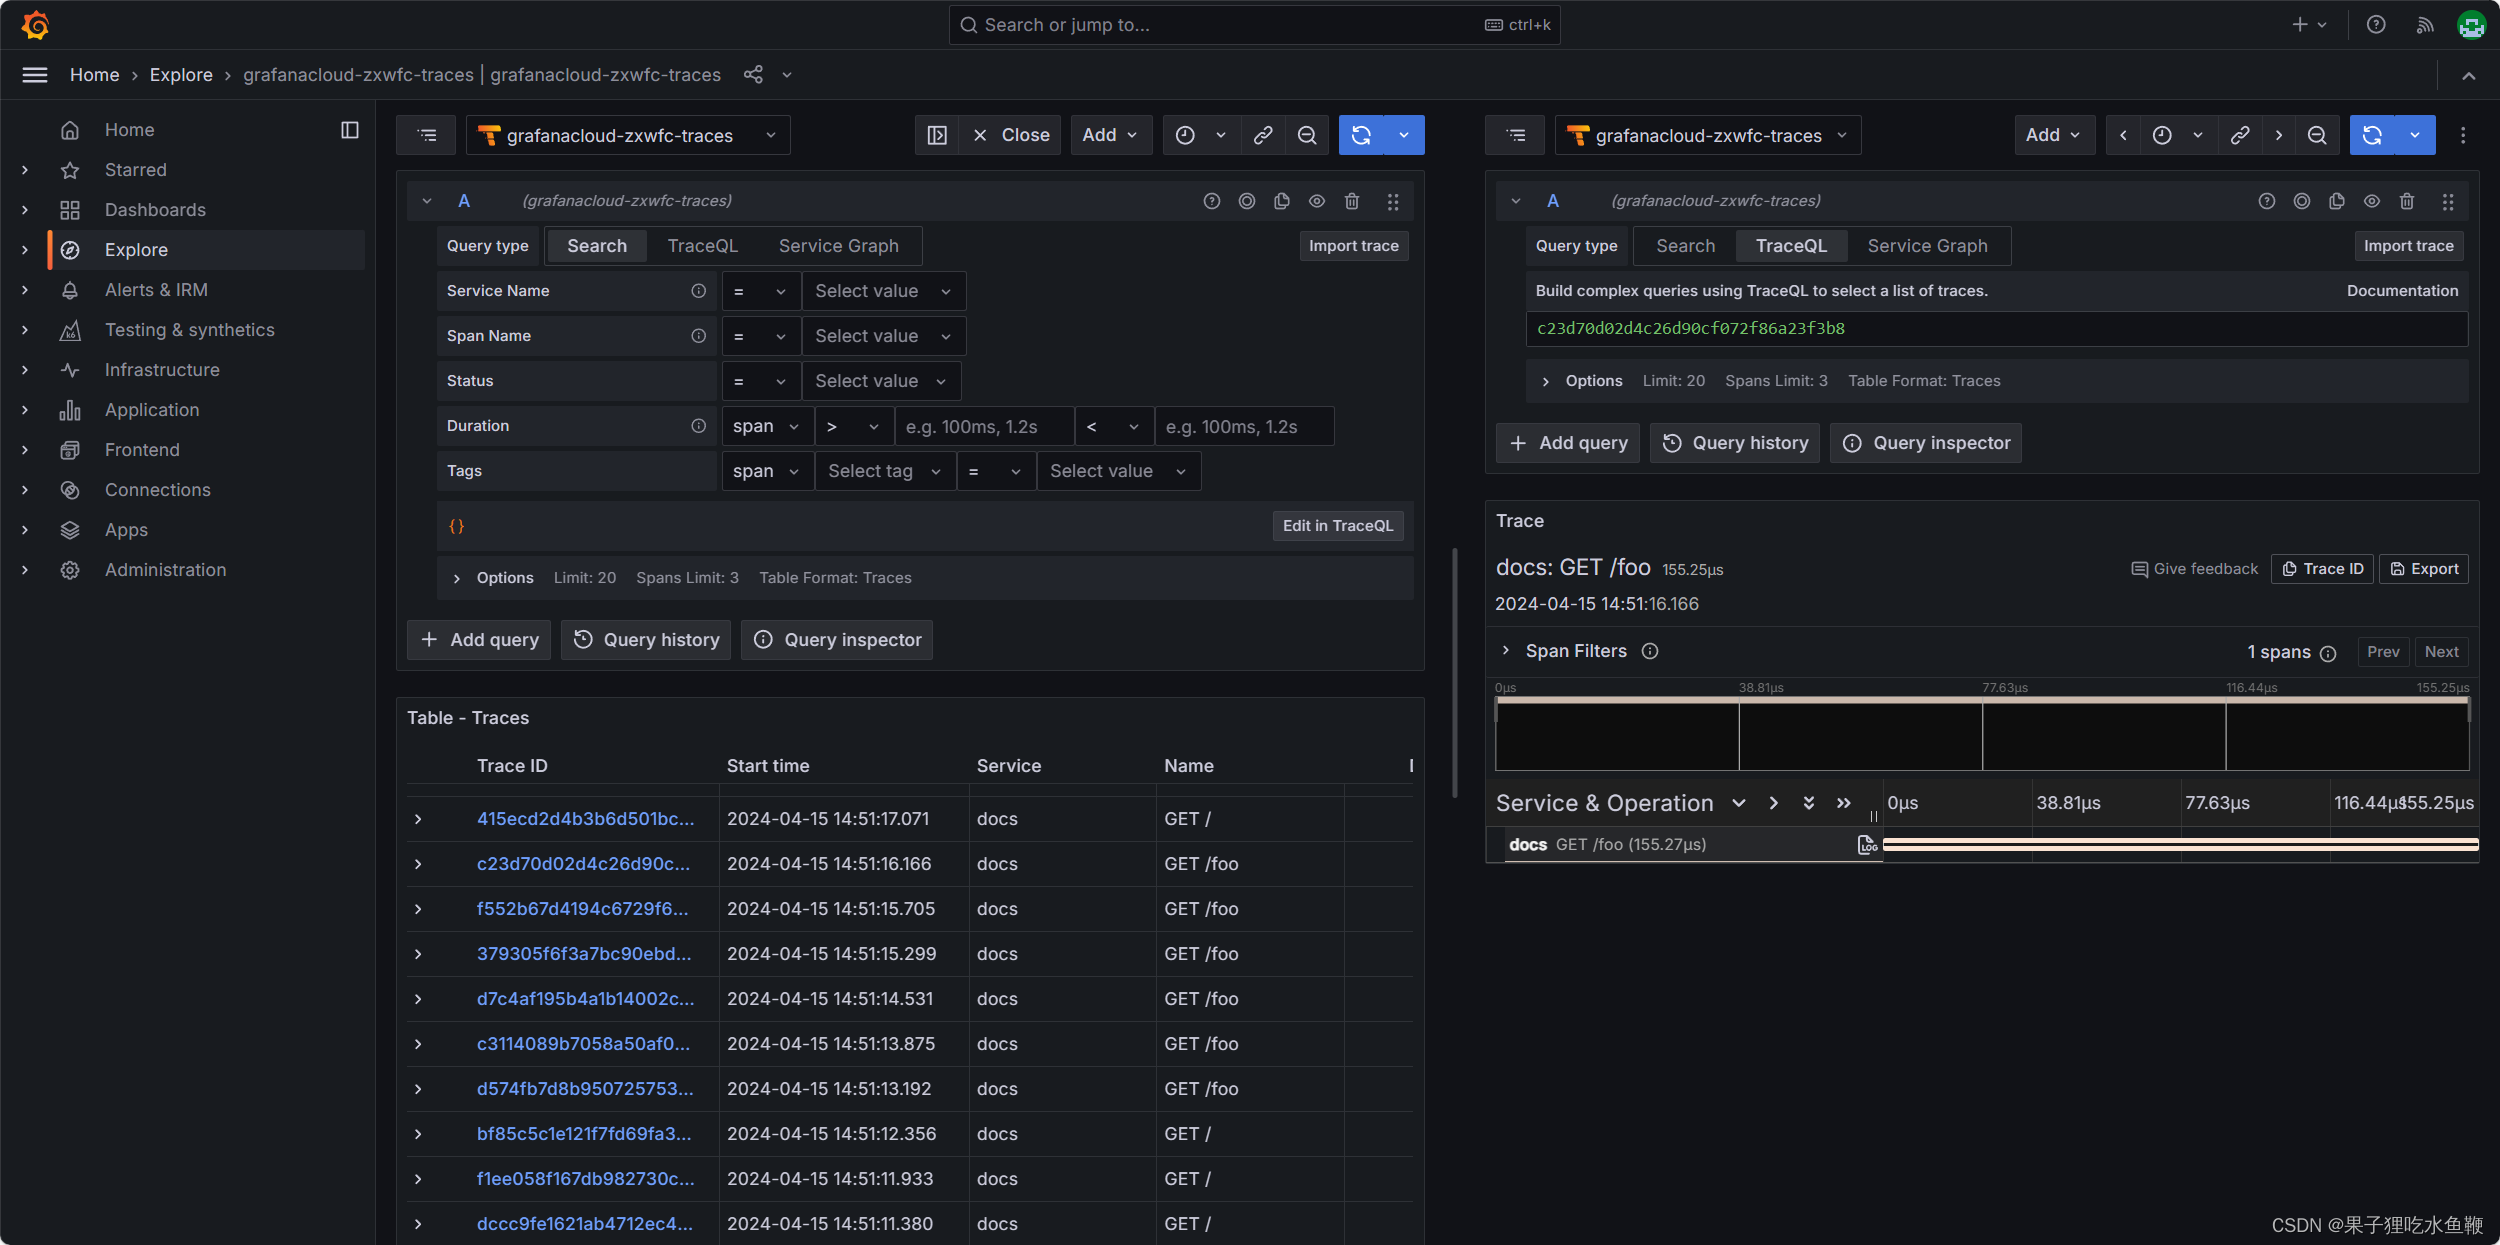
2.2.3 部署一组java的demo查看效果。
调用关系为 客户端 > yun2 > yun > 其他主机的mysql
2.2.3.1更改beyla的配置文件
kind: ConfigMap
apiVersion: v1
metadata:
  name: beyla-config
  namespace: ebpf
data:
  beyla-config.yml: |
    # 这是启用kubernetes发现和元数据所必需的
    attributes:
      kubernetes:
        enable: true
    # 这将提供自动路由报告,同时最小化基数
    routes:
      unmatched: heuristic
    discovery:
      services:
        - k8s_deployment_name: "^yun$" # 服务2
        - k8s_deployment_name: "^yun2$" # 服务1
2.2.3.2采集效果
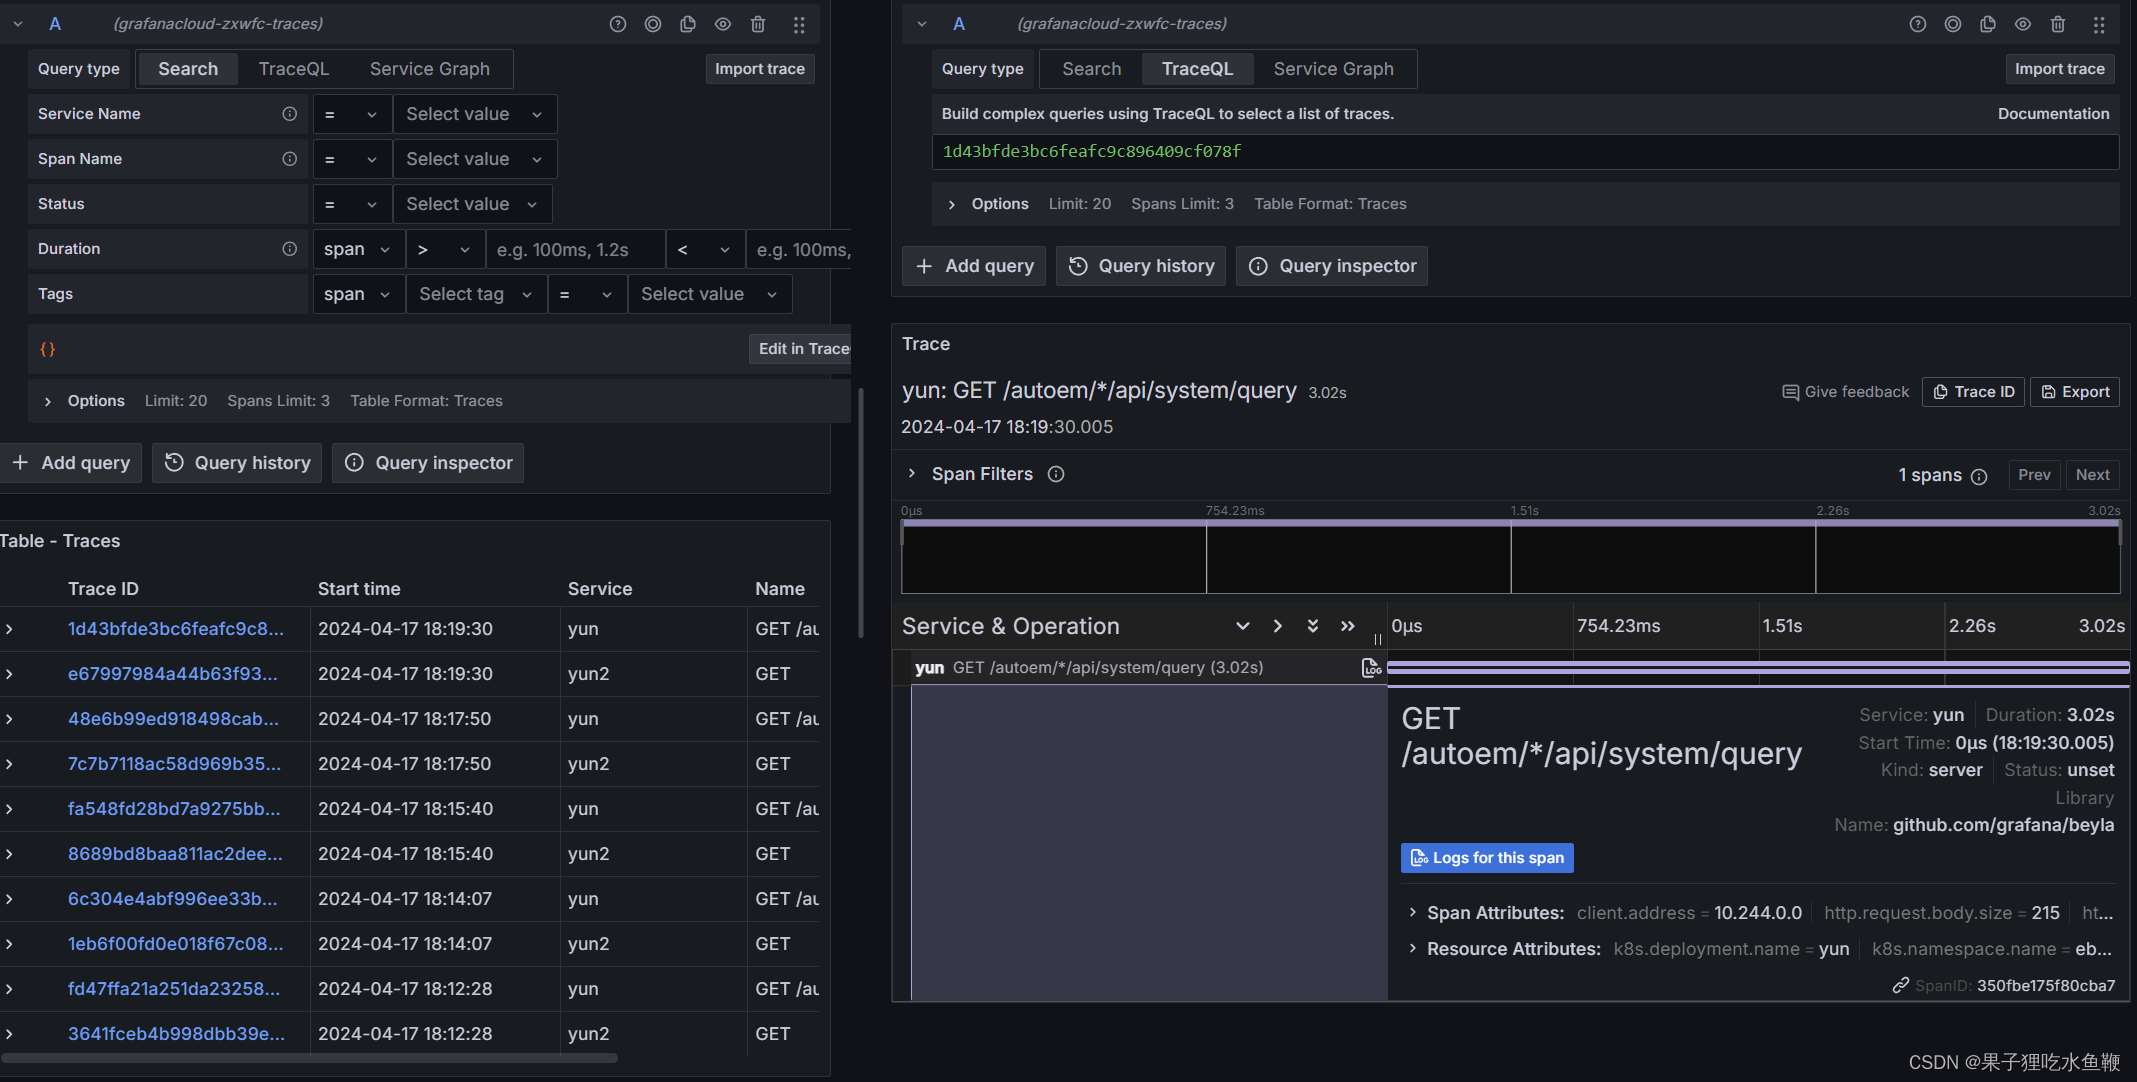
问题:未形成串联
metrics: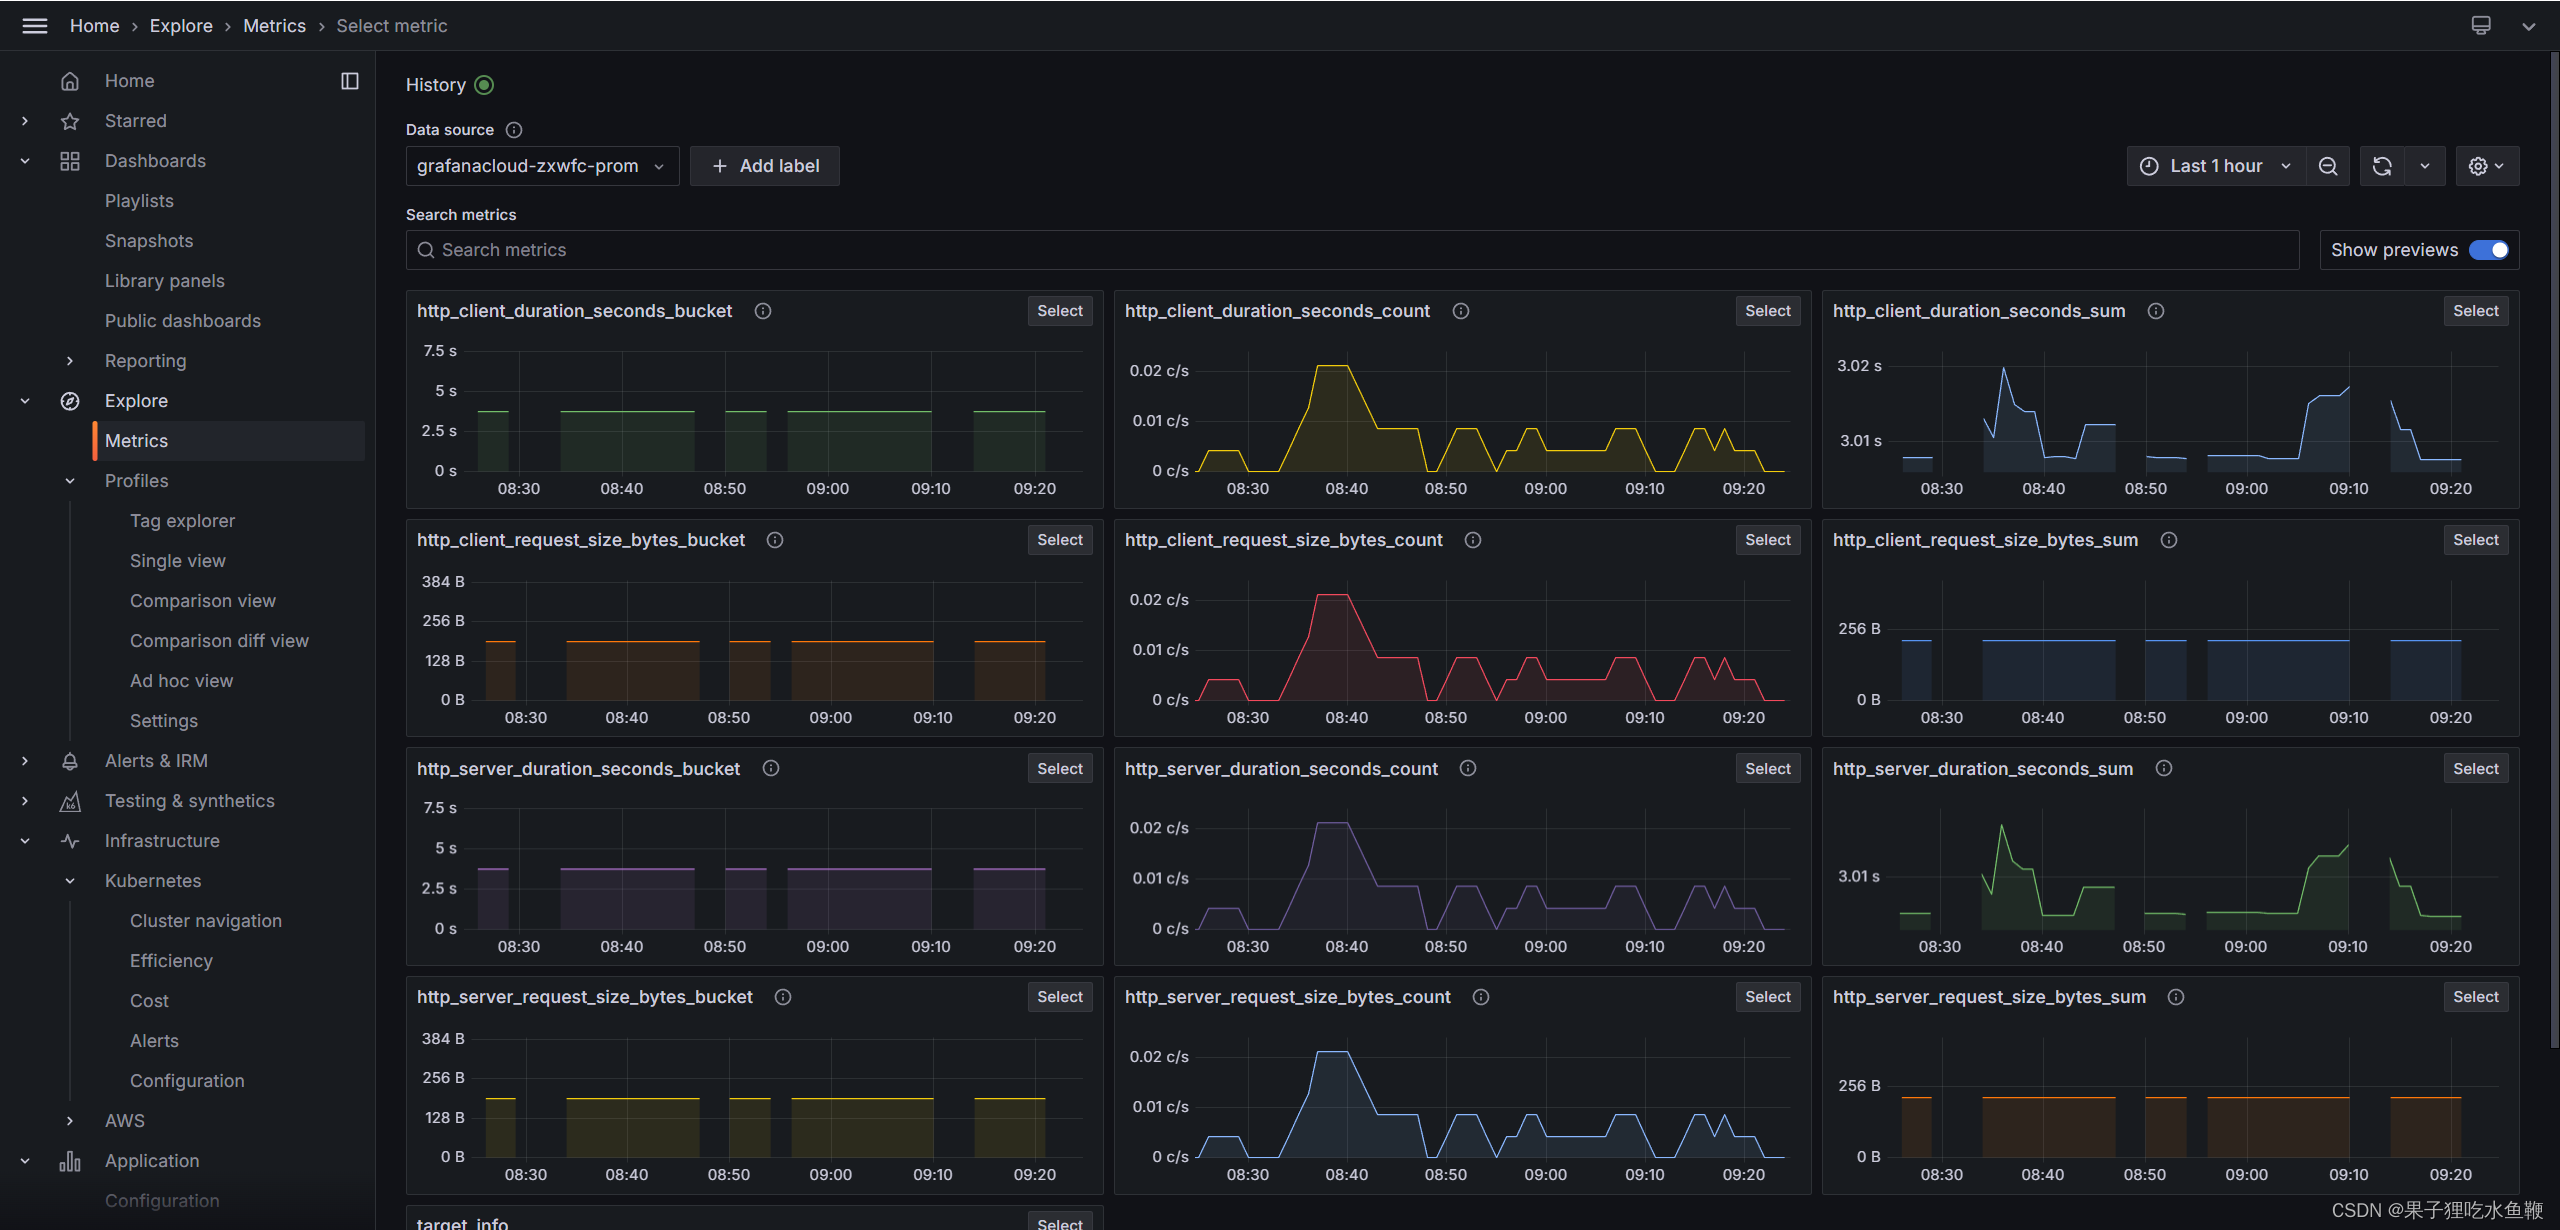
2.2.3.3部署后的问题
service graph在线仪表不支持。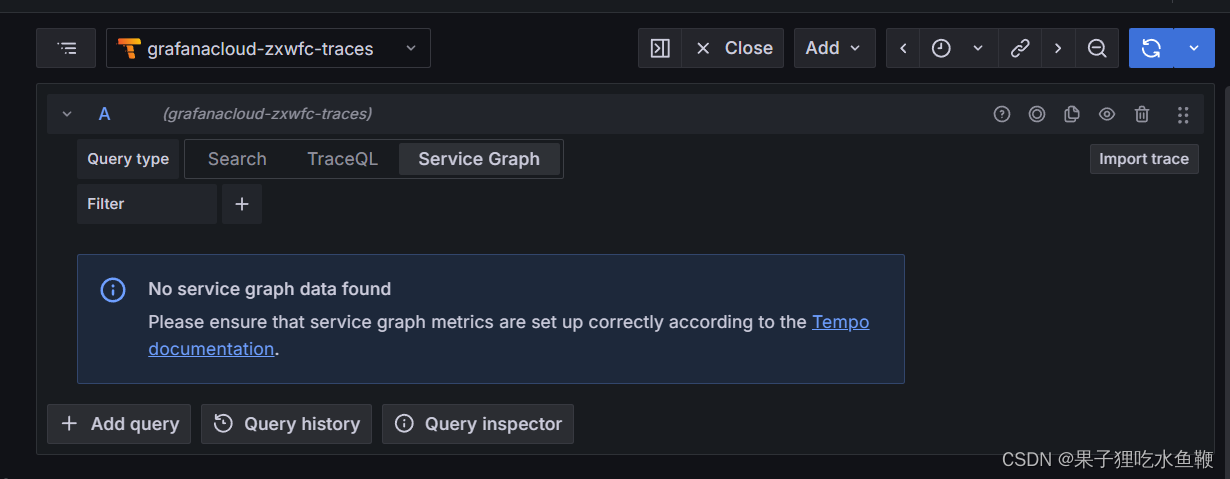
java语言编写的demo并没有生成串连的trace数据。
个人推测:
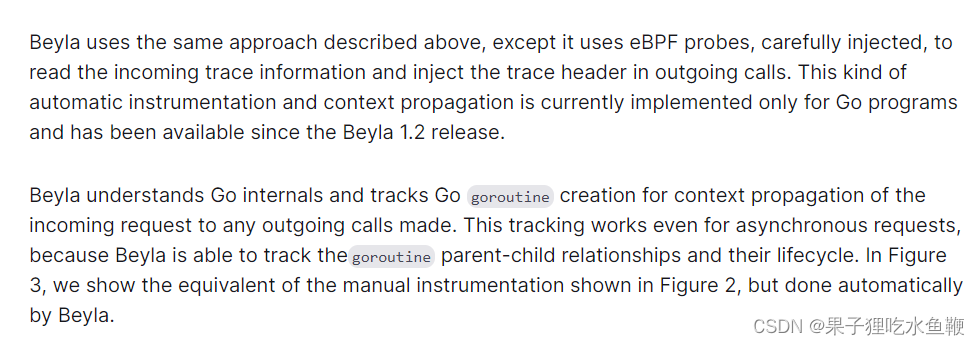
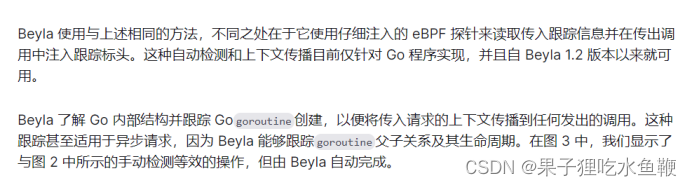
根据官方文档提供的信息,Beyla 目前仅针对 Go 语言实现了自动追踪和上下文传播功能。它利用 eBPF 探针技术来读取传入的追踪信息,并在出向调用时注入追踪头信息,从而实现在无需手动干预的情况下进行分布式追踪。由于 Beyla 深度理解 Go 语言内部机制,它可以追踪 Go 语言中的 goroutine 创建过程,将传入请求的上下文信息传递给后续发起的所有出站调用,即使这些调用是异步的也能有效工作,因为它能够跟踪 goroutine 之间的父子关系及其生命周期。
3.尝试其他部署方式
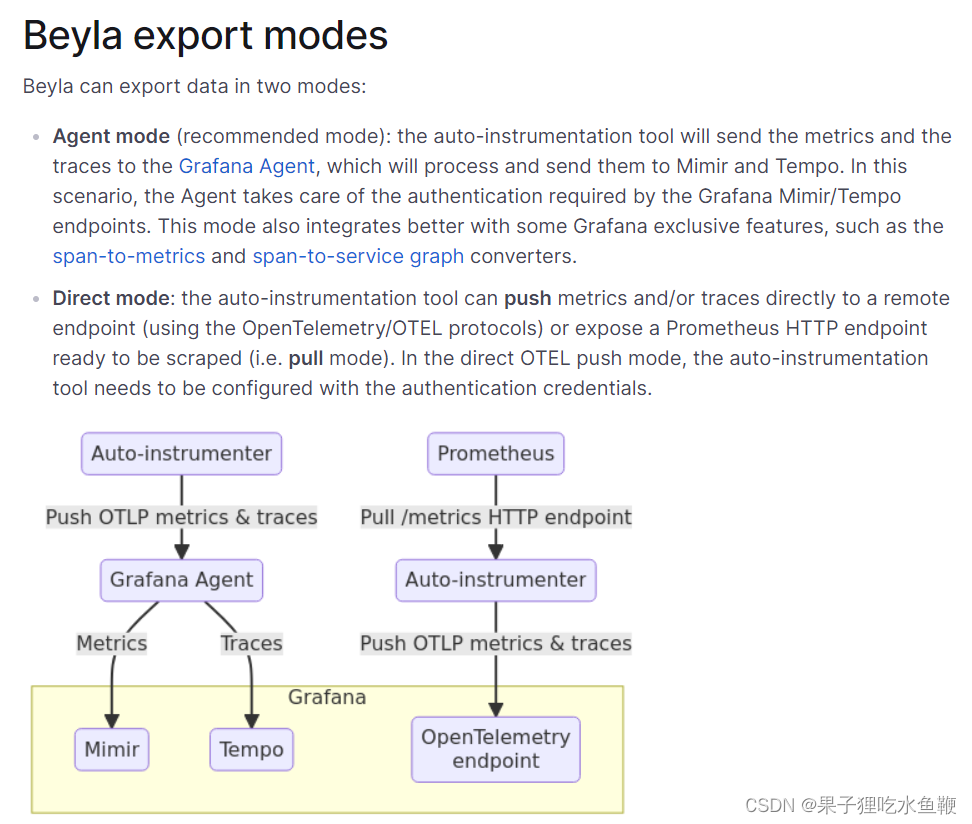
由于官方文档给的示例都是需要借助grafana cloud来展现数据采集的效果,于是根据官方文档中grafana beyla 的出口方式,尝试两种部署模式。
原文链接:
Beyla export modes | Grafana Beyla documentation
原文:
翻译:
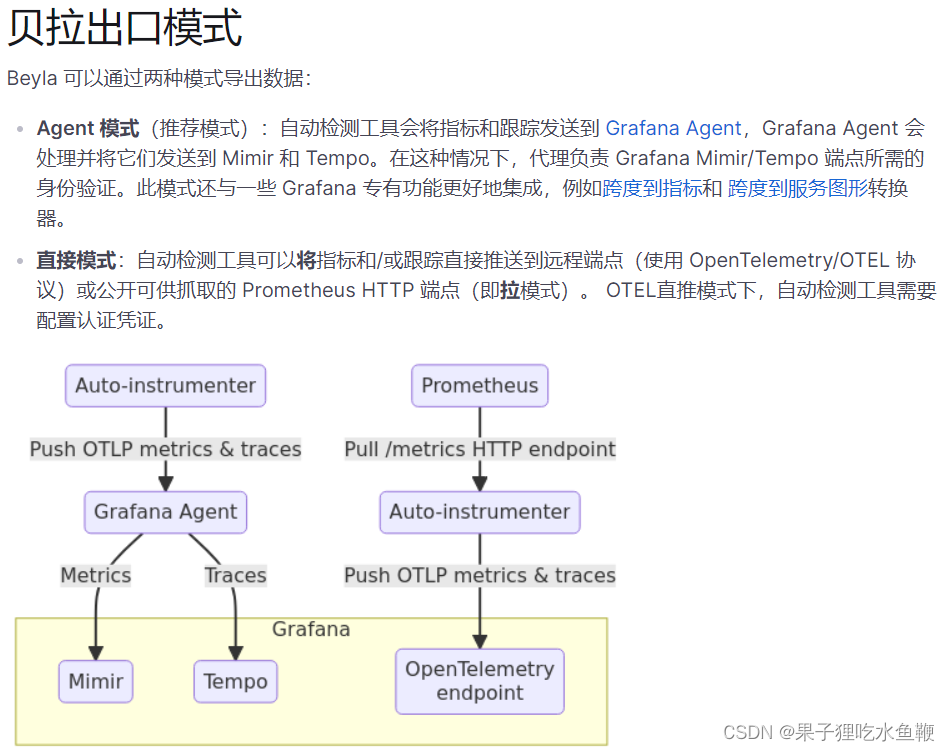
3.1 直接模式部署(prometheus直拉)
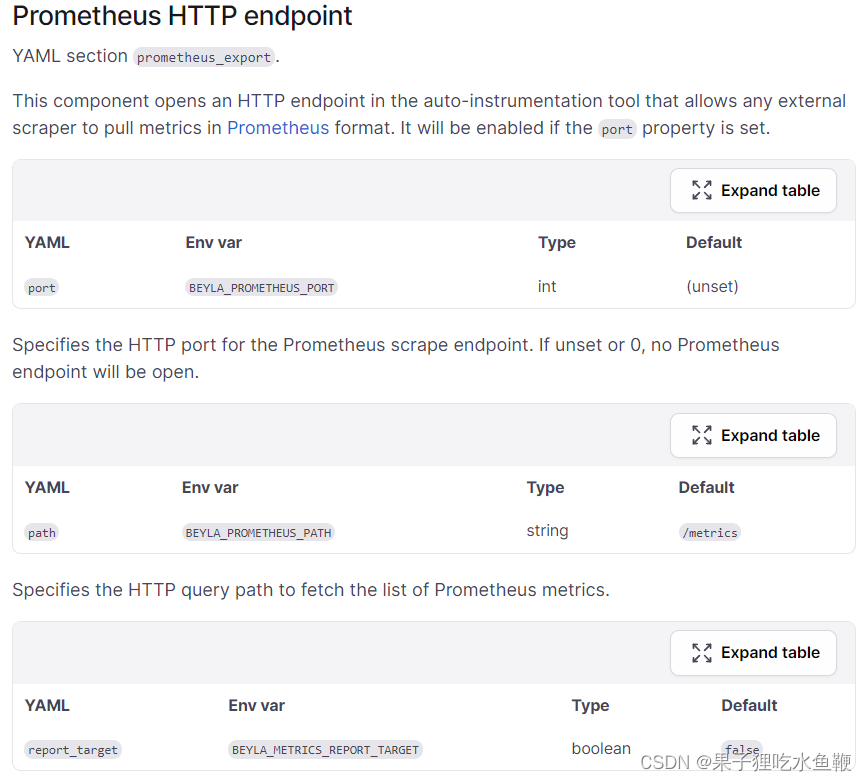
根据grafana beyla 的官方文档中给出的配置选项发现,beyla可以直接开放出某个端口,将符合prometheus格式的数据提供给prometheus自己拉取。并且在官方文档上提供了一个grafana的仪表盘的模版,来展示这些数据。
原文链接:
Beyla configuration options | Grafana Beyla documentation
3.1.1部署prometheus
#ServiceAccount
kind: ServiceAccount
apiVersion: v1
metadata:
  name: prometheus
  namespace: ebpf

#ClusterRole
kind: ClusterRole
apiVersion: rbac.authorization.k8s.io/v1
metadata:
  name: prometheusrules:
  - verbs:
      - '*'
    apiGroups:
      - '*'
    resources:
      - '*'

#ClusterRoleBinding
kind: ClusterRoleBinding
apiVersion: rbac.authorization.k8s.io/v1
metadata:
  name: prometheus
subjects:
  - kind: ServiceAccount
    name: prometheus
    namespace: ebpf
roleRef:
  apiGroup: rbac.authorization.k8s.io
  kind: ClusterRole
  name: prometheus

#ConfigMap(由于为了验证prometheus部署是否成功和grafana仪表盘是否正常
#同时也部署了kube-state-metrics以及node-exporter,所以prometheus配置文件中有多个job)
kind: ConfigMap
apiVersion: v1
metadata:
  name: prometheus-config
  namespace: ebpf
data:
  prometheus.yml: |
    global:
      scrape_interval:     15s
      evaluation_interval: 15s
    scrape_configs:
    - job_name: 'kubernetes-apiservers'
      kubernetes_sd_configs:
      - role: endpoints
      scheme: https
      tls_config:
        ca_file: /var/run/secrets/kubernetes.io/serviceaccount/ca.crt
      bearer_token_file: /var/run/secrets/kubernetes.io/serviceaccount/token
      relabel_configs:
      - source_labels: [__meta_kubernetes_namespace, __meta_kubernetes_service_name, __meta_kubernetes_endpoint_port_name]
        action: keep
        regex: default;kubernetes;https
    - job_name: 'kubernetes-nodes'
      kubernetes_sd_configs:
      - role: node
      scheme: https
      tls_config:
        ca_file: /var/run/secrets/kubernetes.io/serviceaccount/ca.crt
      bearer_token_file: /var/run/secrets/kubernetes.io/serviceaccount/token
      relabel_configs:
      - action: labelmap
        regex: __meta_kubernetes_node_label_(.+)
      - target_label: __address__
        replacement: kubernetes.default.svc:443
      - source_labels: [__meta_kubernetes_node_name]
        regex: (.+)
        target_label: __metrics_path__
        replacement: /api/v1/nodes/${1}/proxy/metrics
    - job_name: 'kubernetes-cadvisor'
      kubernetes_sd_configs:
      - role: node
      scheme: https
      tls_config:
        ca_file: /var/run/secrets/kubernetes.io/serviceaccount/ca.crt
      bearer_token_file: /var/run/secrets/kubernetes.io/serviceaccount/token
      relabel_configs:
      - action: labelmap
        regex: __meta_kubernetes_node_label_(.+)
      - target_label: __address__
        replacement: kubernetes.default.svc:443
      - source_labels: [__meta_kubernetes_node_name]
        regex: (.+)
        target_label: __metrics_path__
        replacement: /api/v1/nodes/${1}/proxy/metrics/cadvisor
    - job_name: 'kubernetes-service-endpoints'
      kubernetes_sd_configs:
      - role: endpoints
      relabel_configs:
      - source_labels: [__meta_kubernetes_service_annotation_prometheus_io_scrape]
        action: keep
        regex: true
      - source_labels: [__meta_kubernetes_service_annotation_prometheus_io_scheme]
        action: replace
        target_label: __scheme__
        regex: (https?)
      - source_labels: [__meta_kubernetes_service_annotation_prometheus_io_path]
        action: replace
        target_label: __metrics_path__
        regex: (.+)
      - source_labels: [__address__, __meta_kubernetes_service_annotation_prometheus_io_port]
        action: replace
        target_label: __address__
        regex: ([^:]+)(?::\d+)?;(\d+)
        replacement: $1:$2
      - action: labelmap
        regex: __meta_kubernetes_service_label_(.+)
      - source_labels: [__meta_kubernetes_namespace]
        action: replace
        target_label: kubernetes_namespace
      - source_labels: [__meta_kubernetes_service_name]
        action: replace
        target_label: kubernetes_name
    - job_name: 'kubernetes-services'
      kubernetes_sd_configs:
      - role: service
      metrics_path: /probe
      params:
        module: [http_2xx]
      relabel_configs:
      - source_labels: [__meta_kubernetes_service_annotation_prometheus_io_probe]
        action: keep
        regex: true
      - source_labels: [__address__]
        target_label: __param_target
      - target_label: __address__
        replacement: blackbox-exporter.example.com:9115
      - source_labels: [__param_target]
        target_label: instance
      - action: labelmap
        regex: __meta_kubernetes_service_label_(.+)
      - source_labels: [__meta_kubernetes_namespace]
        target_label: kubernetes_namespace
      - source_labels: [__meta_kubernetes_service_name]
        target_label: kubernetes_name
    - job_name: 'kubernetes-ingresses'
      kubernetes_sd_configs:
      - role: ingress
      relabel_configs:
      - source_labels: [__meta_kubernetes_ingress_annotation_prometheus_io_probe]
        action: keep
        regex: true
      - source_labels: [__meta_kubernetes_ingress_scheme,__address__,__meta_kubernetes_ingress_path]
        regex: (.+);(.+);(.+)
        replacement: ${1}://${2}${3}
        target_label: __param_target
      - target_label: __address__
        replacement: blackbox-exporter.example.com:9115
      - source_labels: [__param_target]
        target_label: instance
      - action: labelmap
        regex: __meta_kubernetes_ingress_label_(.+)
      - source_labels: [__meta_kubernetes_namespace]
        target_label: kubernetes_namespace
      - source_labels: [__meta_kubernetes_ingress_name]
        target_label: kubernetes_name
    - job_name: 'kubernetes-pods'
      kubernetes_sd_configs:
      - role: pod
      relabel_configs:
      - source_labels: [__meta_kubernetes_pod_annotation_prometheus_io_scrape]
        action: keep
        regex: true
      - source_labels: [__meta_kubernetes_pod_annotation_prometheus_io_path]
        action: replace
        target_label: __metrics_path__
        regex: (.+)
      - source_labels: [__address__, __meta_kubernetes_pod_annotation_prometheus_io_port]
        action: replace
        regex: ([^:]+)(?::\d+)?;(\d+)
        replacement: $1:$2
        target_label: __address__
      - action: labelmap
        regex: __meta_kubernetes_pod_label_(.+)
      - source_labels: [__meta_kubernetes_namespace]
        action: replace
        target_label: kubernetes_namespace
      - source_labels: [__meta_kubernetes_pod_name]
        action: replace
        target_label: kubernetes_pod_name
    - job_name: 'node'
      static_configs:
      - targets:
        - "60.204.246.220:9100"
        - "124.71.201.229:9100"

#Deployment
kind: Deployment
apiVersion: apps/v1
metadata:
  name: prometheus
  namespace: ebpf
spec:
  replicas: 1
  selector:
    matchLabels:
      app: prometheus
  template:
    metadata:
      creationTimestamp: null
      labels:
        app: prometheus
    spec:
      volumes:
        - name: data
          emptyDir: {}
        - name: config-volume
          configMap:
            name: prometheus-config
            defaultMode: 420
      containers:
        - name: prometheus
          image: prom/prometheus:v2.35.0
          command:
            - /bin/prometheus
          args:
            - '--config.file=/etc/prometheus/prometheus.yml'
            - '--storage.tsdb.path=/prometheus'
            - '--storage.tsdb.retention=24h'
          ports:
            - containerPort: 9090
              protocol: TCP
          resources:
            limits:
              cpu: 200m
              memory: 300Mi
            requests:
              cpu: 100m
              memory: 100Mi
          volumeMounts:
            - name: data
              mountPath: /prometheus
            - name: config-volume
              mountPath: /etc/prometheus
          terminationMessagePath: /dev/termination-log
          terminationMessagePolicy: File
          imagePullPolicy: IfNotPresent
      restartPolicy: Always
      terminationGracePeriodSeconds: 30
      dnsPolicy: ClusterFirst
      serviceAccountName: prometheus
      serviceAccount: prometheus
      securityContext: {}
      schedulerName: default-scheduler

#Service
kind: Service
apiVersion: v1
metadata:
  name: prometheus
  namespace: ebpf
spec:
  ports:
    - protocol: TCP
      port: 9090
      targetPort: 9090
      nodePort: 30003
  selector:
    app: prometheus
  type: NodePort
3.1.2部署kube-state-metrics以及node-exporter(可选)
#DaemonSet
kind: DaemonSet
apiVersion: apps/v1
metadata:
  name: node-exporter
  namespace: ebpf
spec:
  selector:
    matchLabels:
      app: node-exporter
  template:
    metadata:
      creationTimestamp: null
      labels:
        app: node-exporter
    spec:
      volumes:
        - name: proc
          hostPath:
            path: /proc
            type: ''
        - name: sys
          hostPath:
            path: /sys
            type: ''
      containers:
        - name: node-exporter
          image: prom/node-exporter:v1.3.1
          args:
            - '--path.procfs=/host/proc'
            - '--path.sysfs=/host/sys'
          ports:
            - name: metrics
              hostPort: 9100
              containerPort: 9100
              protocol: TCP
          resources:
            limits:
              cpu: 100m
              memory: 30Mi
            requests:
              cpu: 100m
              memory: 30Mi
          volumeMounts:
            - name: proc
              readOnly: true
              mountPath: /host/proc
            - name: sys
              readOnly: true
              mountPath: /host/sys
          terminationMessagePath: /dev/termination-log
          terminationMessagePolicy: File
          imagePullPolicy: IfNotPresent
          securityContext:
            privileged: true

#Service
kind: Service
apiVersion: v1
metadata:
  name: node-exporter
  namespace: ebpf
spec:
  ports:
    - name: http
      protocol: TCP
      port: 9100
      targetPort: 9100
      nodePort: 31672
  selector:
    k8s-app: node-exporter
  type: NodePort
kube-state-metrics省略,百度教程很多。
3.1.3部署grafana server
#Deployment
kind: Deployment
apiVersion: apps/v1
metadata:
  name: grafana-server
  namespace: ebpf
spec:
  replicas: 1
  selector:
    matchLabels:
      k8s-app: grafana
      task: monitoring
  template:
    metadata:
      creationTimestamp: null
      labels:
        k8s-app: grafana
        task: monitoring*
    spec:
      volumes:
        - name: ca-certificates
          hostPath:
            path: /etc/ssl/certs
            type: ''
        - name: grafana-storage
          emptyDir: {}
        - name: lib
          hostPath:
            path: /var/lib/grafana/
            type: DirectoryOrCreate
      containers:
        - name: grafana
          image: grafana/grafana:8.4.5
          ports:
            - containerPort: 3000
              protocol: TCP
          env:
            - name: INFLUXDB_HOST
              value: monitoring-influxdb
            - name: GF_SERVER_HTTP_PORT
              value: '3000'
            - name: GF_AUTH_BASIC_ENABLED
              value: 'false'
            - name: GF_AUTH_ANONYMOUS_ENABLED
              value: 'true'
            - name: GF_AUTH_ANONYMOUS_ORG_ROLE
              value: Admin
            - name: GF_SERVER_ROOT_URL
              value: /
          resources: {}
          volumeMounts:
            - name: ca-certificates
              readOnly: true
              mountPath: /etc/ssl/certs
            - name: grafana-storage
              mountPath: /var
            - name: lib
              mountPath: /var/lib/grafana/
          terminationMessagePath: /dev/termination-log
          terminationMessagePolicy: File
          imagePullPolicy: IfNotPresent
      restartPolicy: Always
      terminationGracePeriodSeconds: 30
      dnsPolicy: ClusterFirst
      nodeName: master

#Service
kind: Service
apiVersion: v1
metadata:
  name: grafana-svc
  namespace: ebpf
spec:
  ports:
    - protocol: TCP
      port: 80
      targetPort: 3000
      nodePort: 31091
  selector:
    k8s-app: grafana
  type: NodePort
3.1.4查看正常监控数据是否能正常在grafana上展示
配置数据源: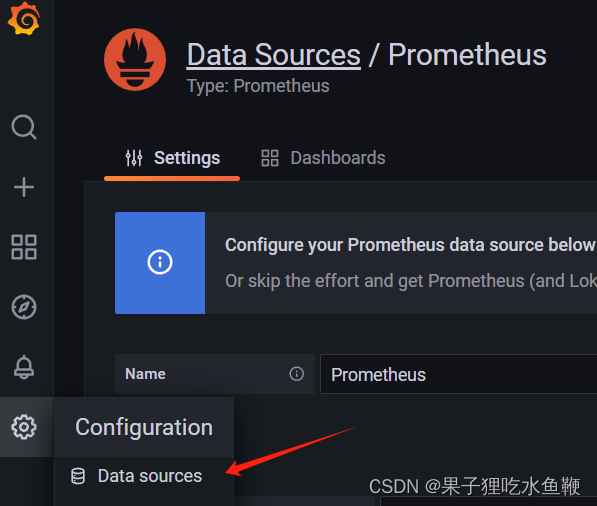
导入仪表盘模版: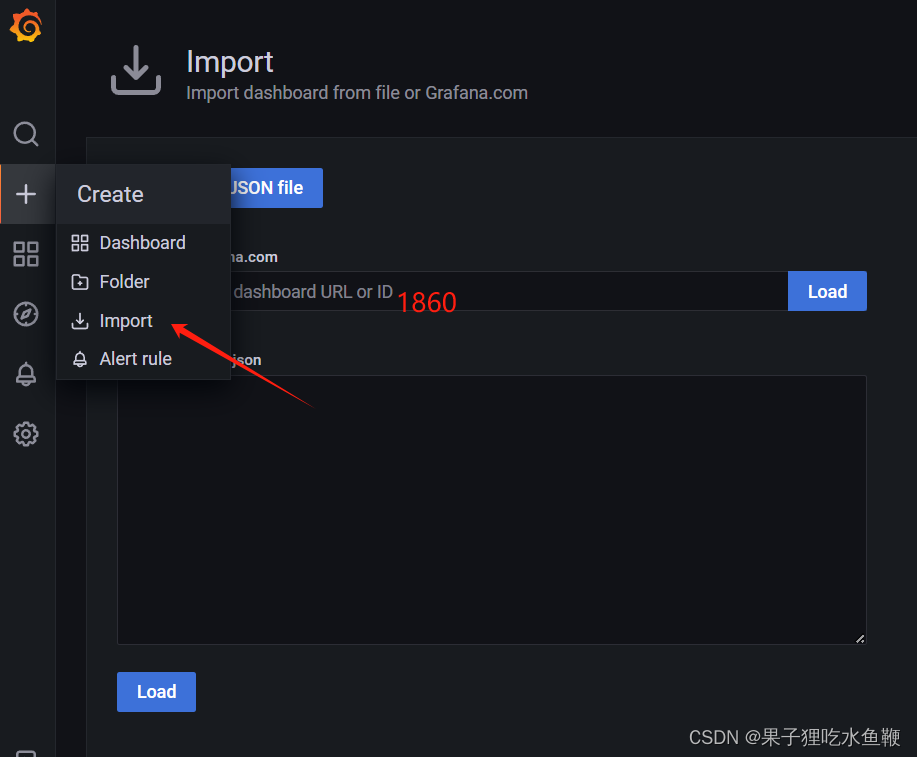
采集展示正常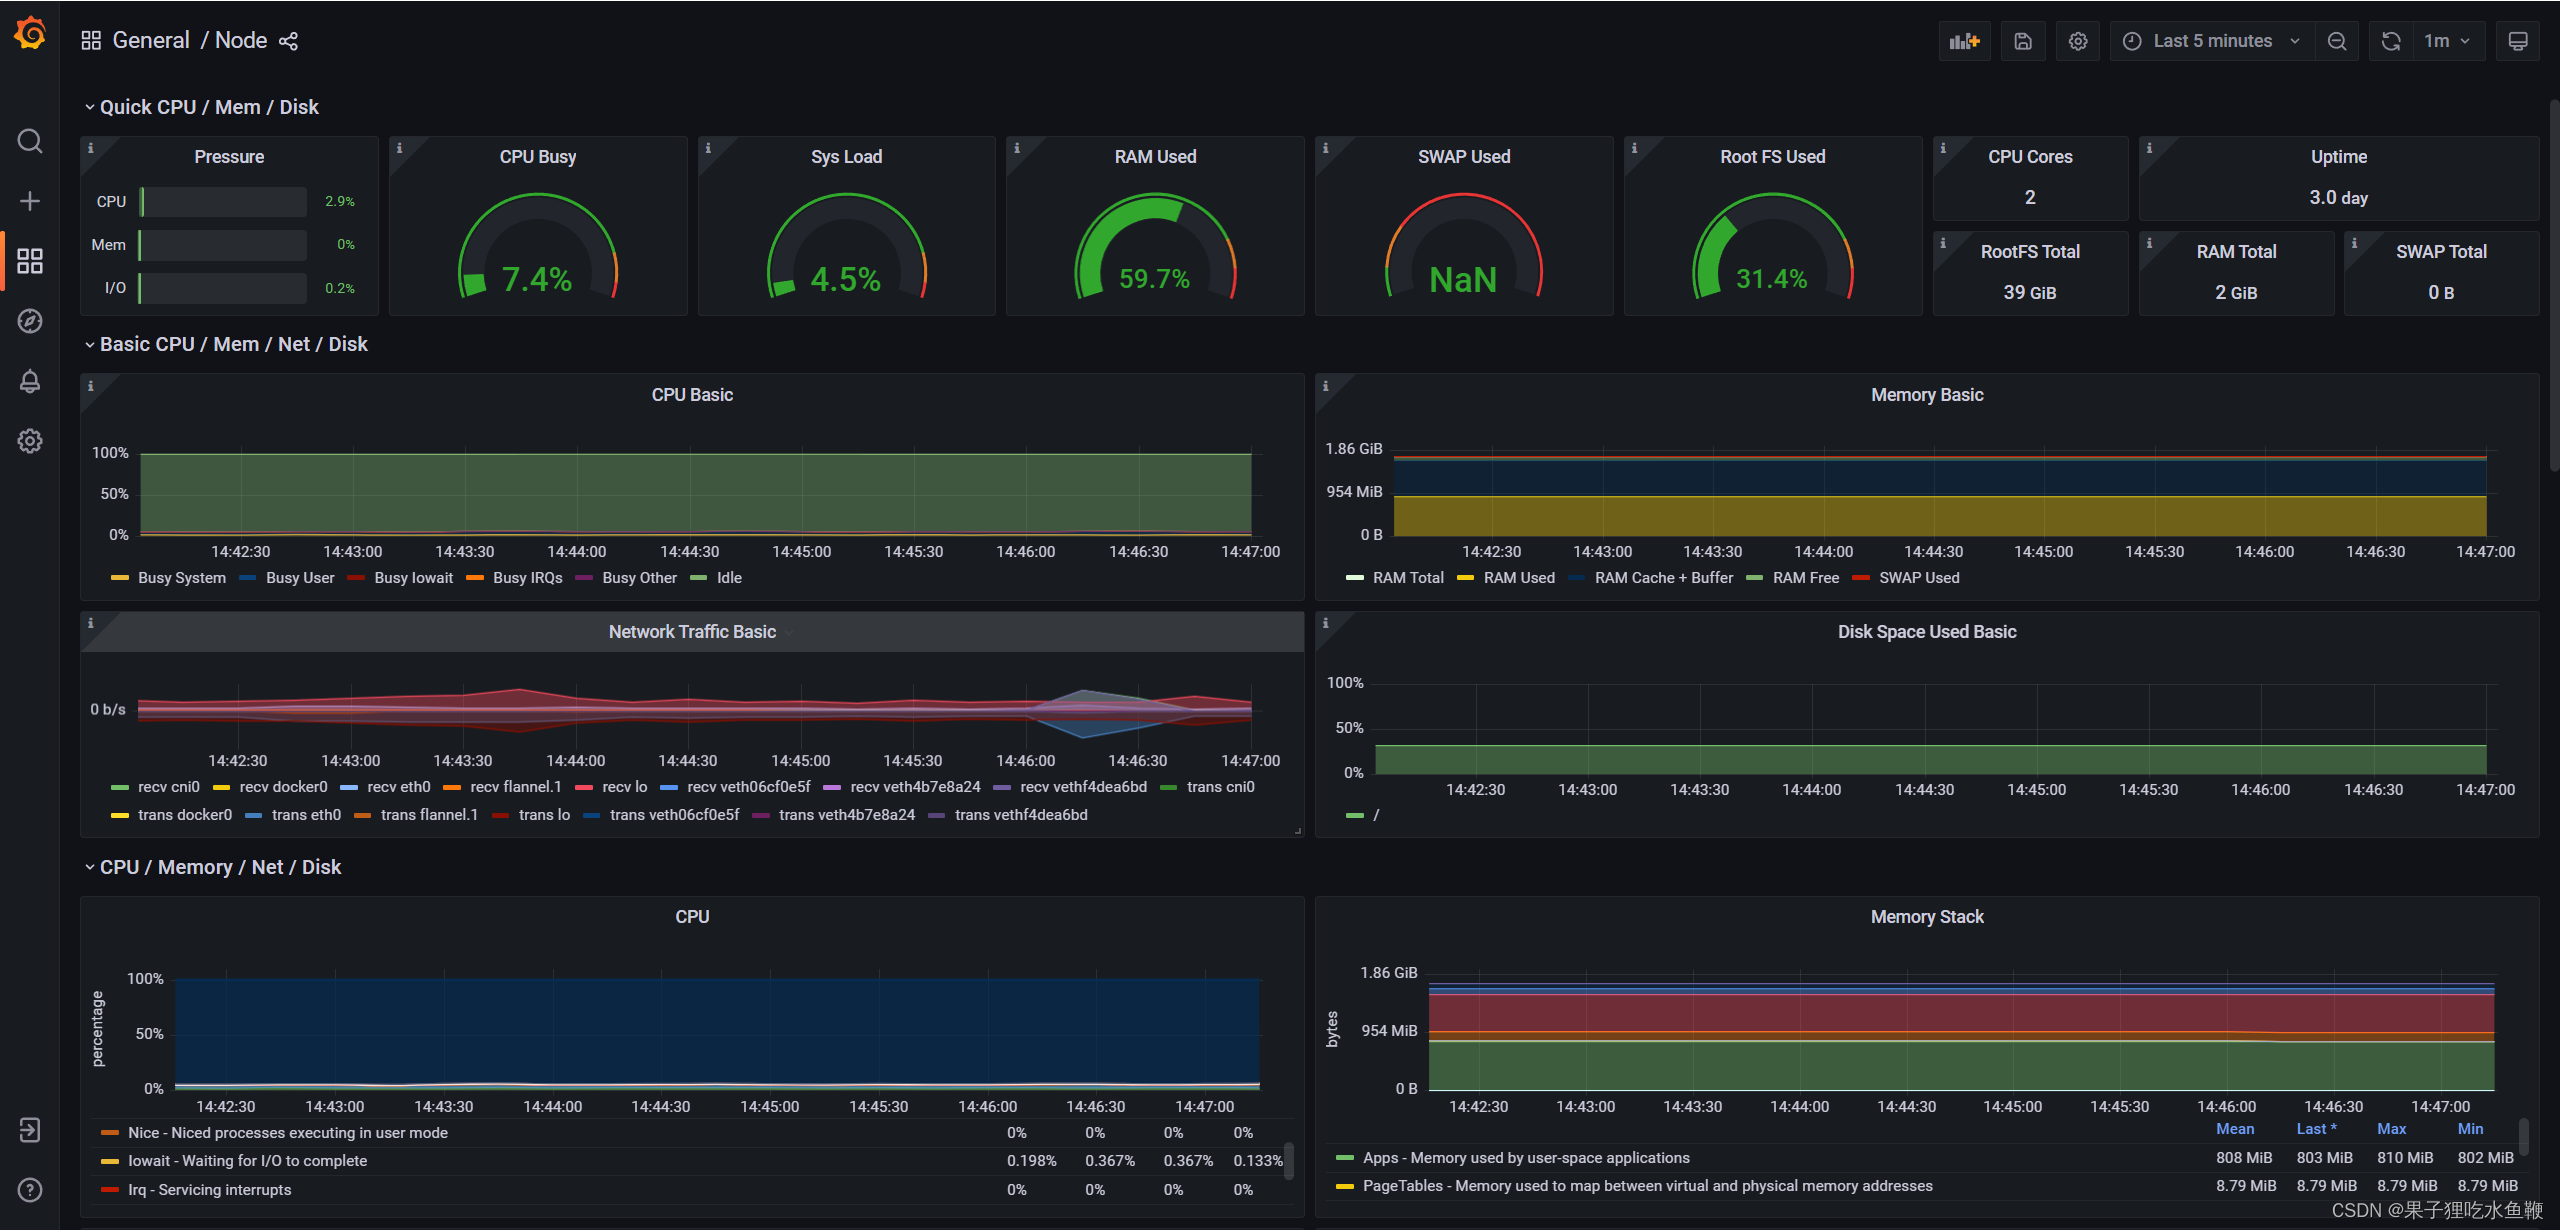
3.1.5部署beyla
#ServiceAccount
kind: ServiceAccount
apiVersion: v1
metadata:
  name: beyla
  namespace: ebpf

#ClusterRole 上面提过的开启所有权限
kind: ClusterRole
apiVersion: rbac.authorization.k8s.io/v1
metadata:
  name: beyla
rules:
  - verbs:
      - '*'
    apiGroups:
      - '*'
    resources:
      - '*'

#ClusterRoleBinding
kind: ClusterRoleBinding
apiVersion: rbac.authorization.k8s.io/v1
metadata:
  name: beyla
subjects:
  - kind: ServiceAccount
    name: beyla
    namespace: deepflow-ebpf-spring-demo
roleRef:
  apiGroup: rbac.authorization.k8s.io
  kind: ClusterRole
  name: beyla

#ConfigMap
kind: ConfigMap
apiVersion: v1
metadata:
  name: beyla-config
  namespace: ebpf
data:
  beyla-config.yml: |
    logging:
      level: info
      format: json
      output: stdout
    metrics:
      enabled: true
      endpoint: /metrics
    internal_metrics:
      prometheus:
        port: 9999
        path: /internal/metrics
    attributes:
      kubernetes:
        enable: true
    routes:
      unmatched: heuristic
    discovery:
      services:
        #这里通过官方文档中的配置说明将值替换为*标识所有deployment
        - k8s_deployment_name: "^*$"

#DaemonSet
kind: DaemonSet
apiVersion: apps/v1
metadata:
  name: beyla
  namespace: ebpf
spec:
  selector:
    matchLabels:
      instrumentation: beyla
  template:
    metadata:
      creationTimestamp: null
      labels:
        instrumentation: beyla
    spec:
      volumes:
        - name: beyla-config
          configMap:
            name: beyla-config
            defaultMode: 420
        - name: var-run-beyla
          emptyDir: {}
      containers:
        - name: beyla
          image: grafana/beyla:1.4
          ports:
            - containerPort: 9999
              protocol: TCP
          env:
            - name: BEYLA_PROMETHEUS_PORT
              value: '9999'
            - name: BEYLA_PROMETHEUS_PATH
              value: /metrics
            - name: BEYLA_METRICS_REPORT_TARGET
              value: 'true'
            - name: BEYLA_METRICS_REPORT_PEER
              value: 'true'
            - name: BEYLA_PRINT_TRACES
              value: 'true'
            - name: BEYLA_CONFIG_PATH
              value: /config/beyla-config.yml
            - name: BEYLA_OPEN_PORT
              value: '9999'
            - name: BEYLA_KUBE_METADATA_ENABLE
              value: 'true'
          resources: {}
          volumeMounts:
            - name: beyla-config
              mountPath: /config
            - name: var-run-beyla
              mountPath: /var/run/beyla
          terminationMessagePath: /dev/termination-log
          terminationMessagePolicy: File
          imagePullPolicy: IfNotPresent
          securityContext:
            privileged: true
            readOnlyRootFilesystem: true
      restartPolicy: Always
      terminationGracePeriodSeconds: 30
      dnsPolicy: ClusterFirst
      serviceAccountName: beyla
      serviceAccount: beyla
      hostPID: true
      securityContext: {}
      schedulerName: default-scheduler
3.1.6修改prometheus配置文件
让prometheus直接主动拉取beyla中符合prometheus格式的数据。Config Maps中添加job指向beyla开放的端口
- job_name: 'beyla'
      static_configs:
      #10.244.1.136:9999beyla开放的ip端口
      - targets: ['10.244.1.136:9999','10.244.1.140:9999']
3.1.7重启并查看prometheus中的targets
此时已经成功地向Prometheus实例添加了一个新的监控任务。
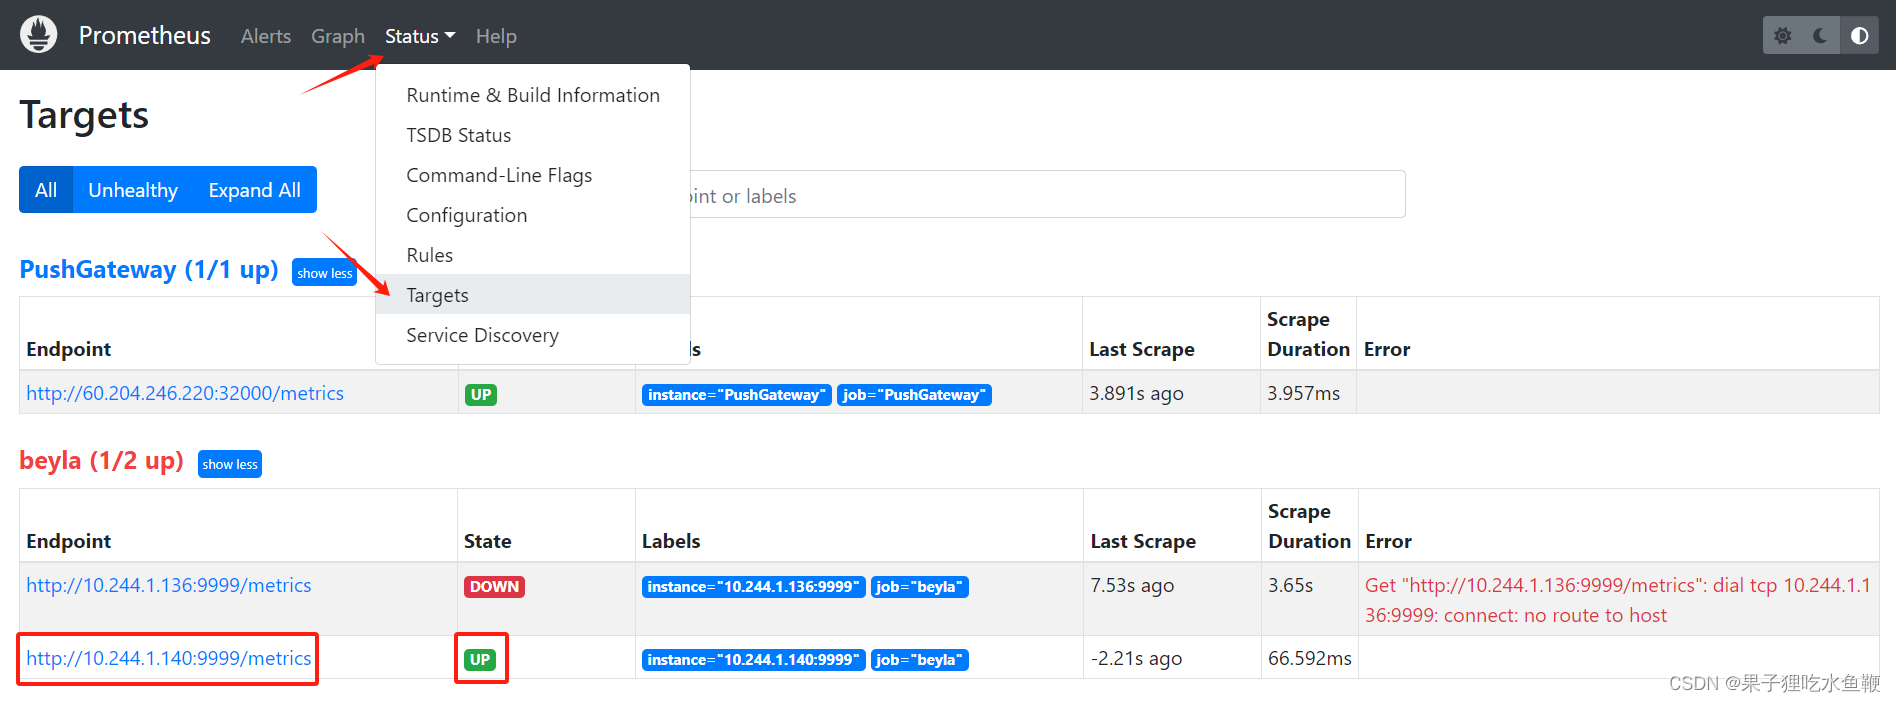
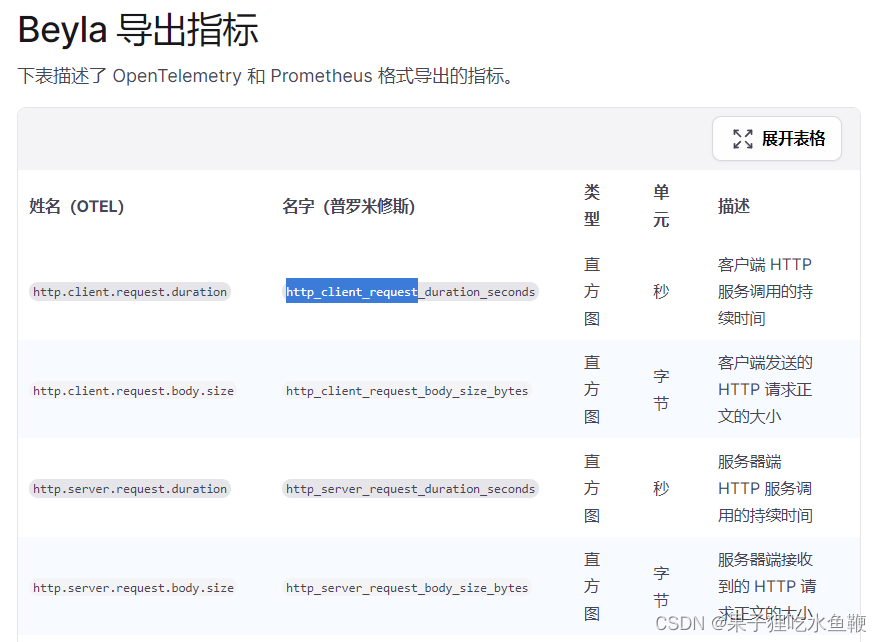
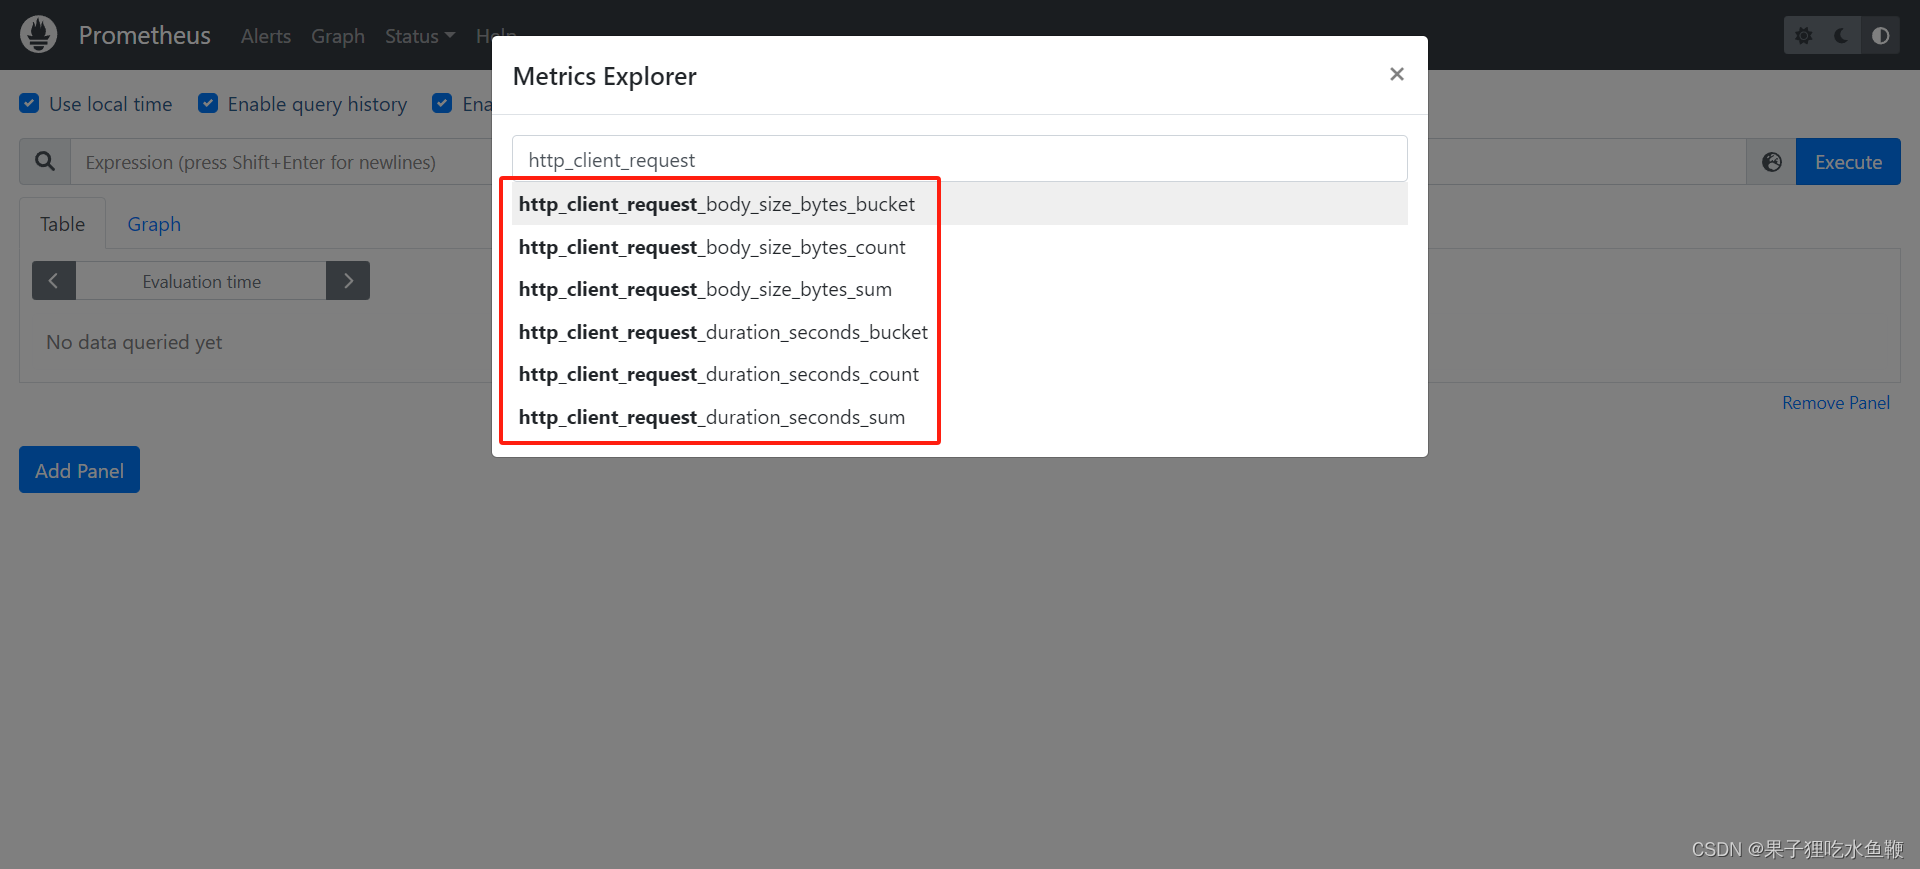
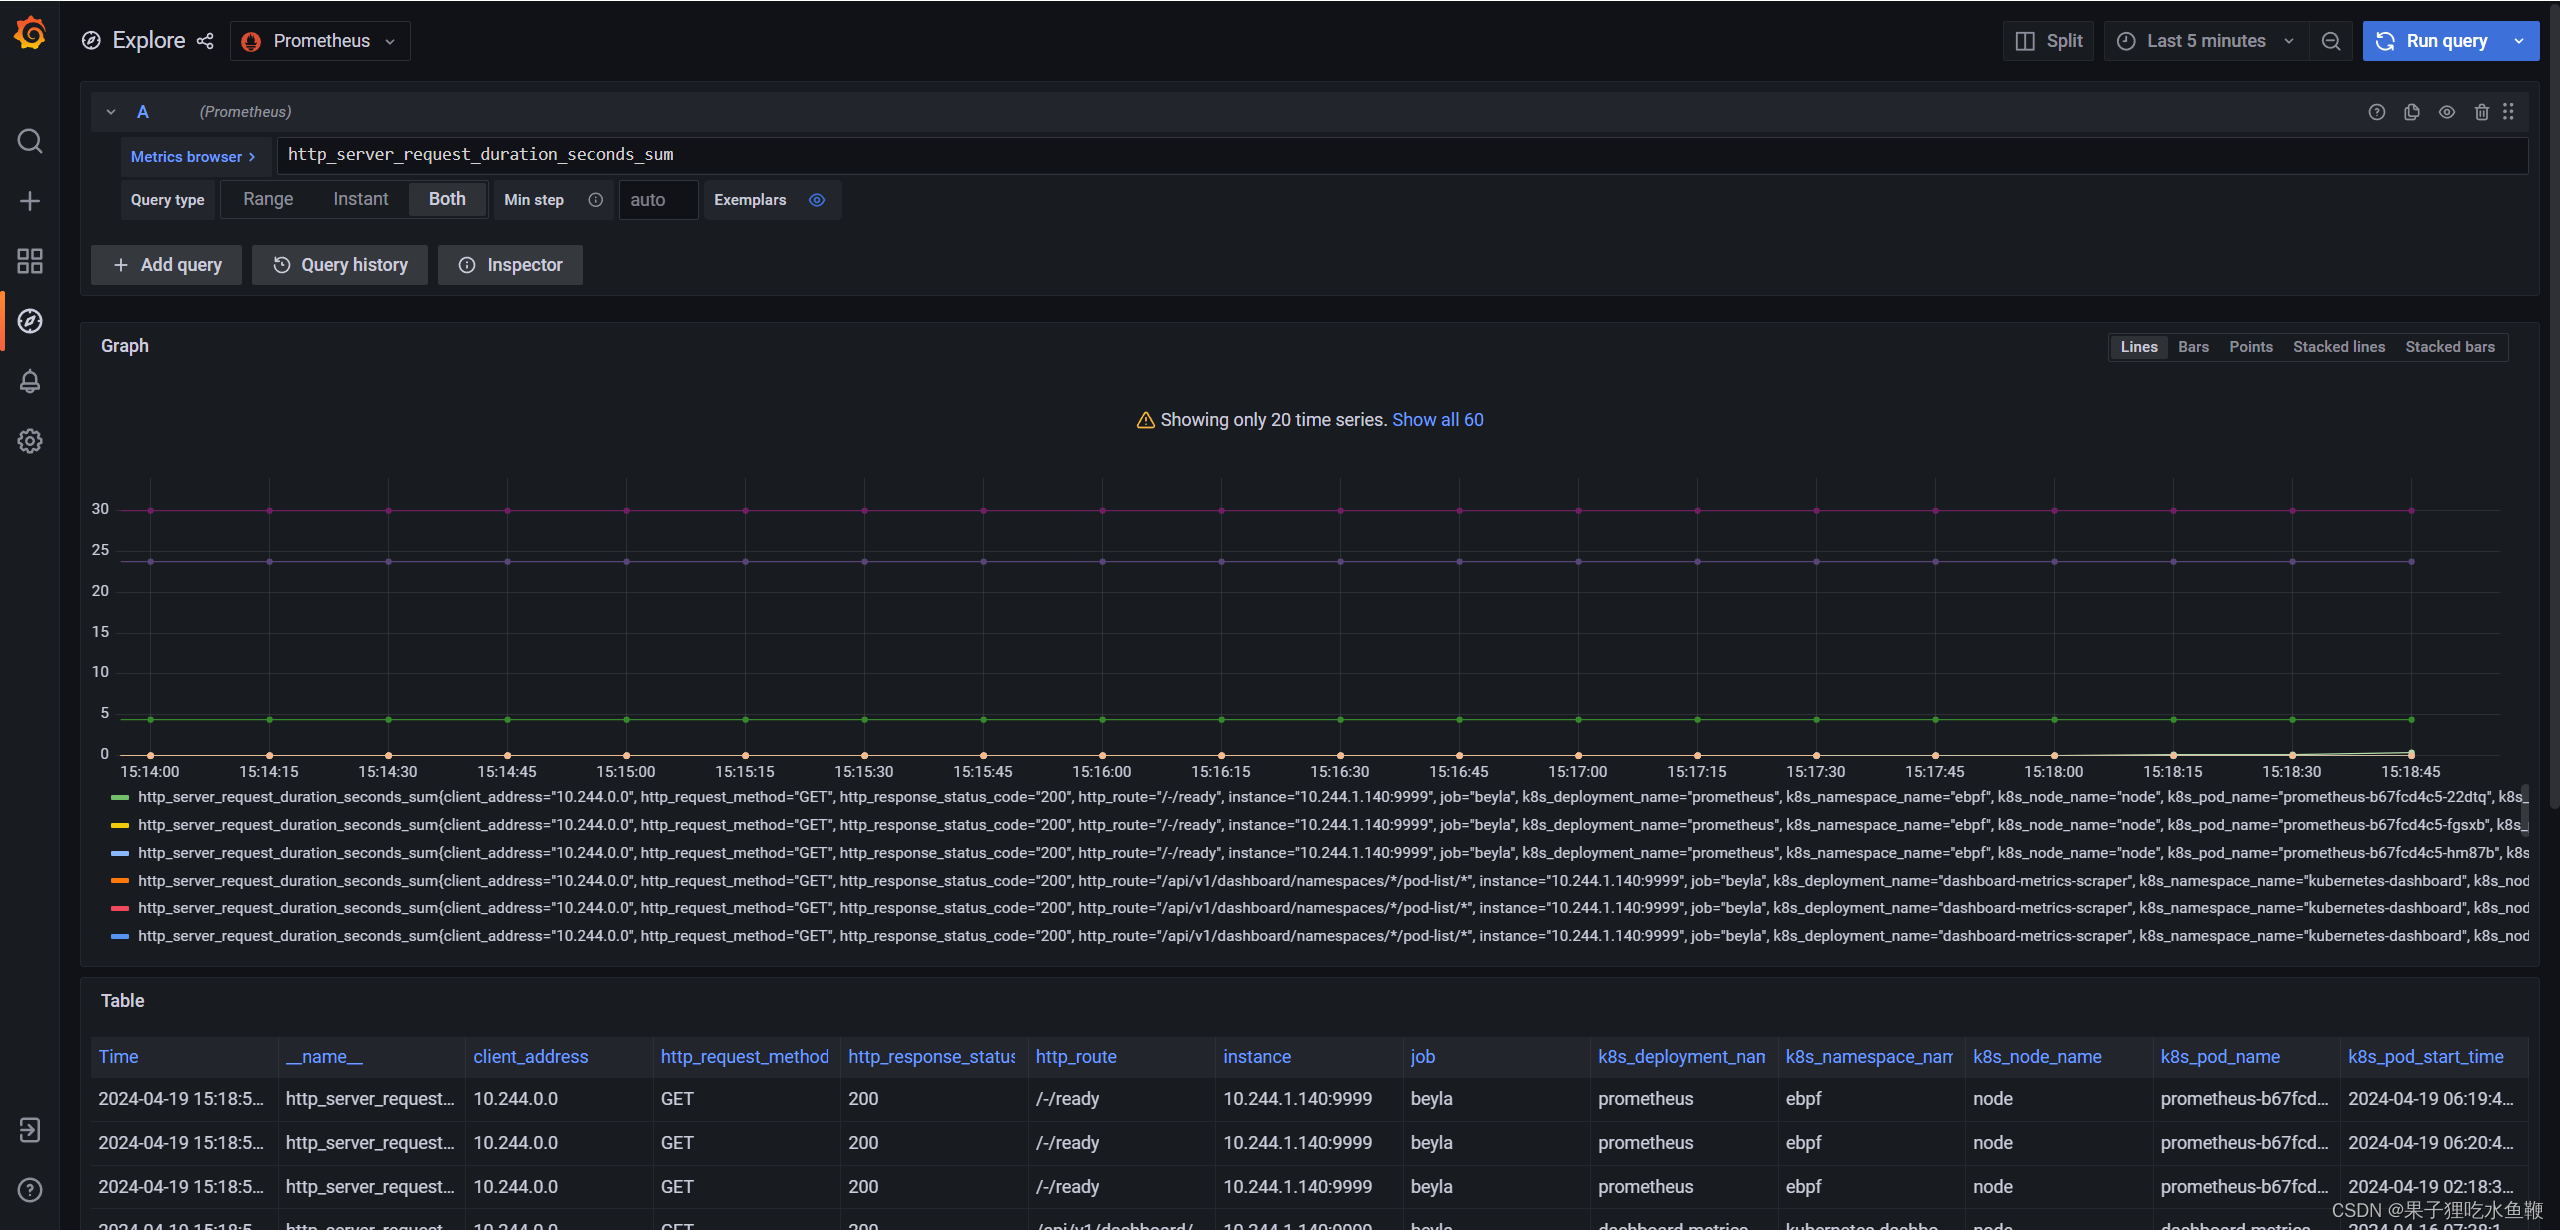
查看prometheus中是否有这些指标
3.1.8配置grafana仪表盘
官方文档中提到了一个仪表模版Getting started with Beyla | Grafana Beyla documentation
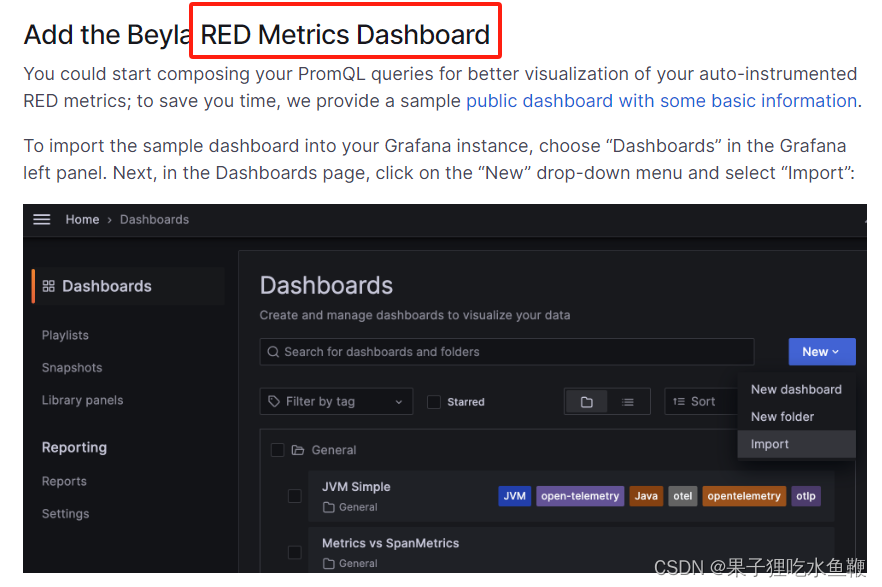
导入模版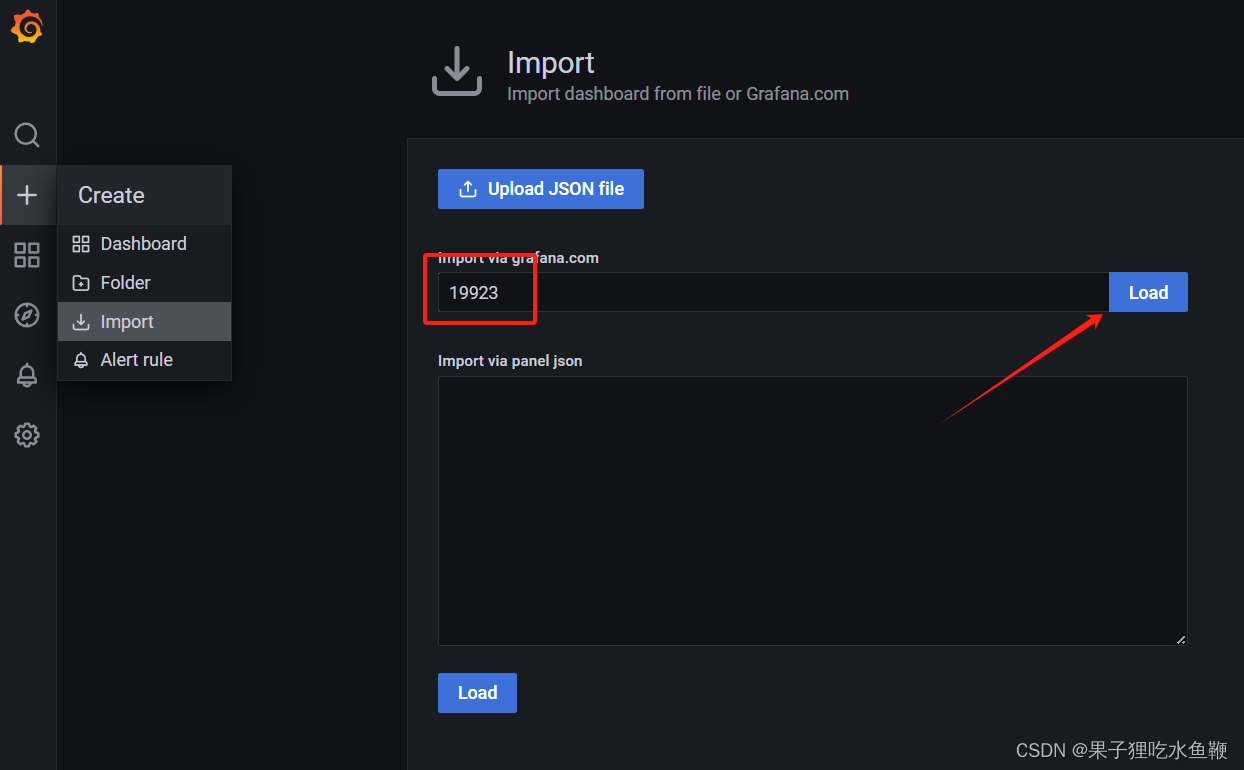
采集效果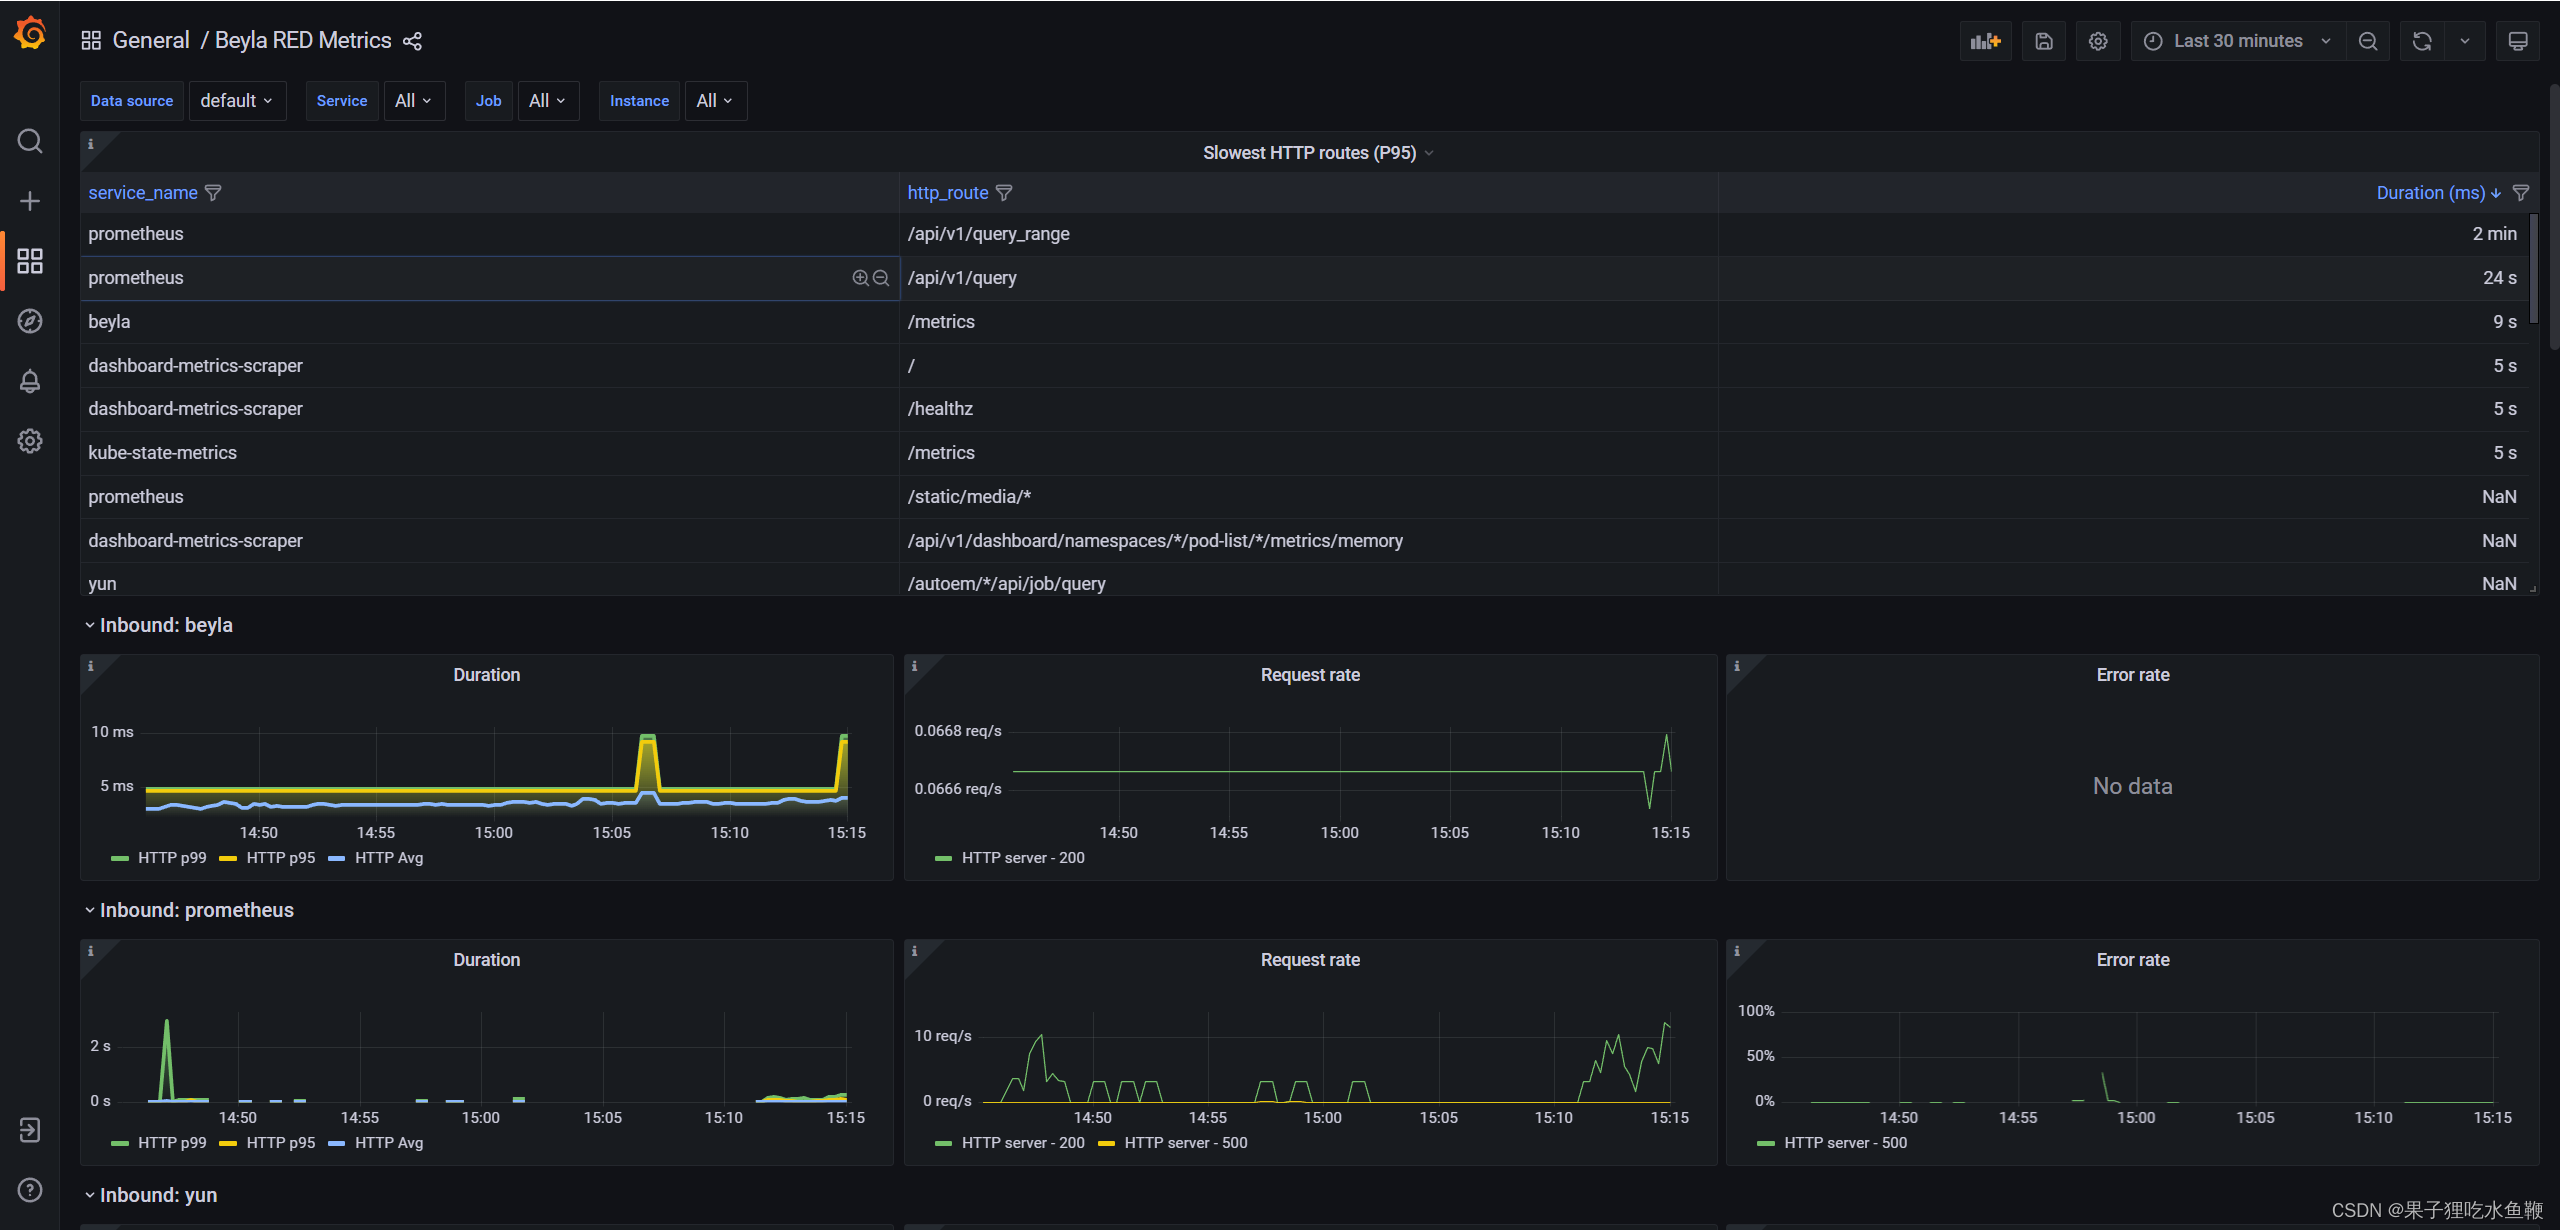
3.2agent模式
由于搭建一套tempo+mimir非常的消耗资源,所以我们借助官方提供的在线组件来展示数据。
原文: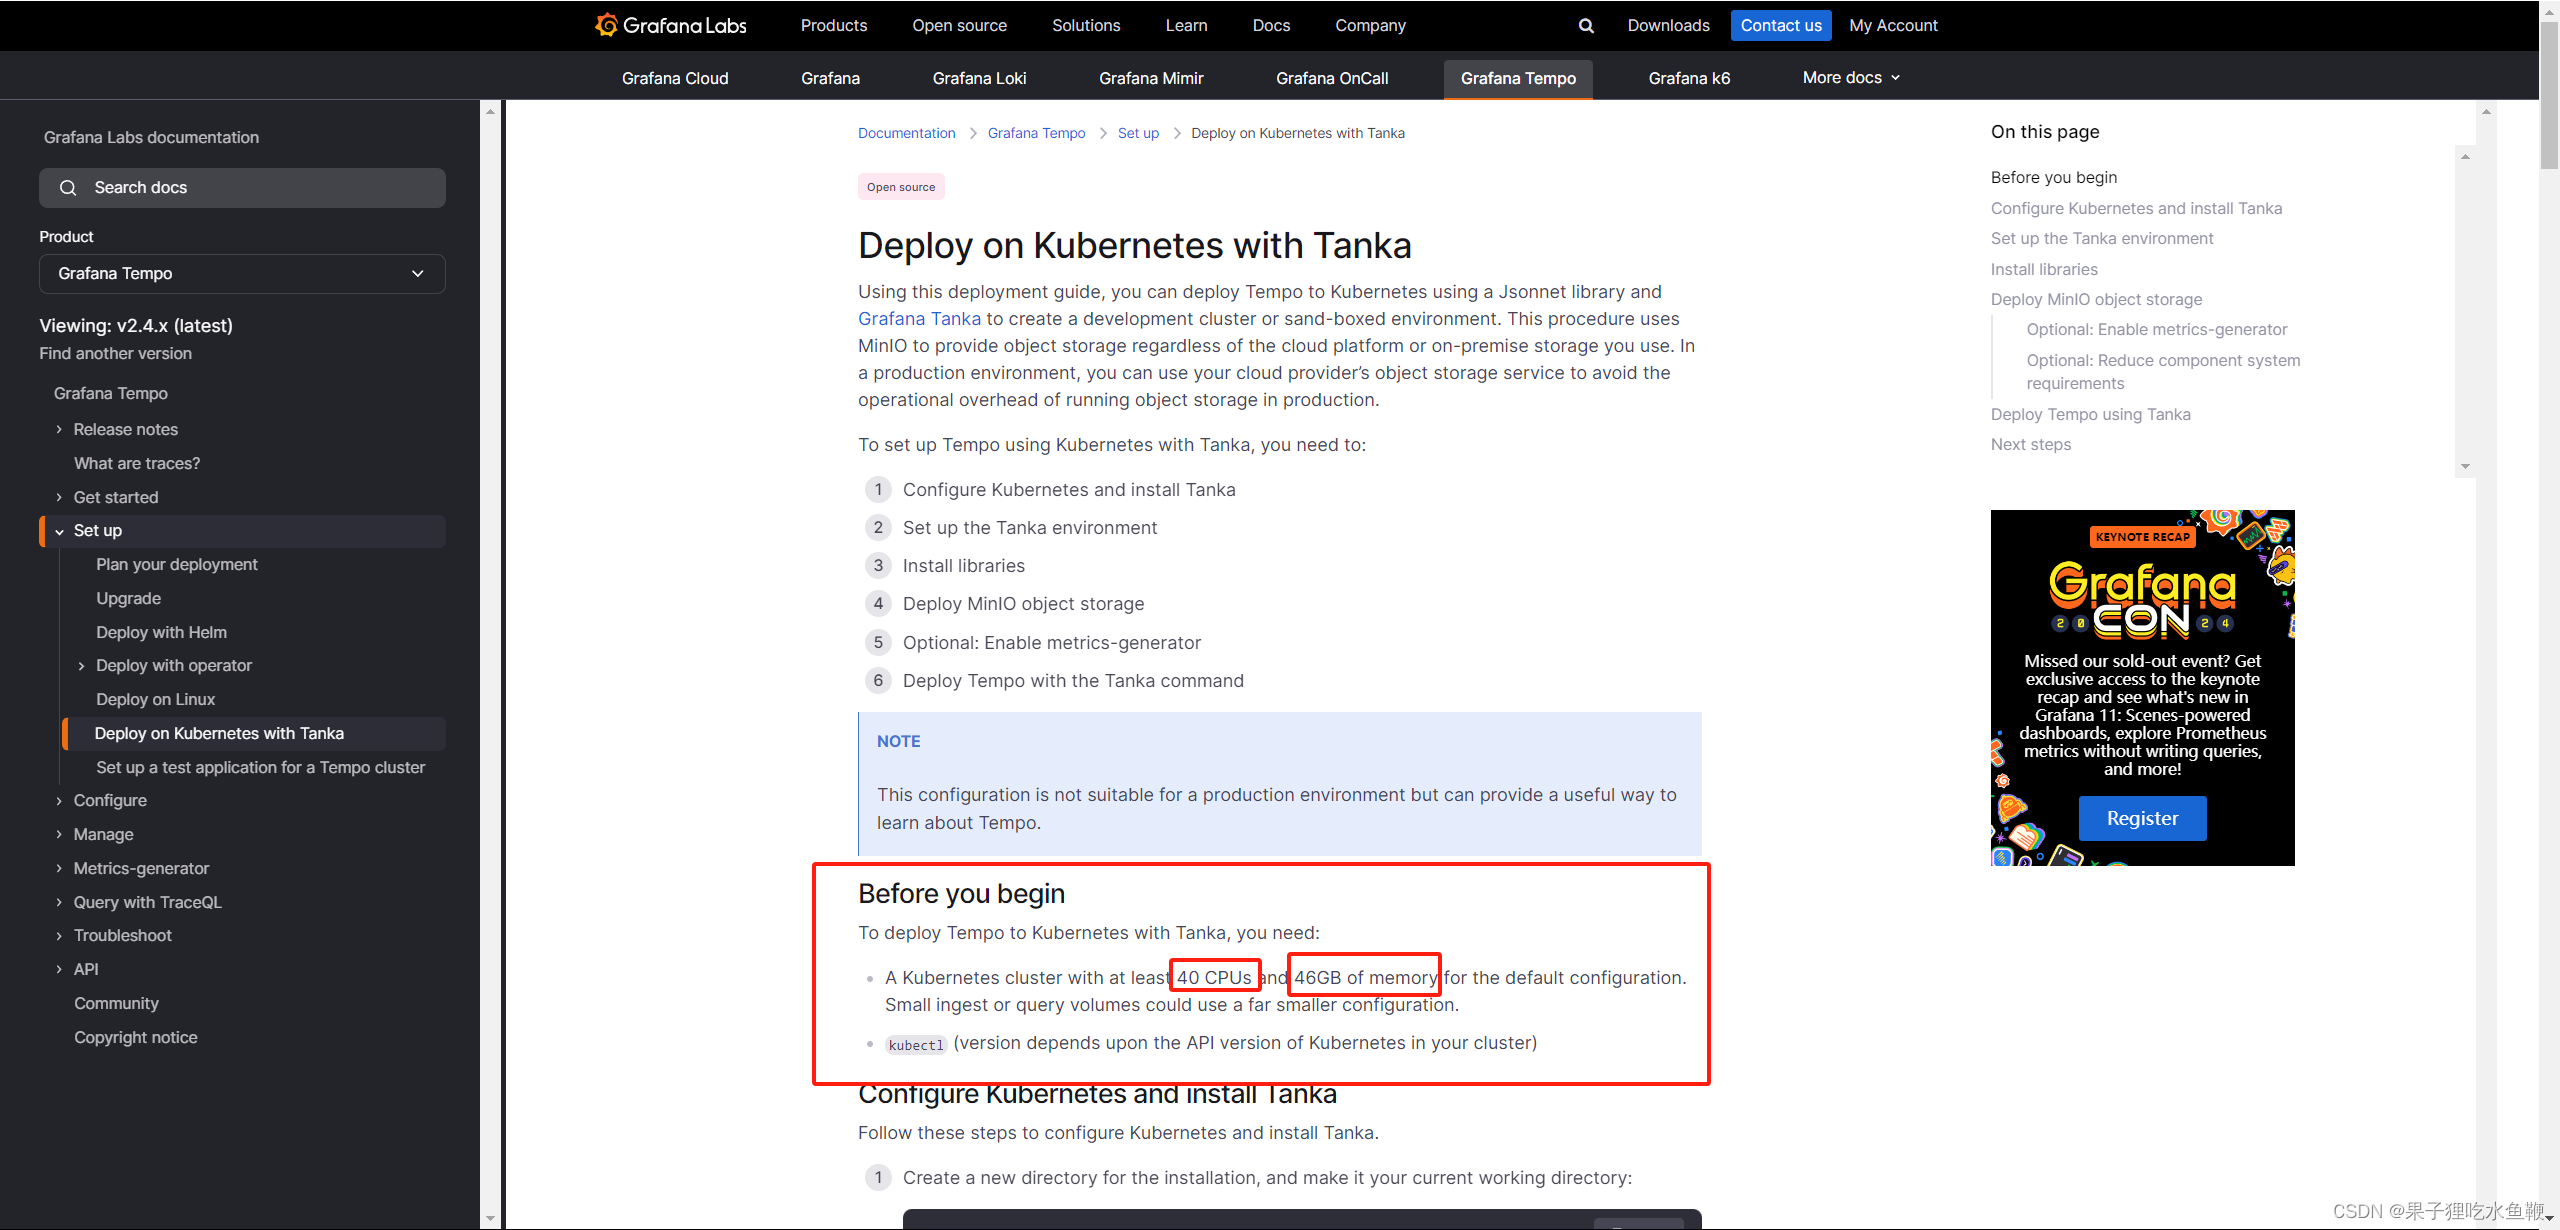
翻译:
社区文档:
3.2.9利用grafana cloud的云组件实现tarce数据的展示
在此之前,仔细阅读2.2.2.1根据官方示例部署beyla的介绍,添加好secret,并且将DaemonSet修改正确。这样可以将beyla采集的trace数据吐向之前生成的otel-collector存储至grafana提供的tempo上。
grafana tempo令牌生成,进入cloud个人空间。
生成密码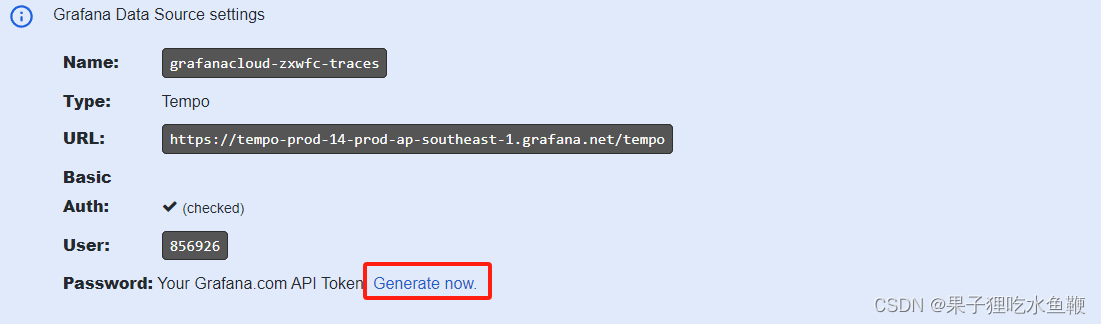
添加tempo作为数据源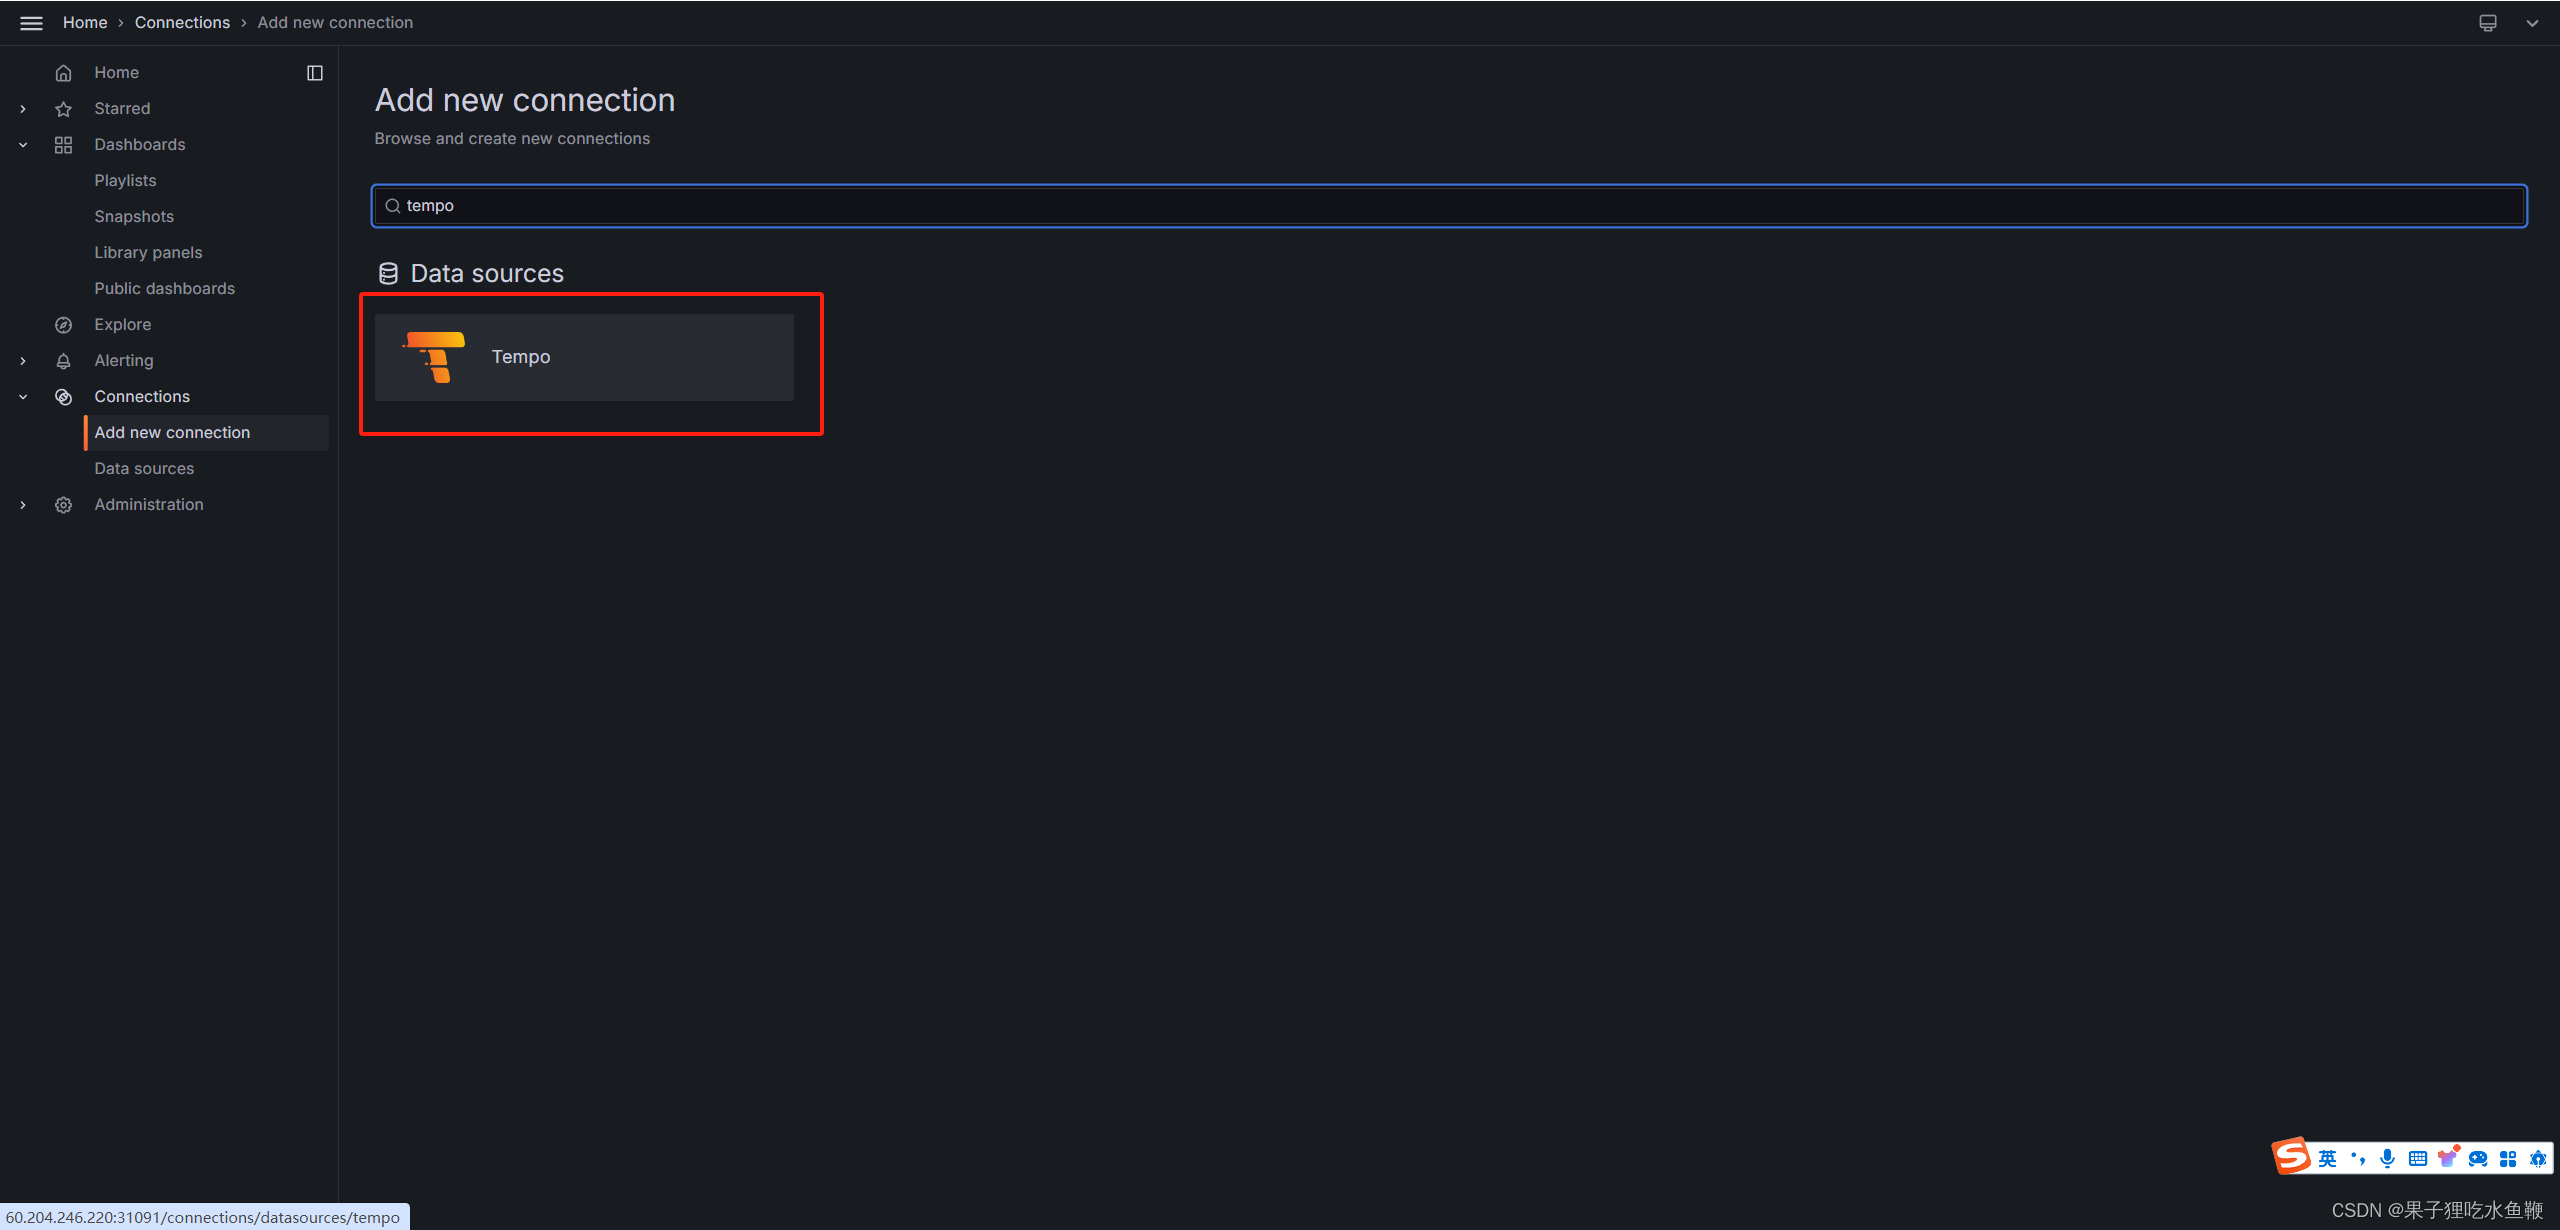
添加配置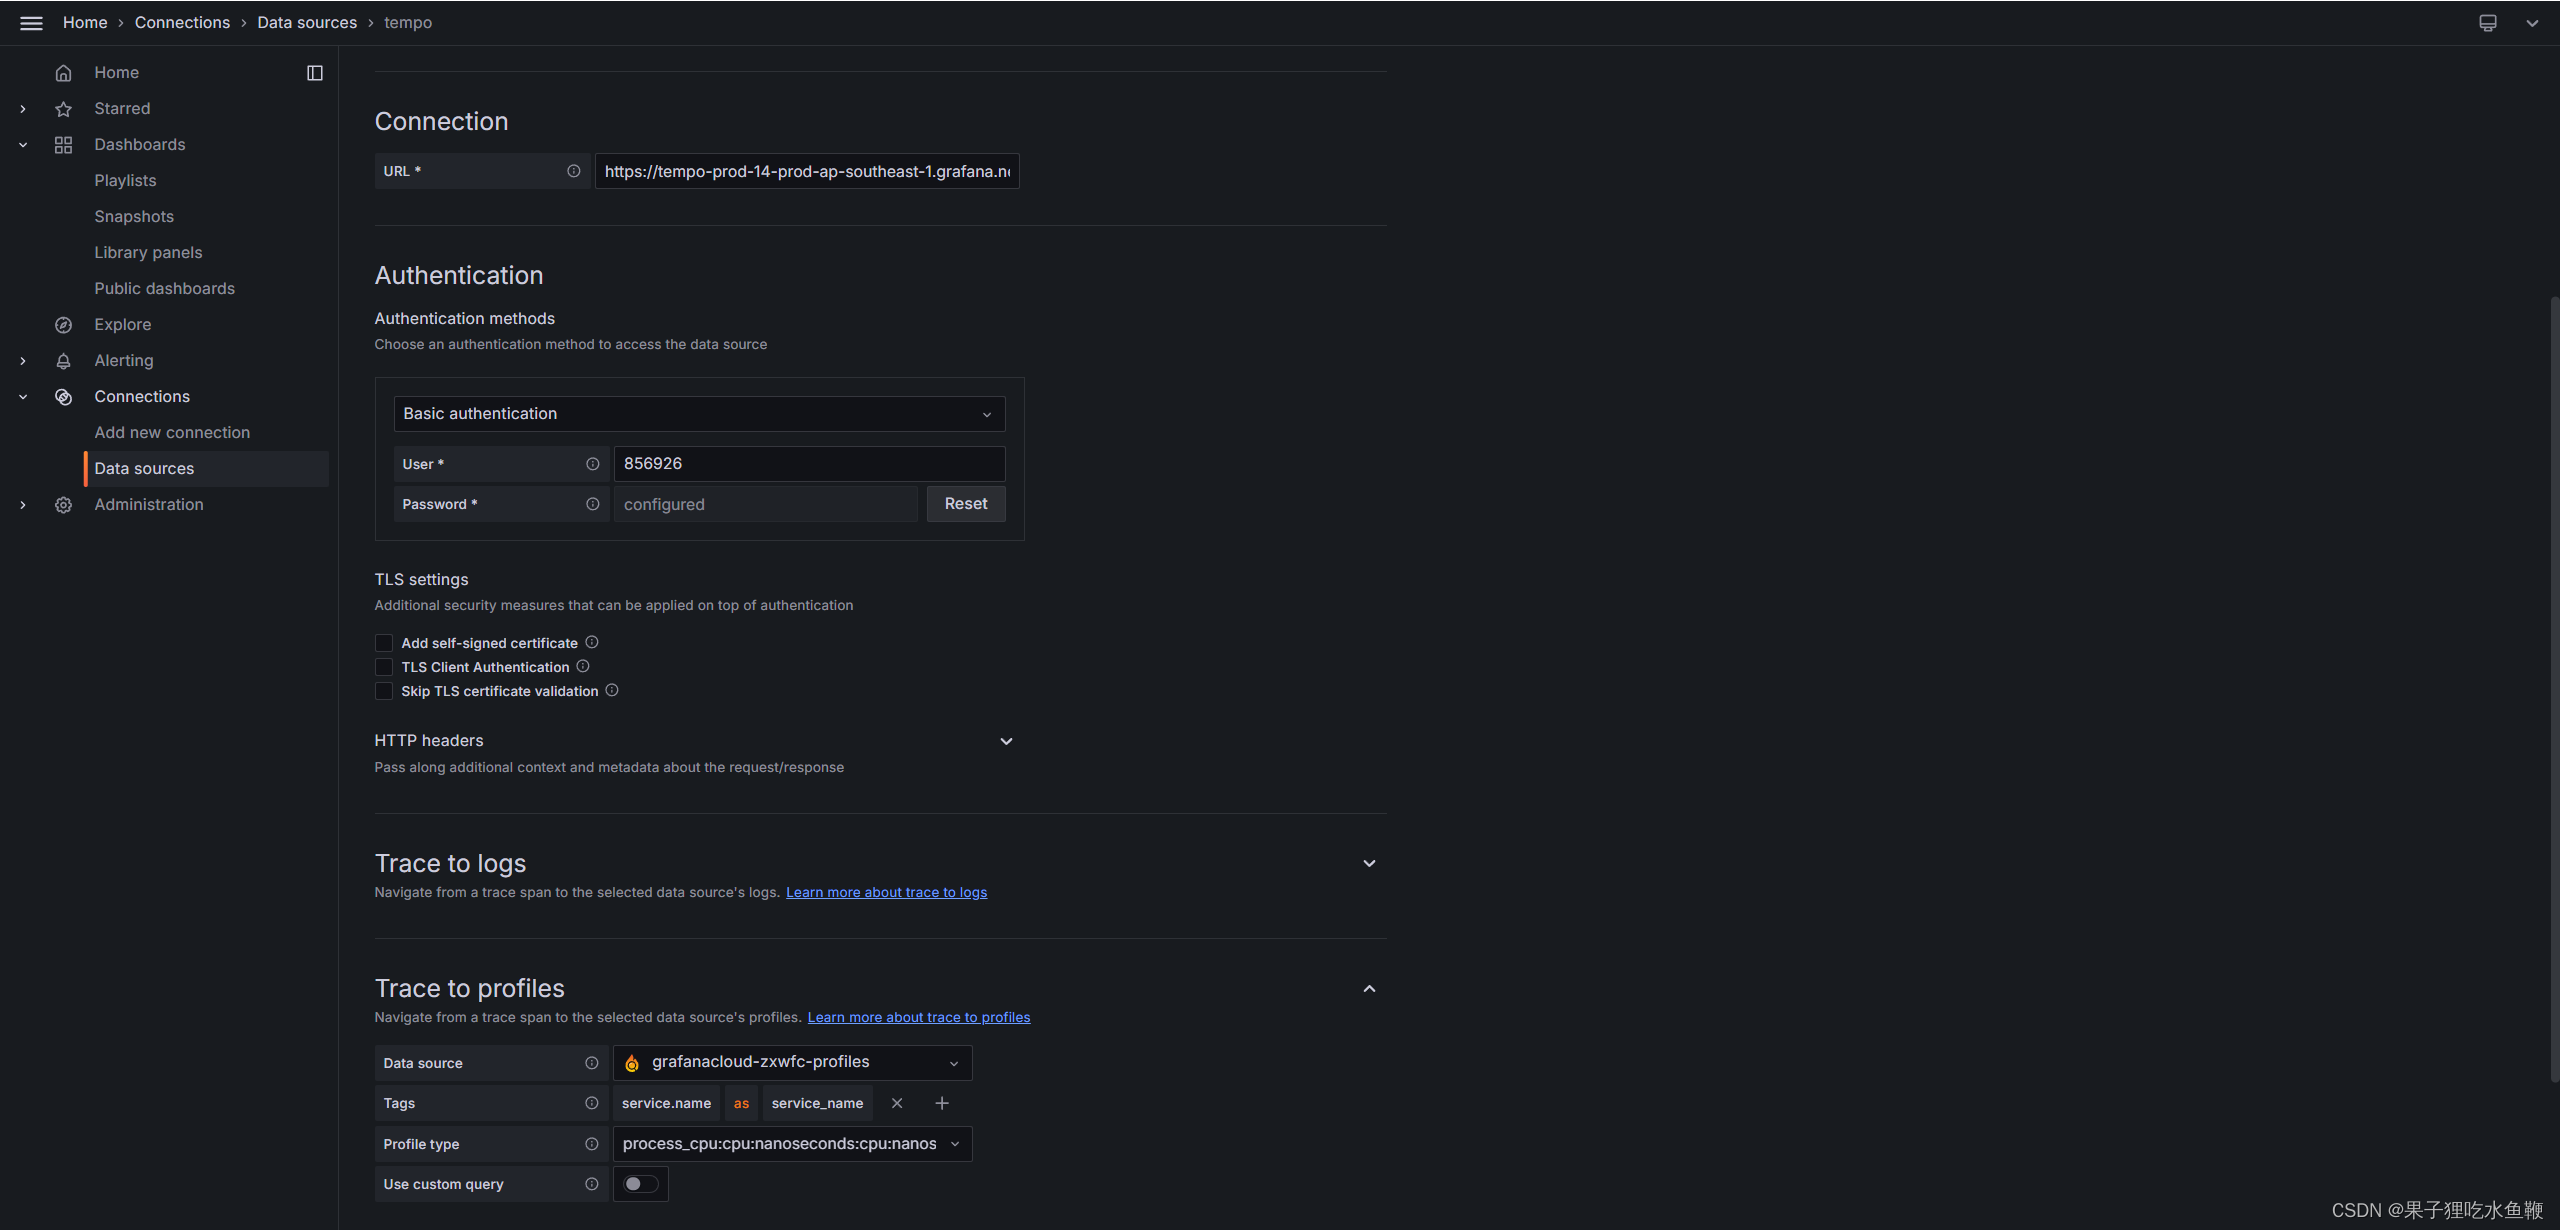
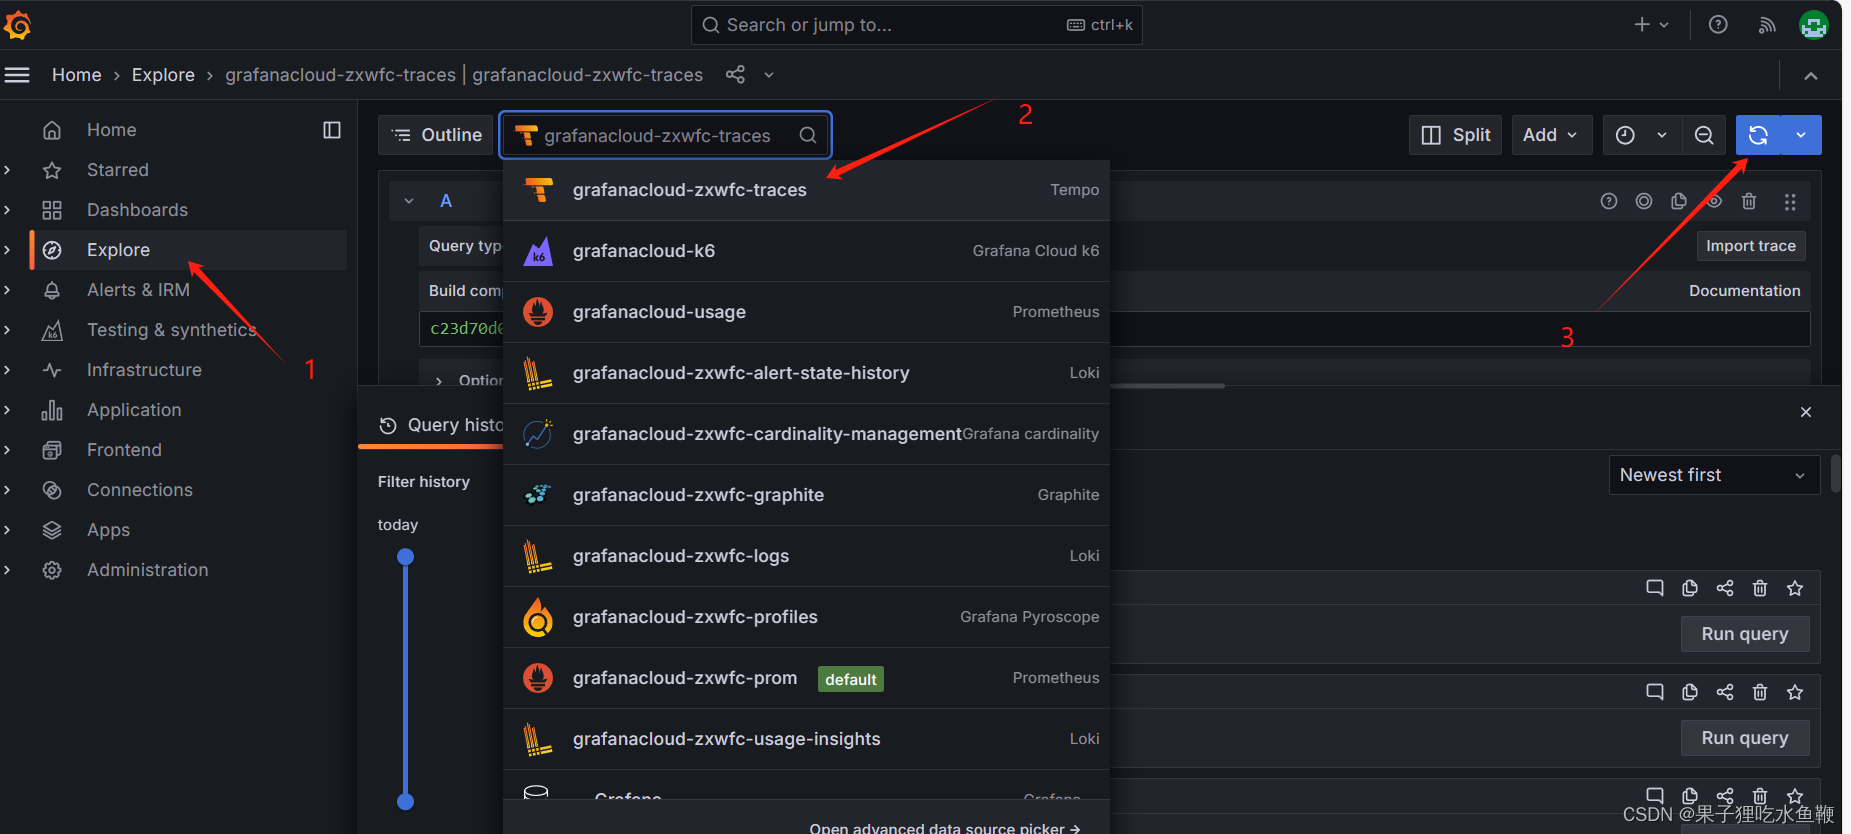
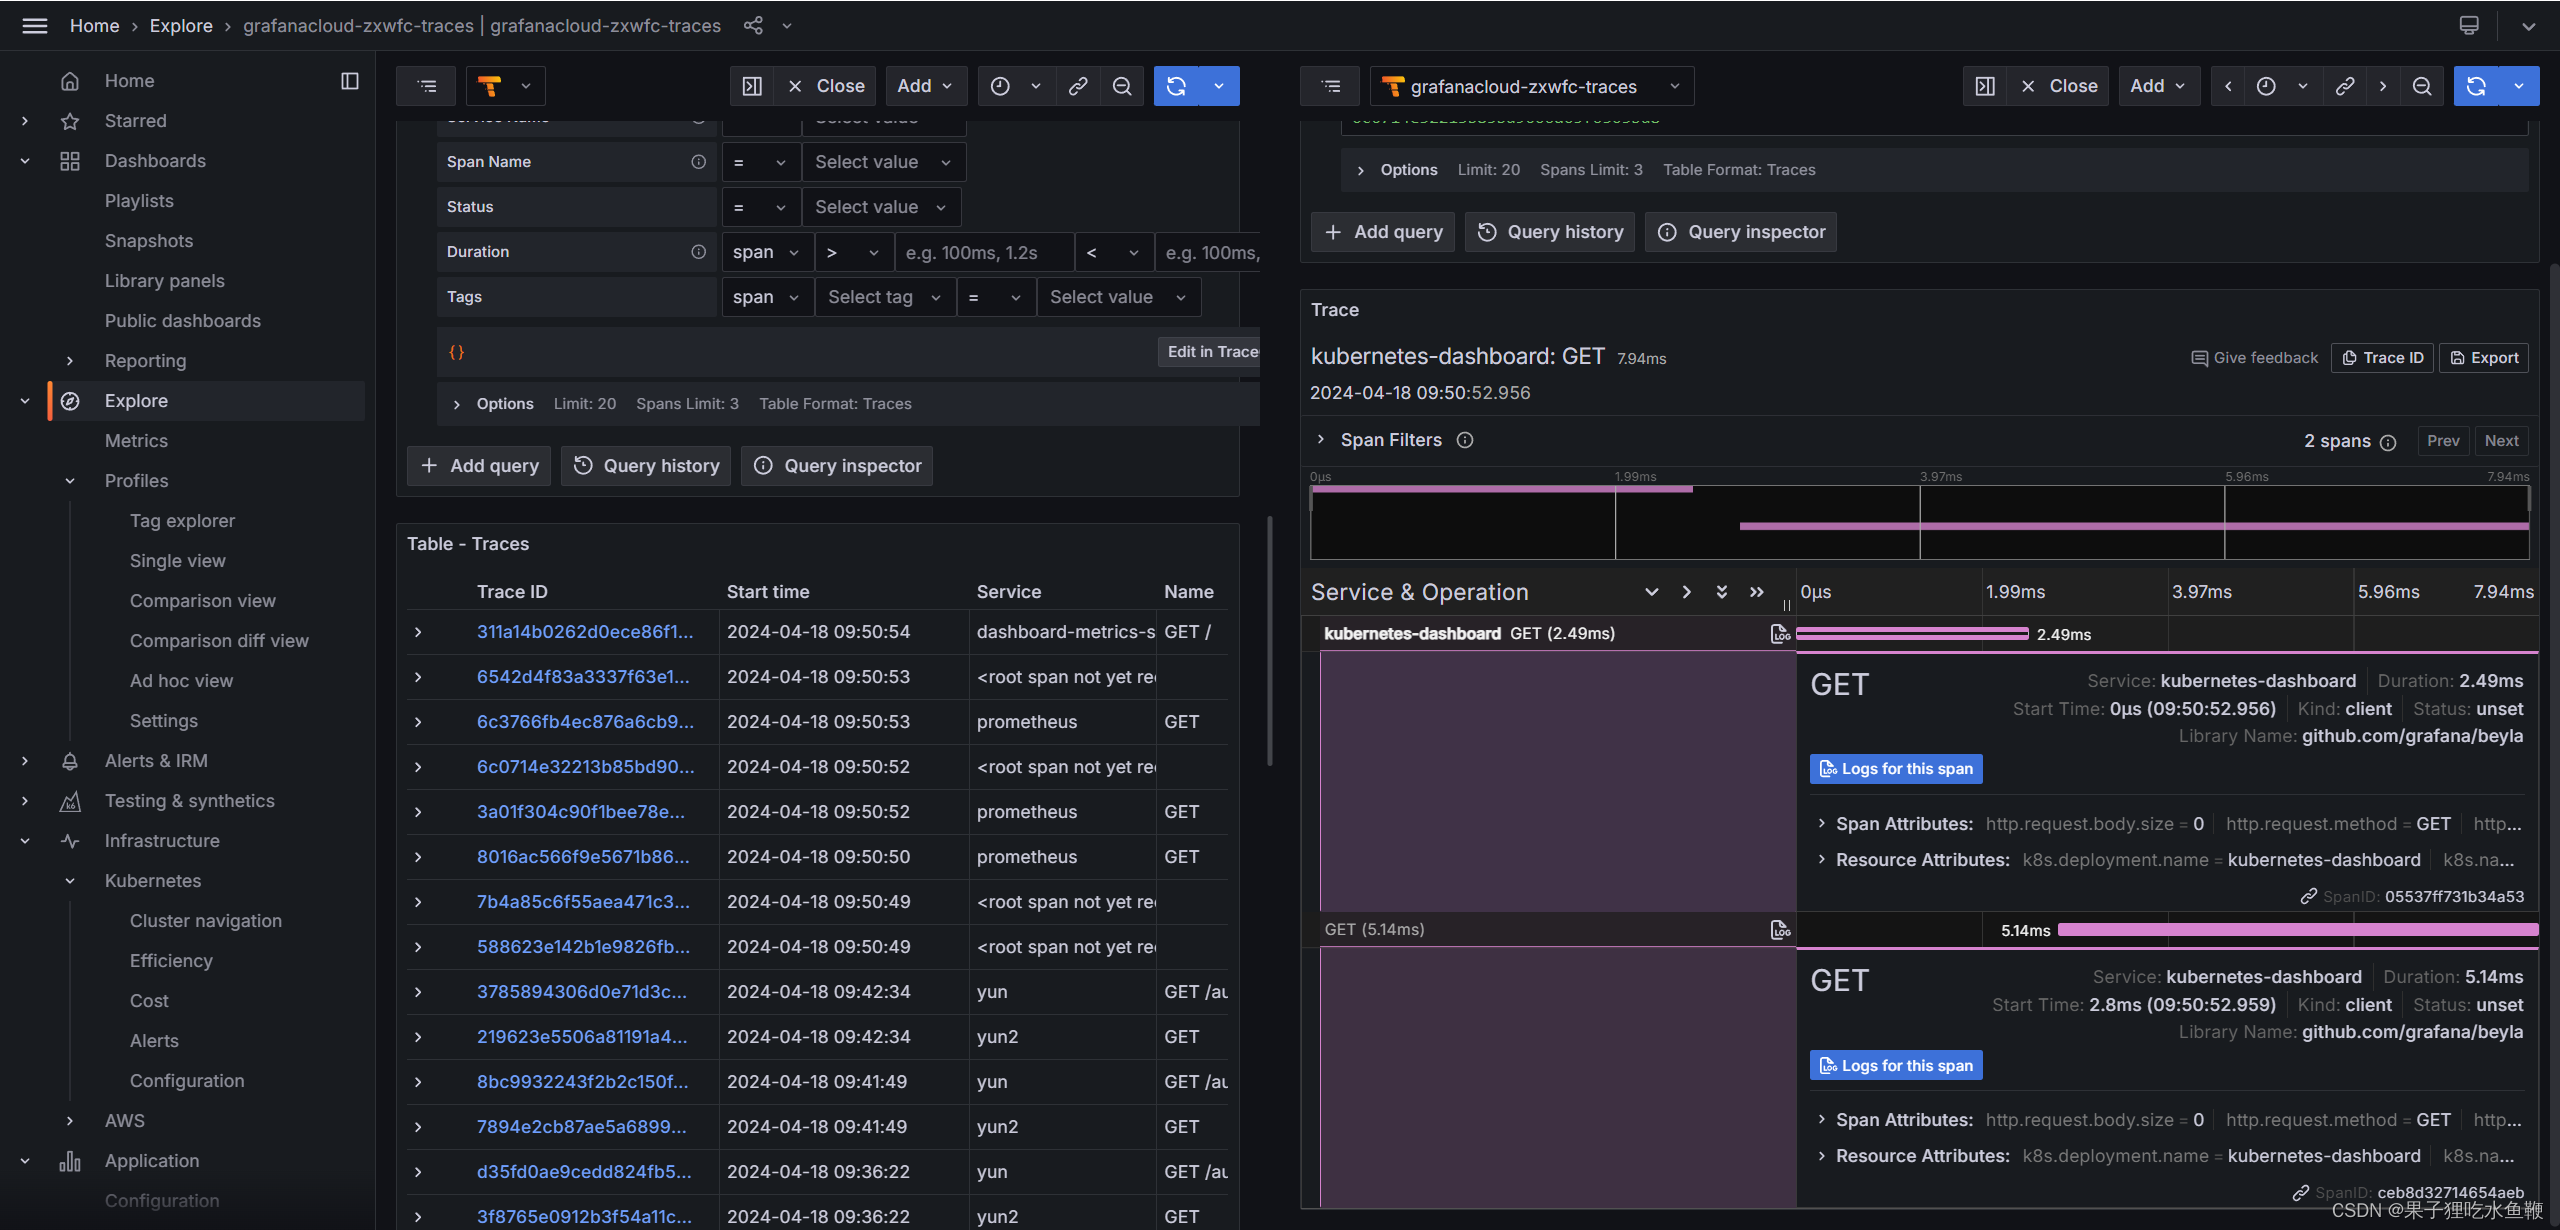
进入探索页签,选择tempo作为数据源点击搜索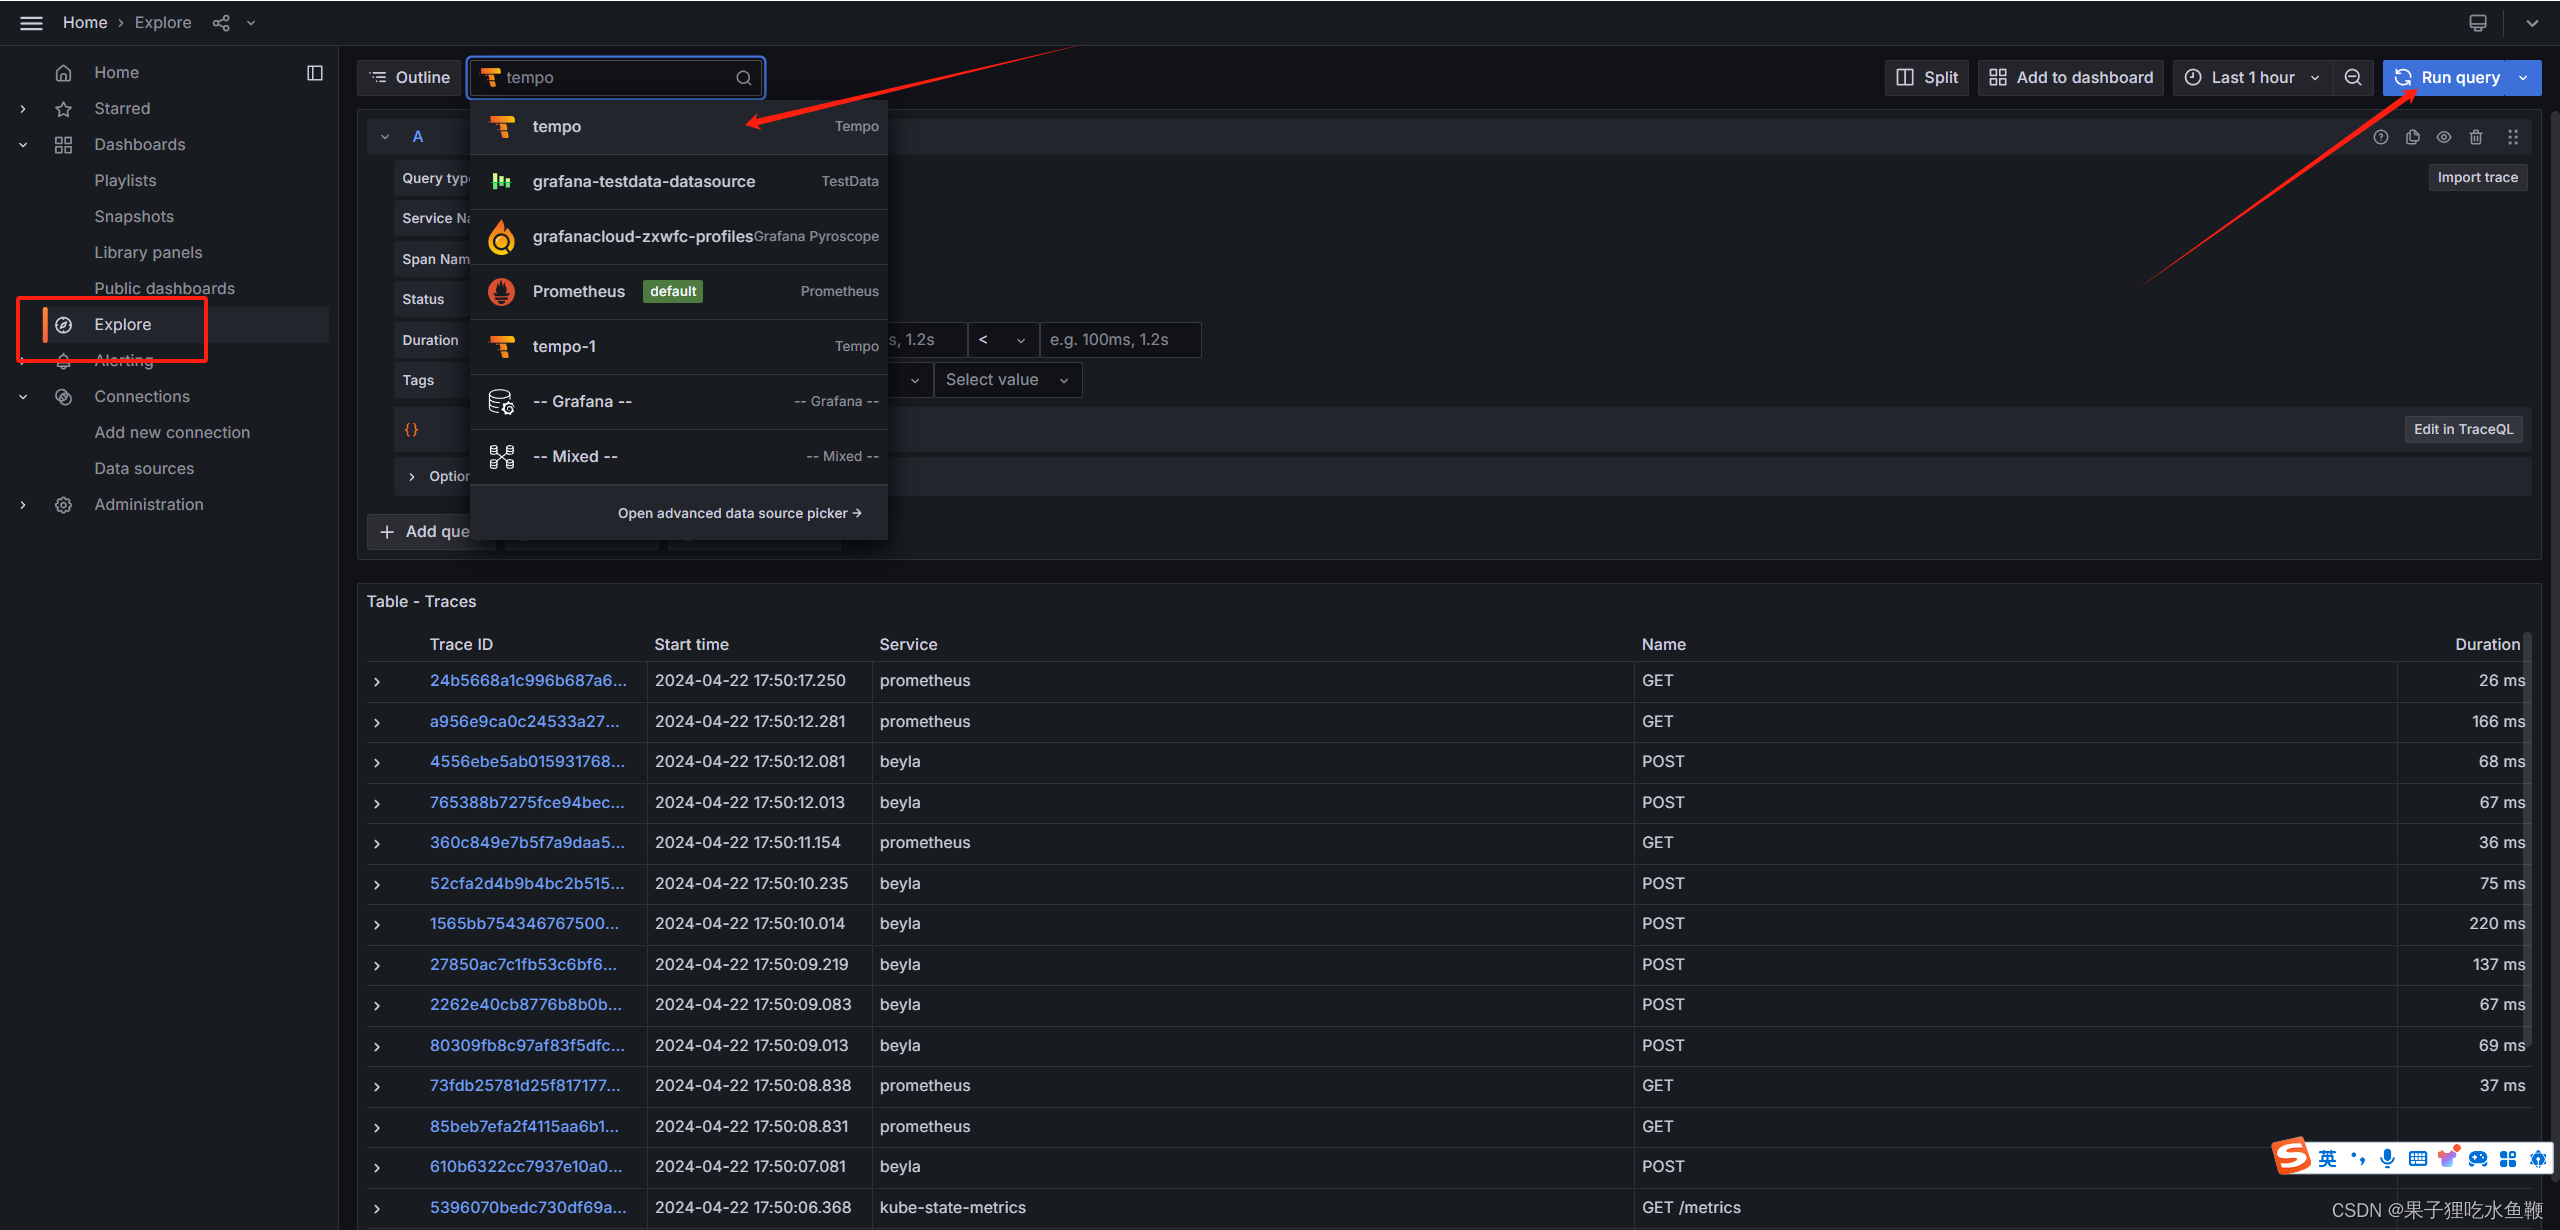
在部署beyla时将k8s_deployment_name的值修改为了^*$,这样就可以监控到所有的了。
trace数据展示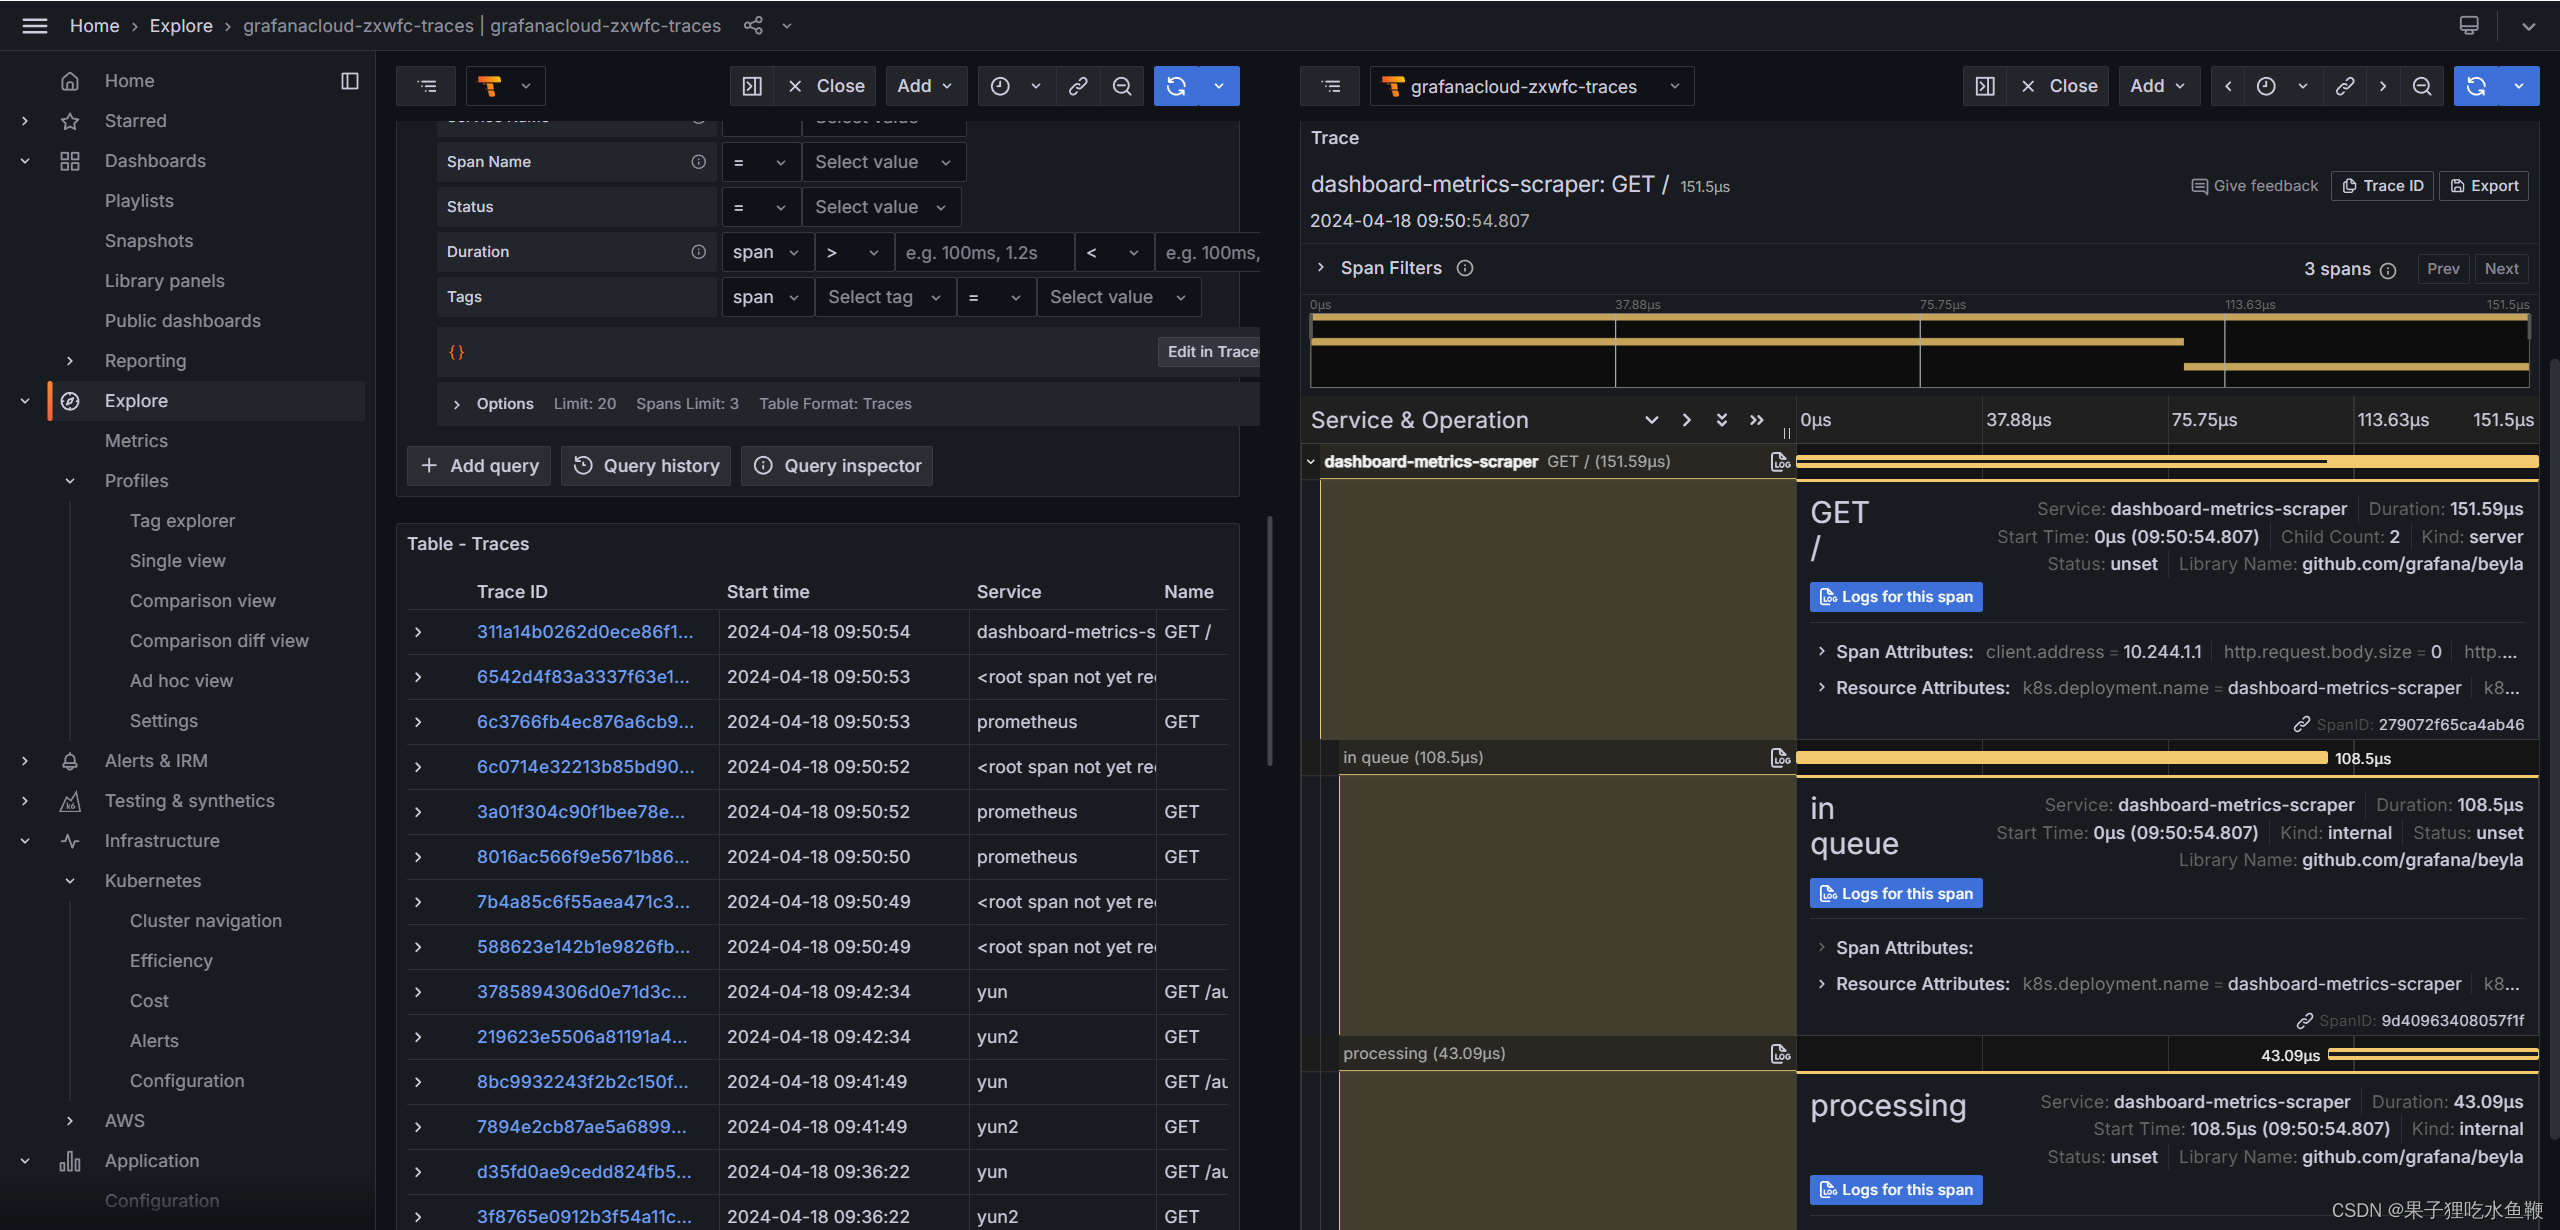
3.2.10利用grafana cloud的云组件实现火焰图的展示
3.2.10.1grafana Pyroscope令牌生成
进入cloud个人空间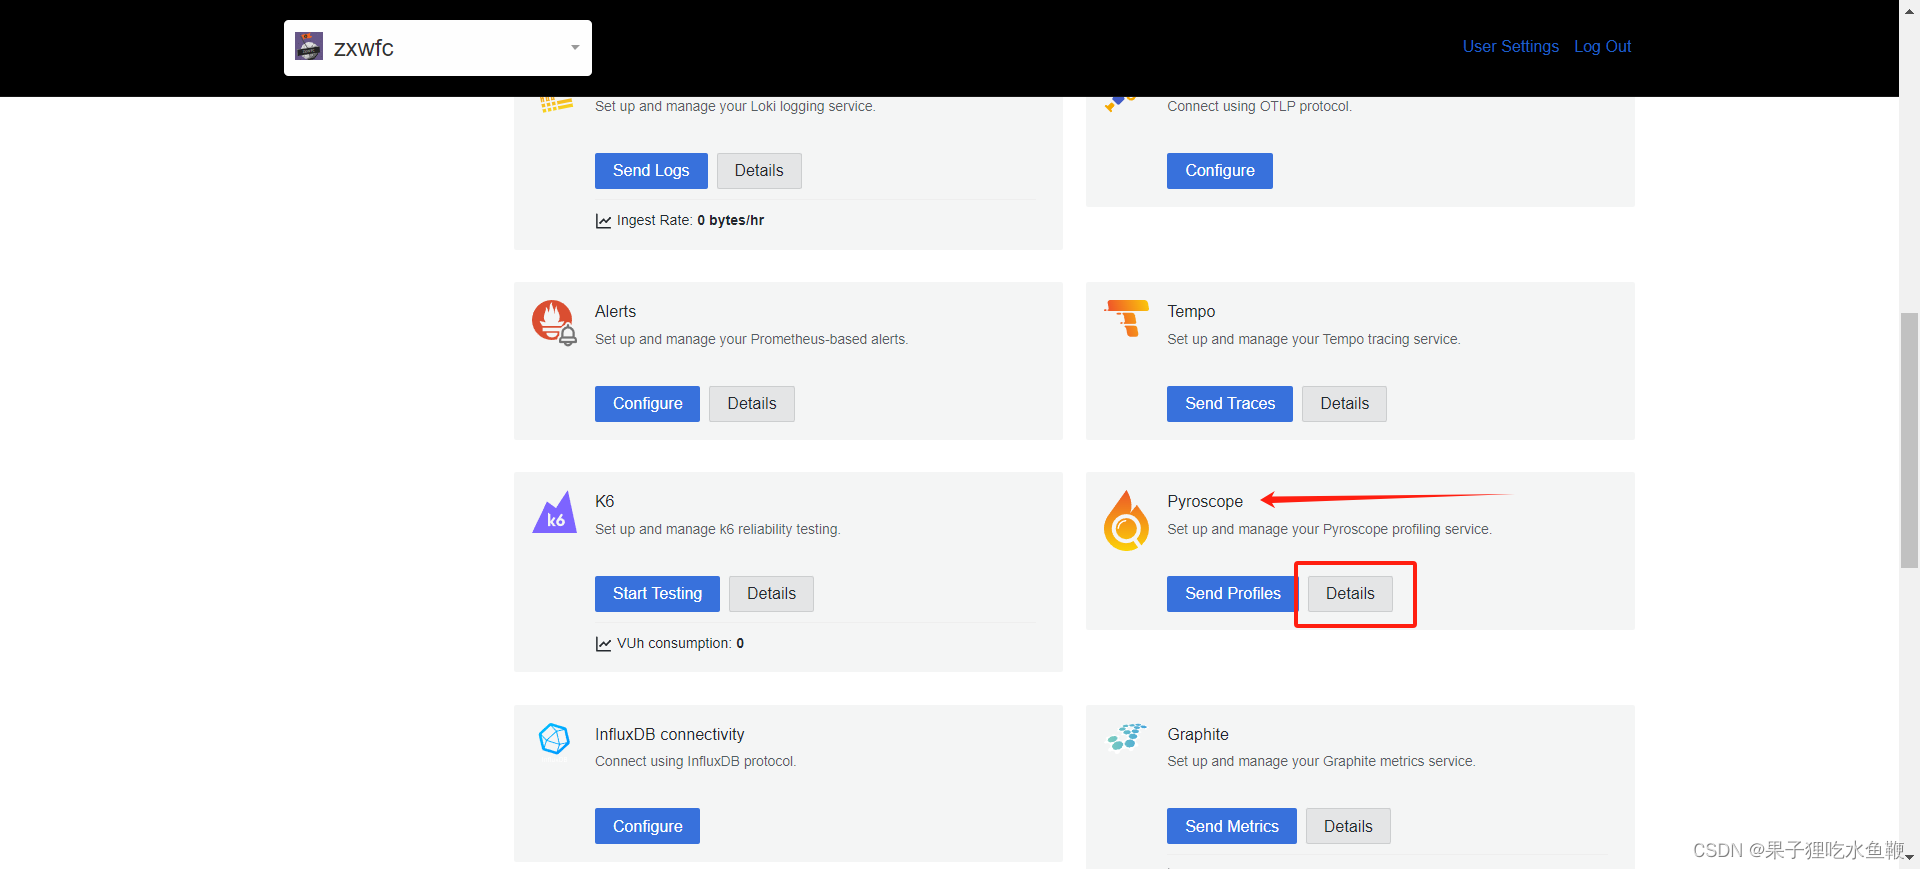
生成密码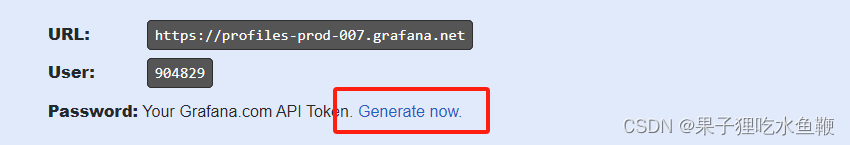
3.2.10.2部署grafana agent
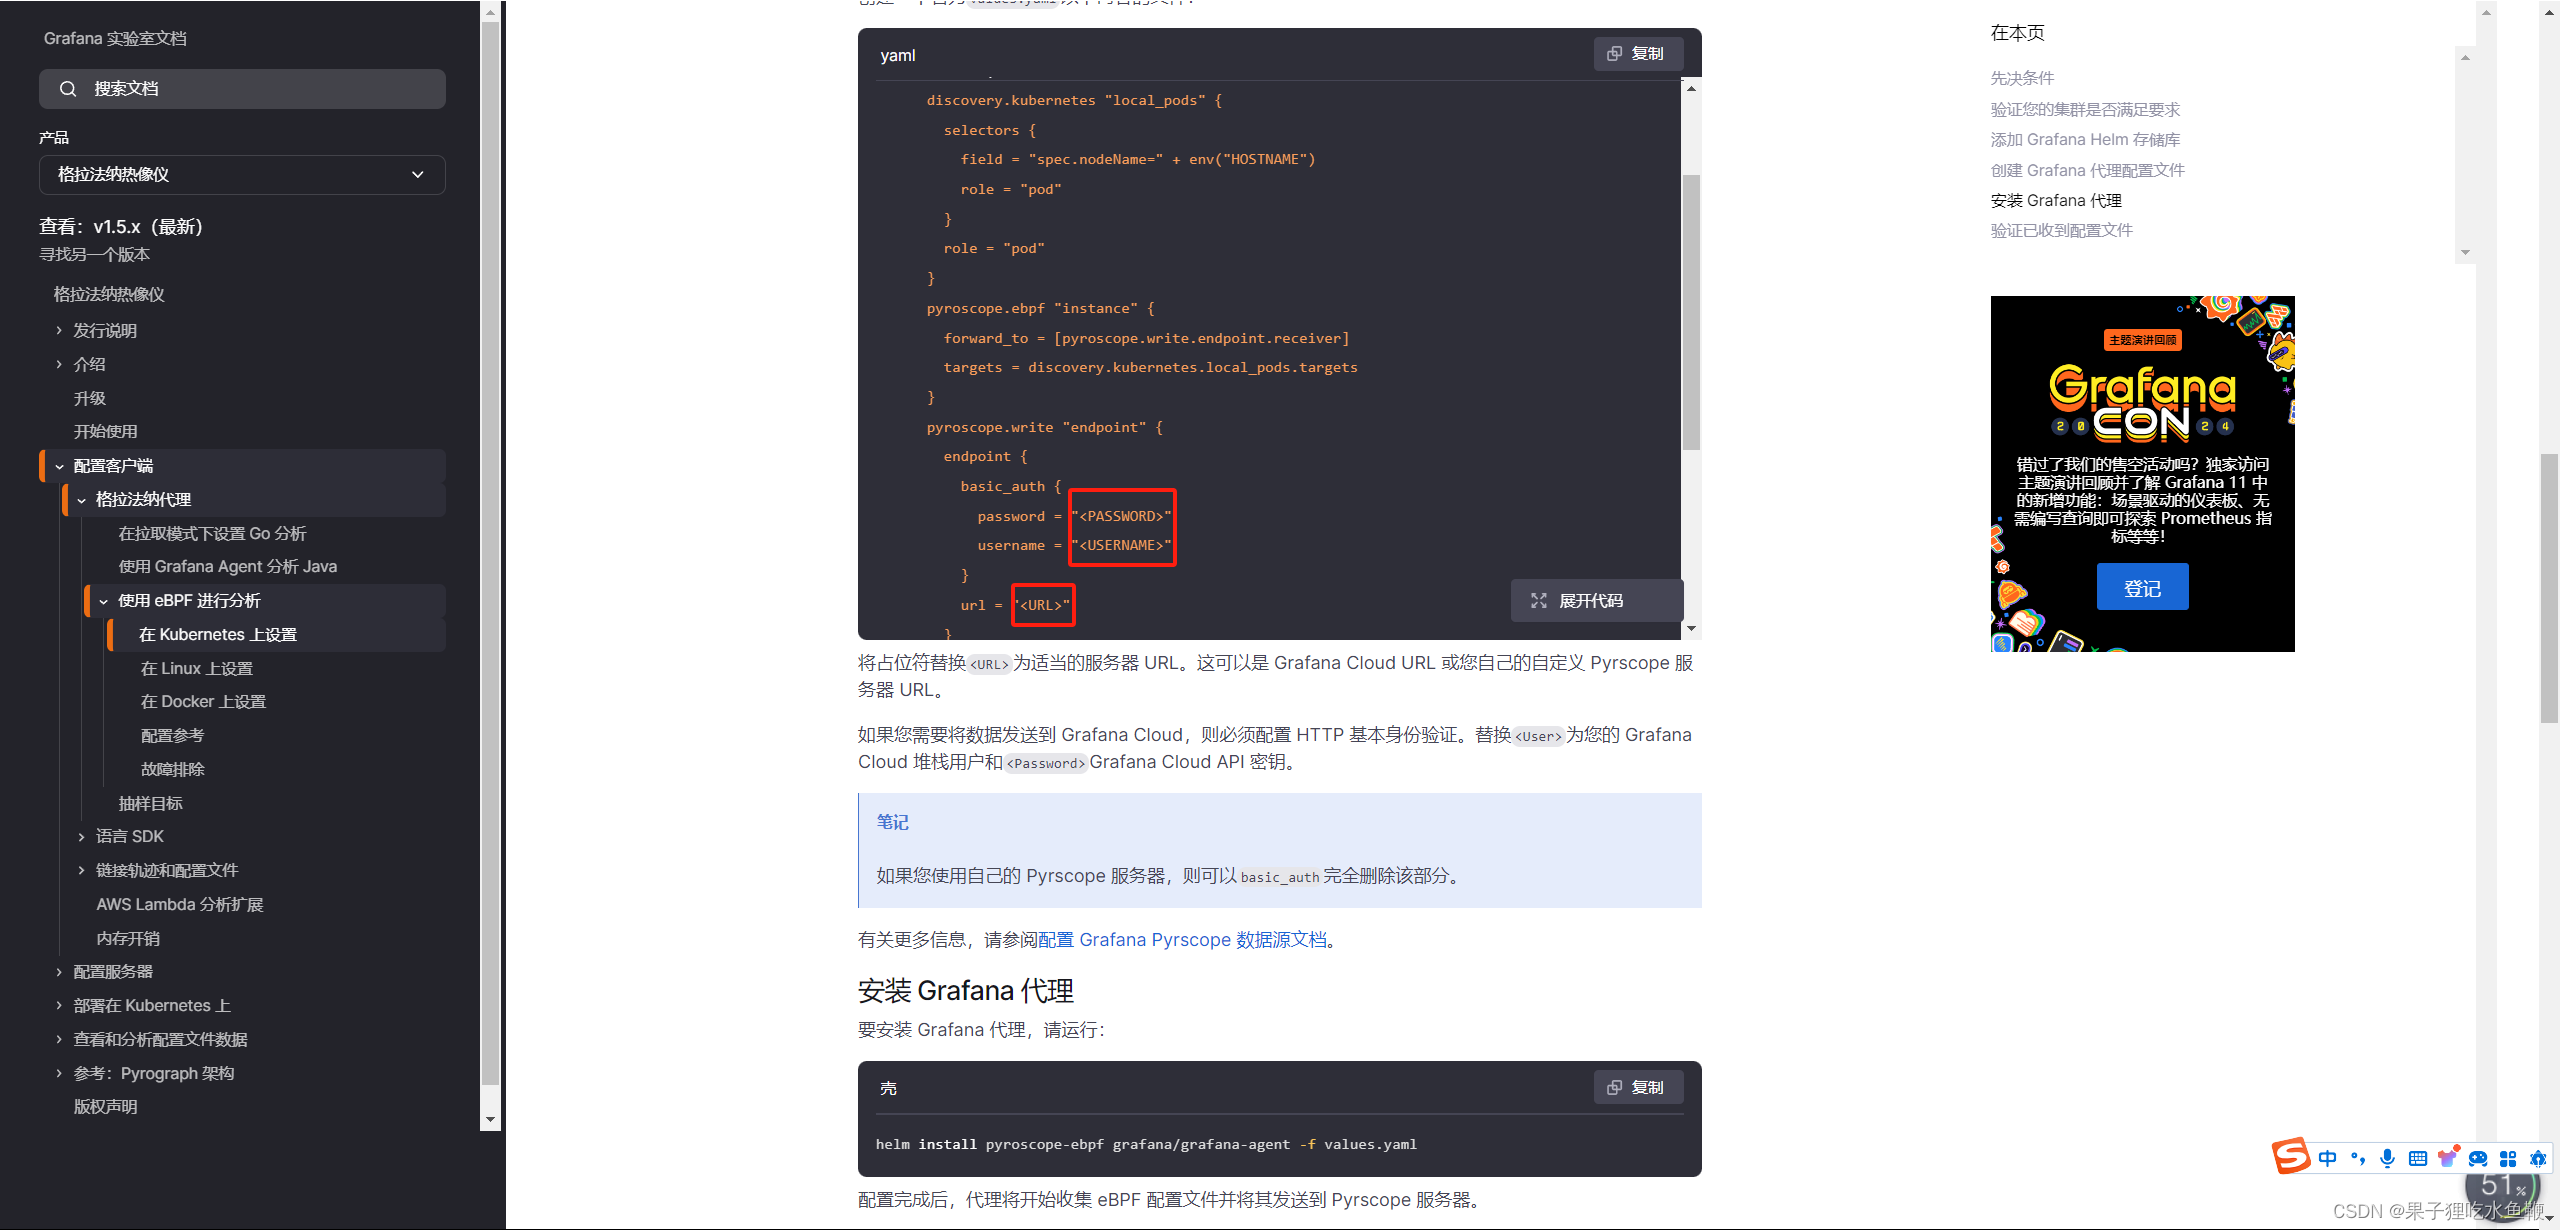
如果拥有主机权限,可以直接按照官方文档提示的helm方式安装(方便很多)
原文:Setup eBPF Profiling on Kubernetes | Grafana Pyroscope documentation
只需修改这三个参数即可
查看启动日志无报错信息后即可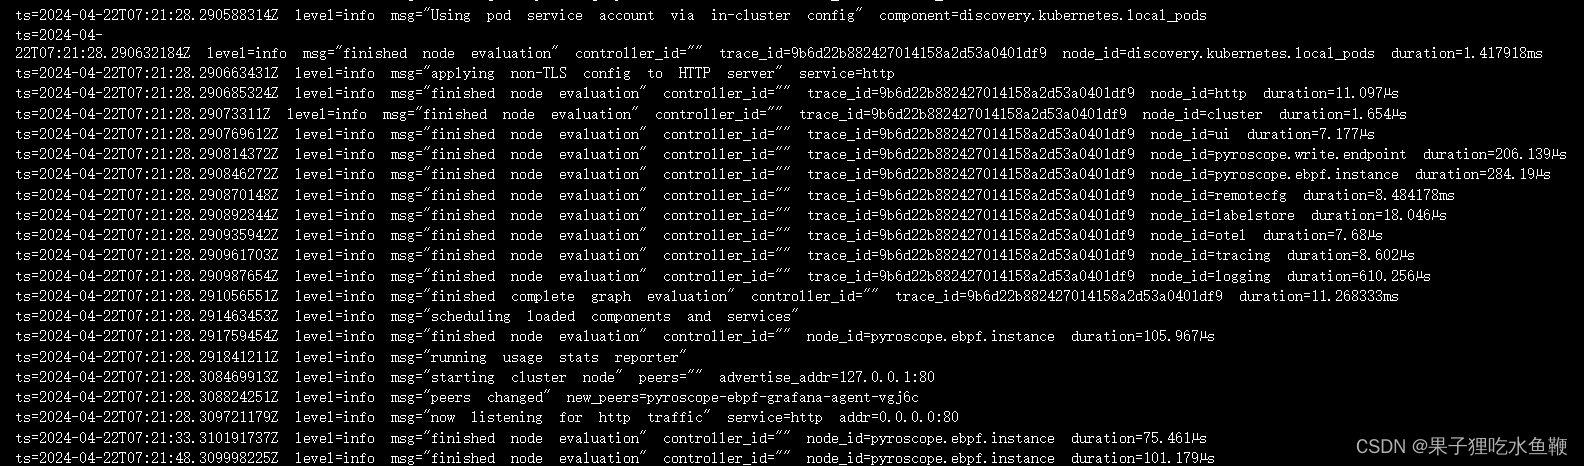
3.2.10.3添加grafana-server数据源
之前已经成功部署了grafana-server作为可视化平台,添加数据源。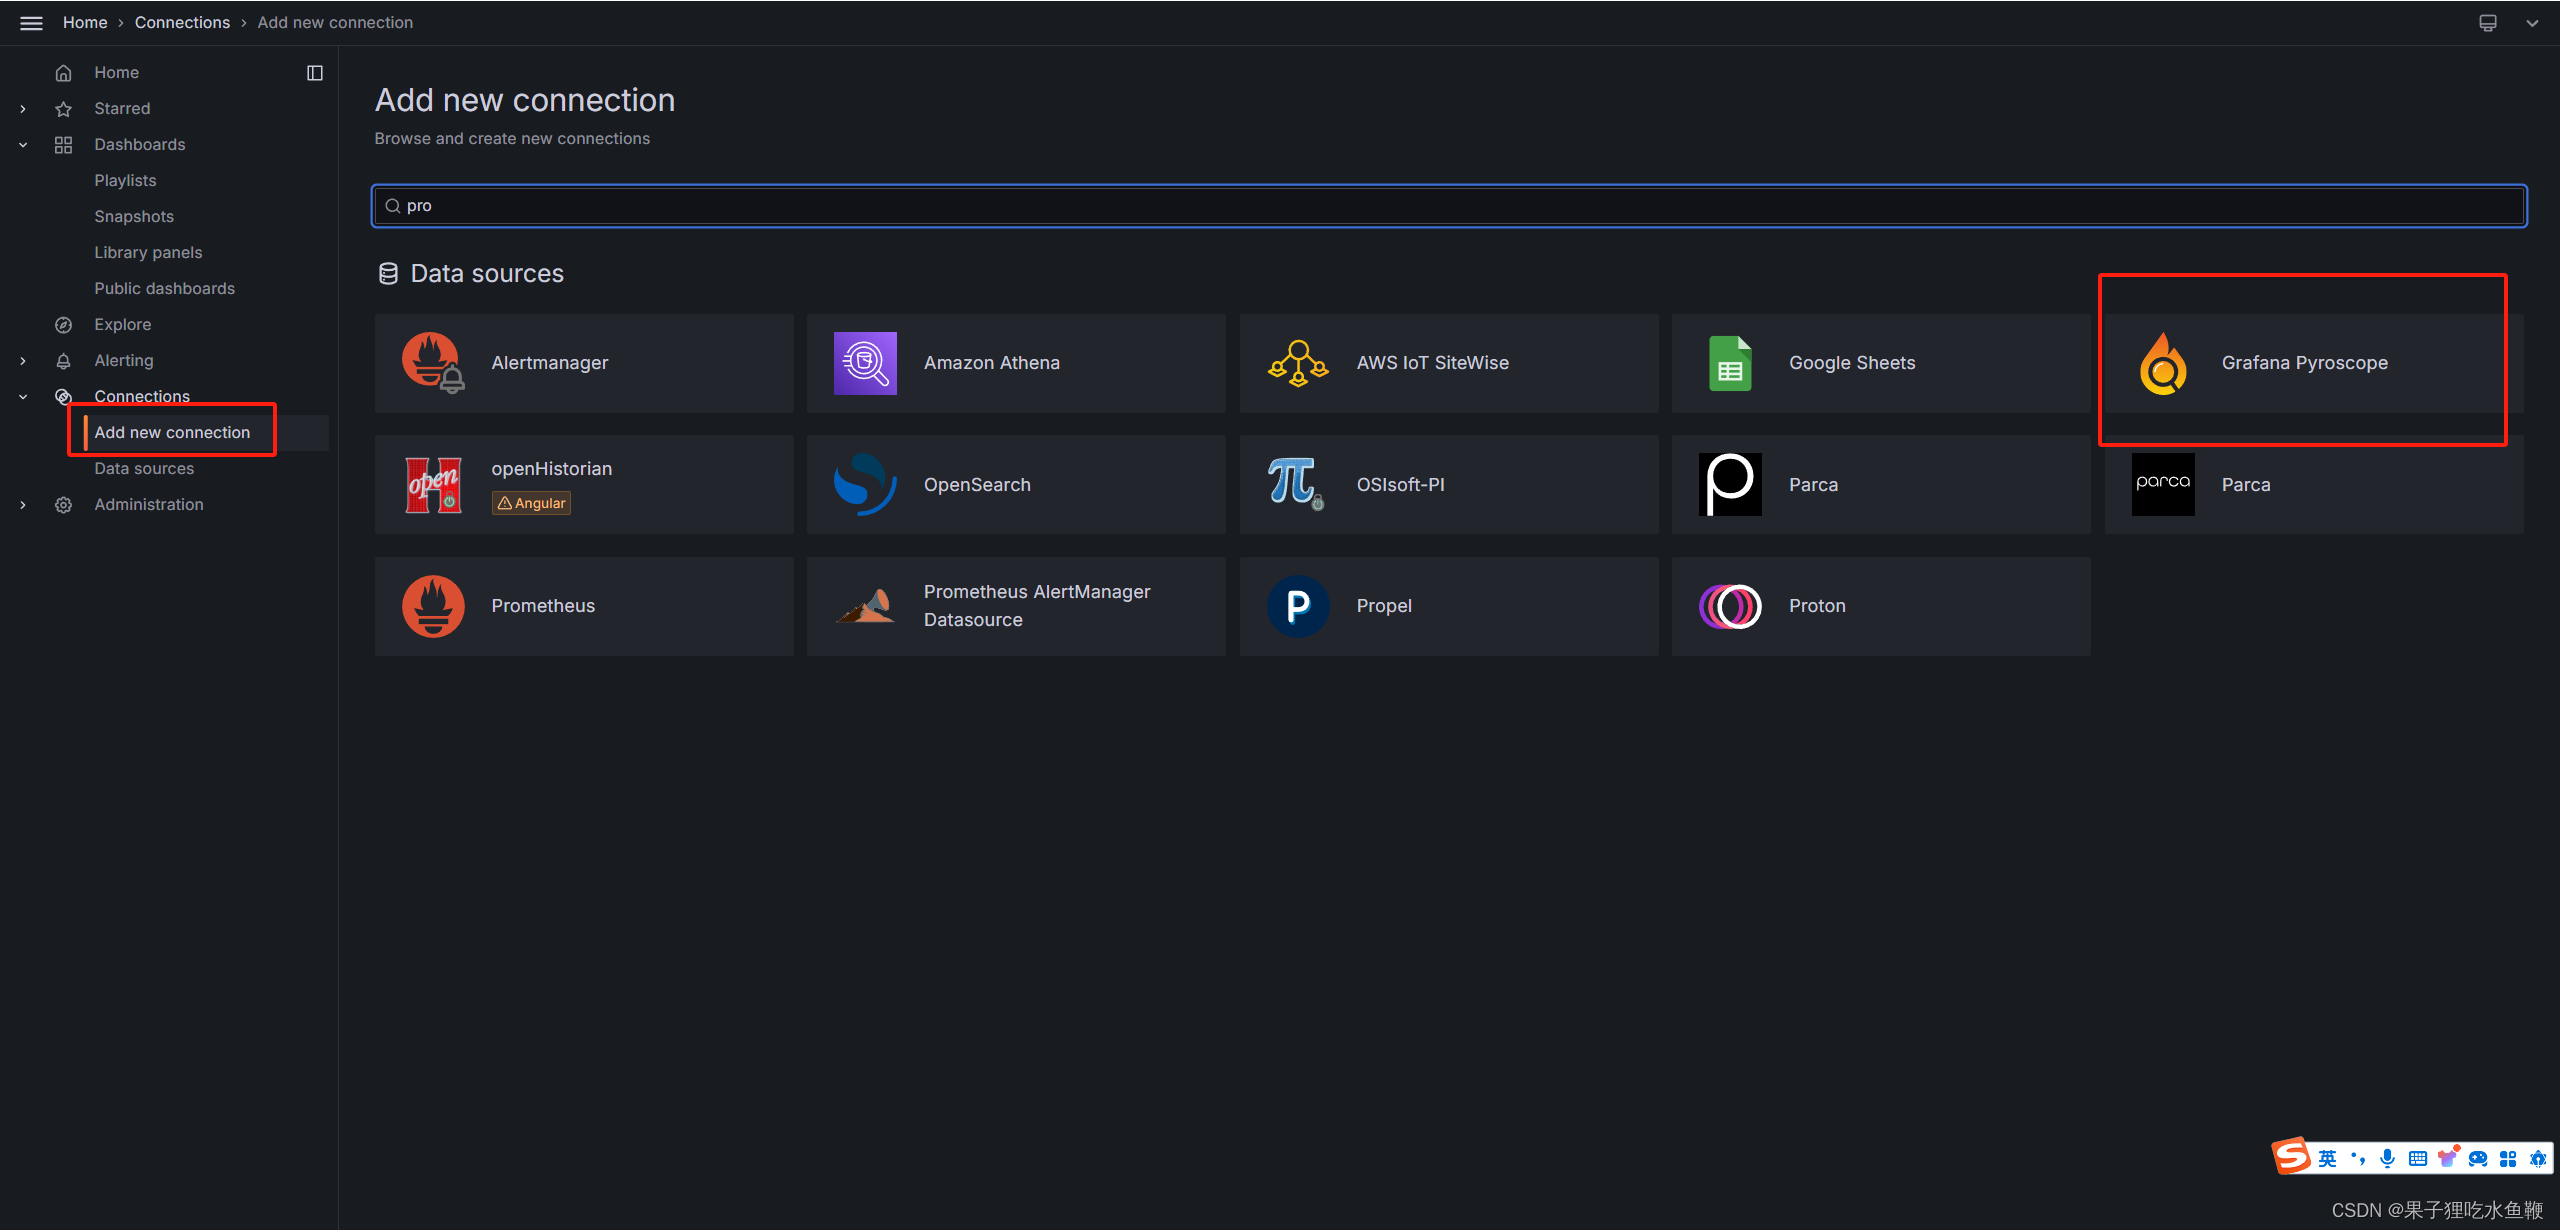
添加配置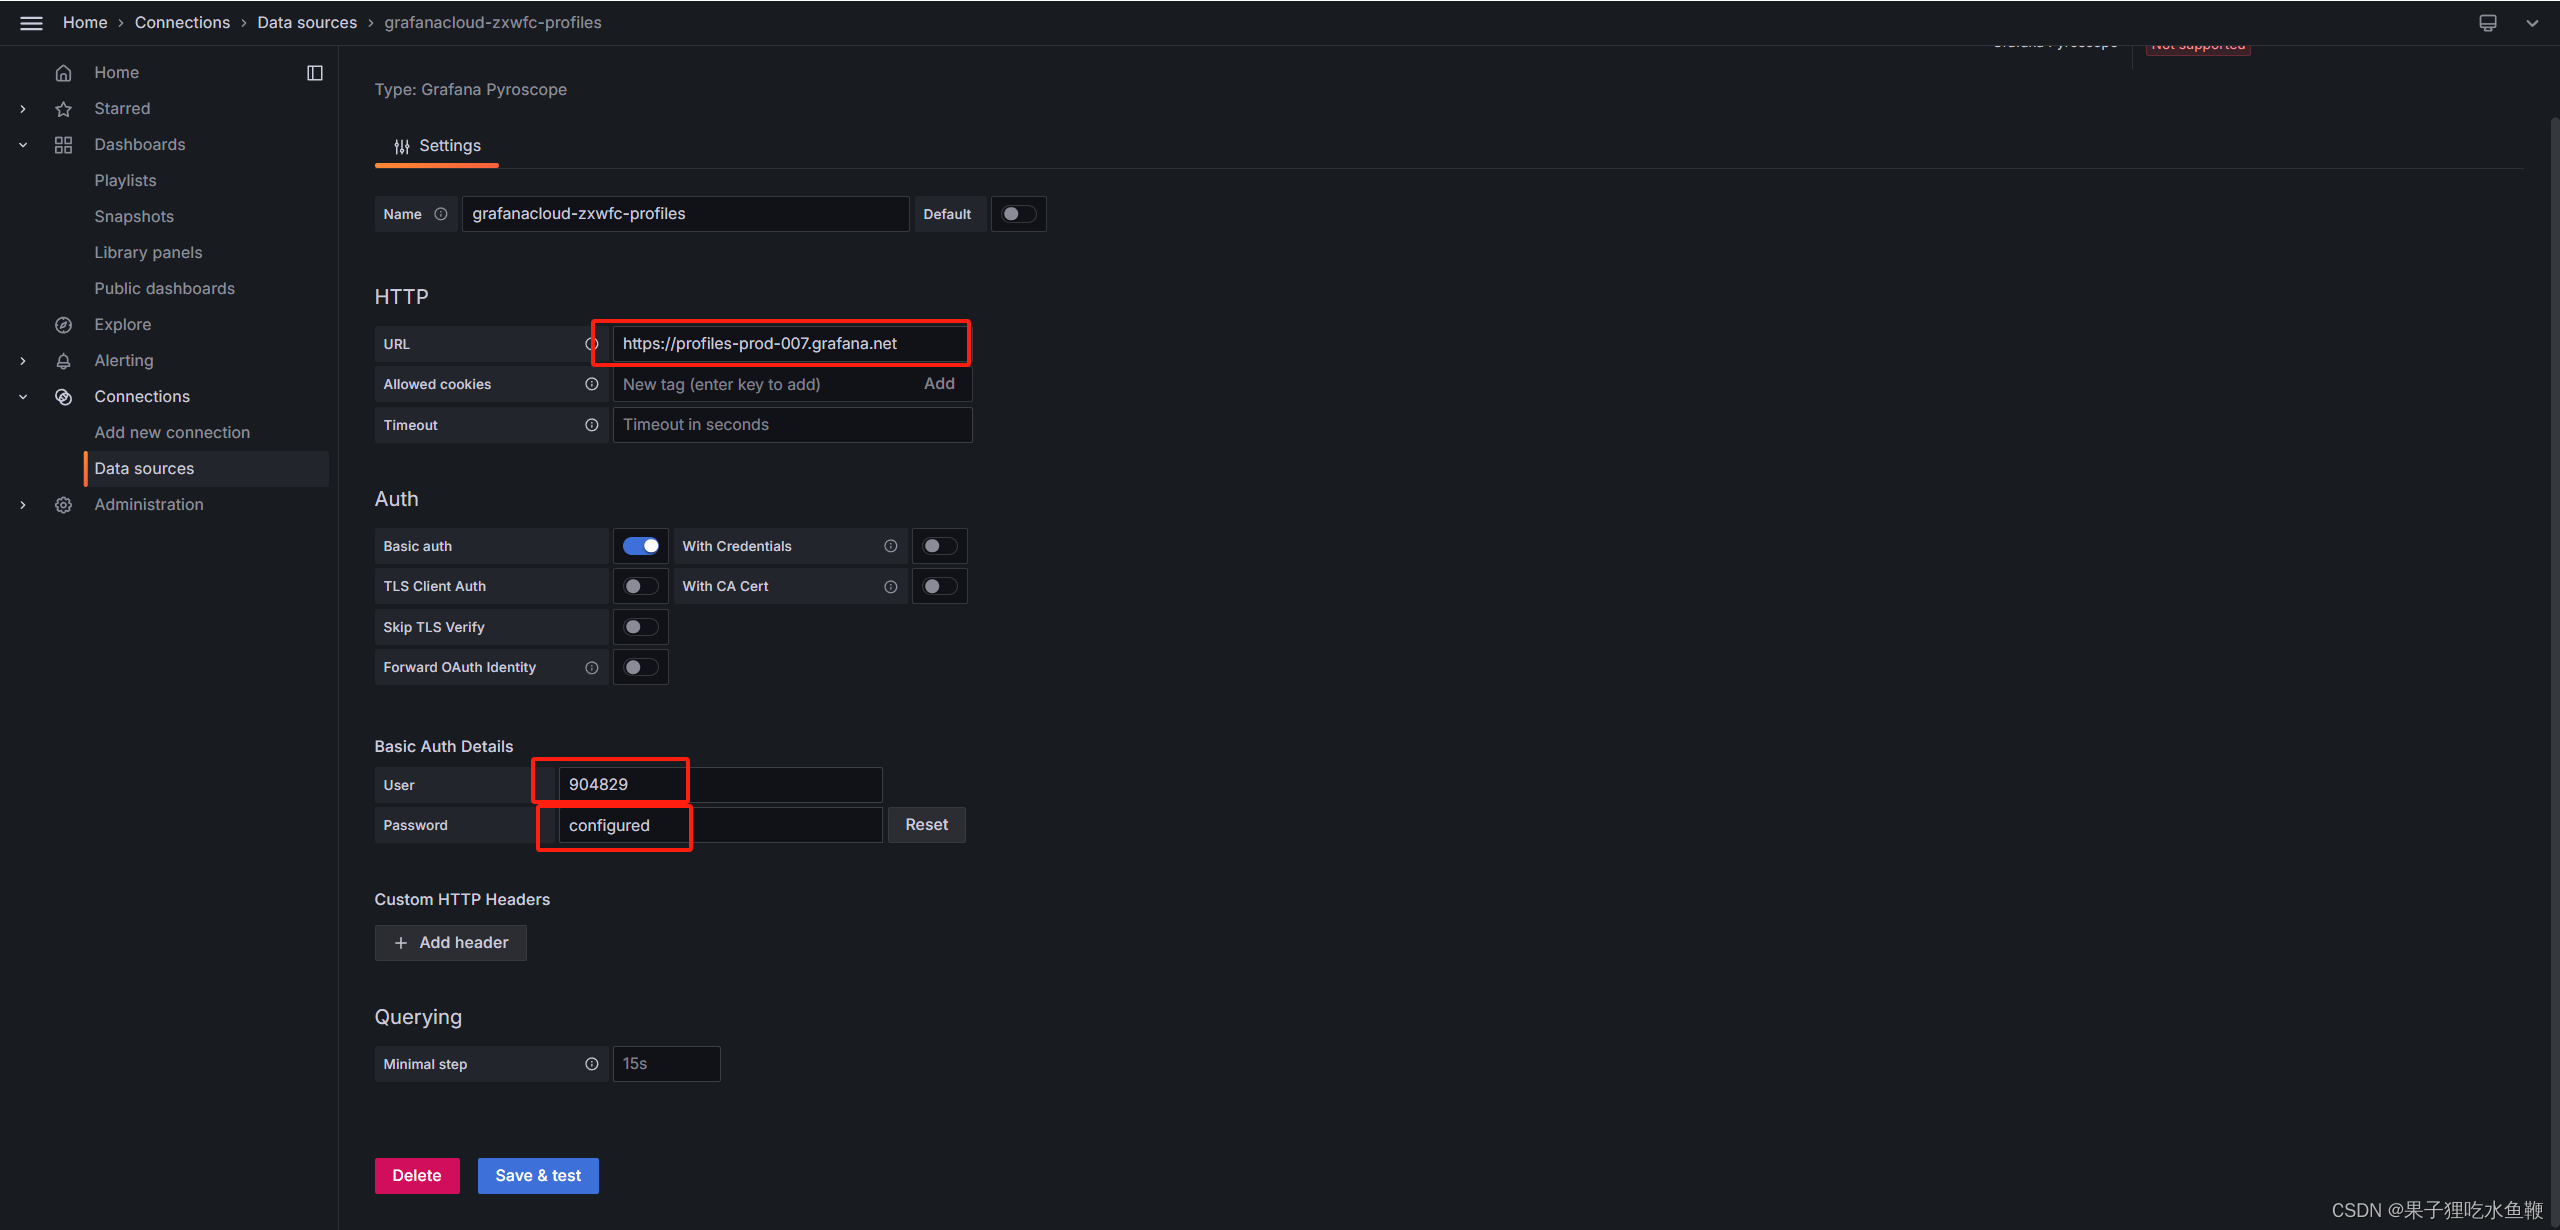
火焰图展示效果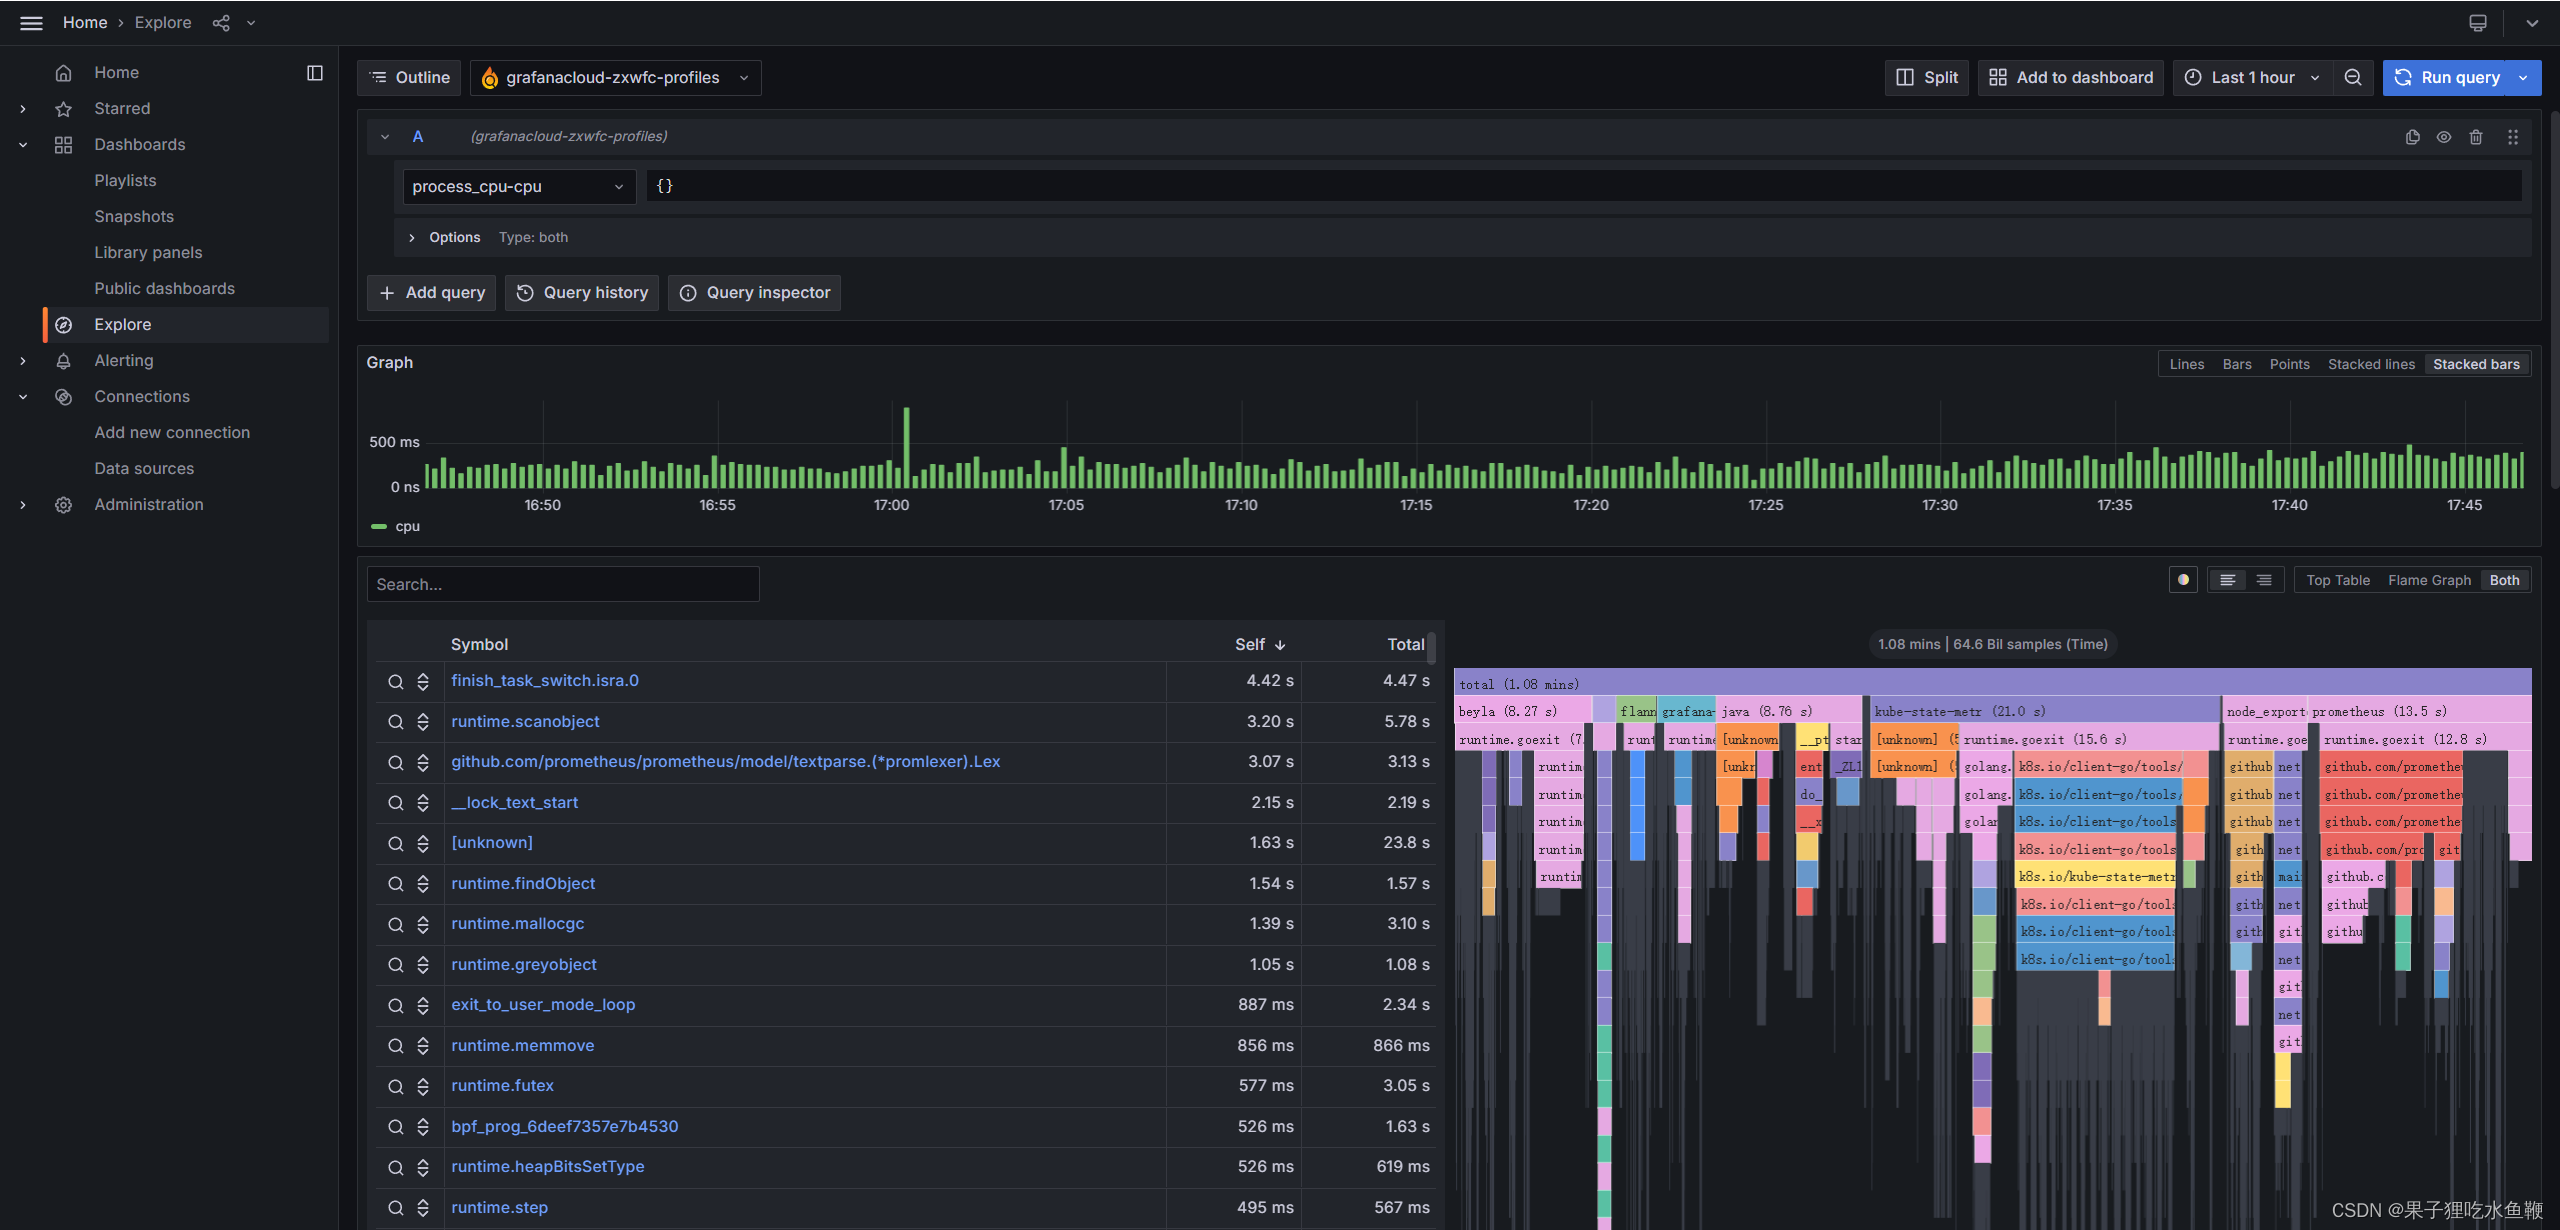
可以通过servicename做筛选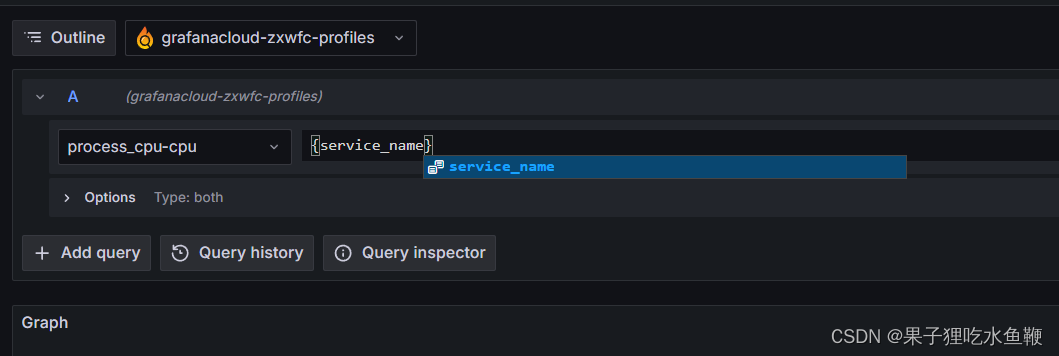
go服务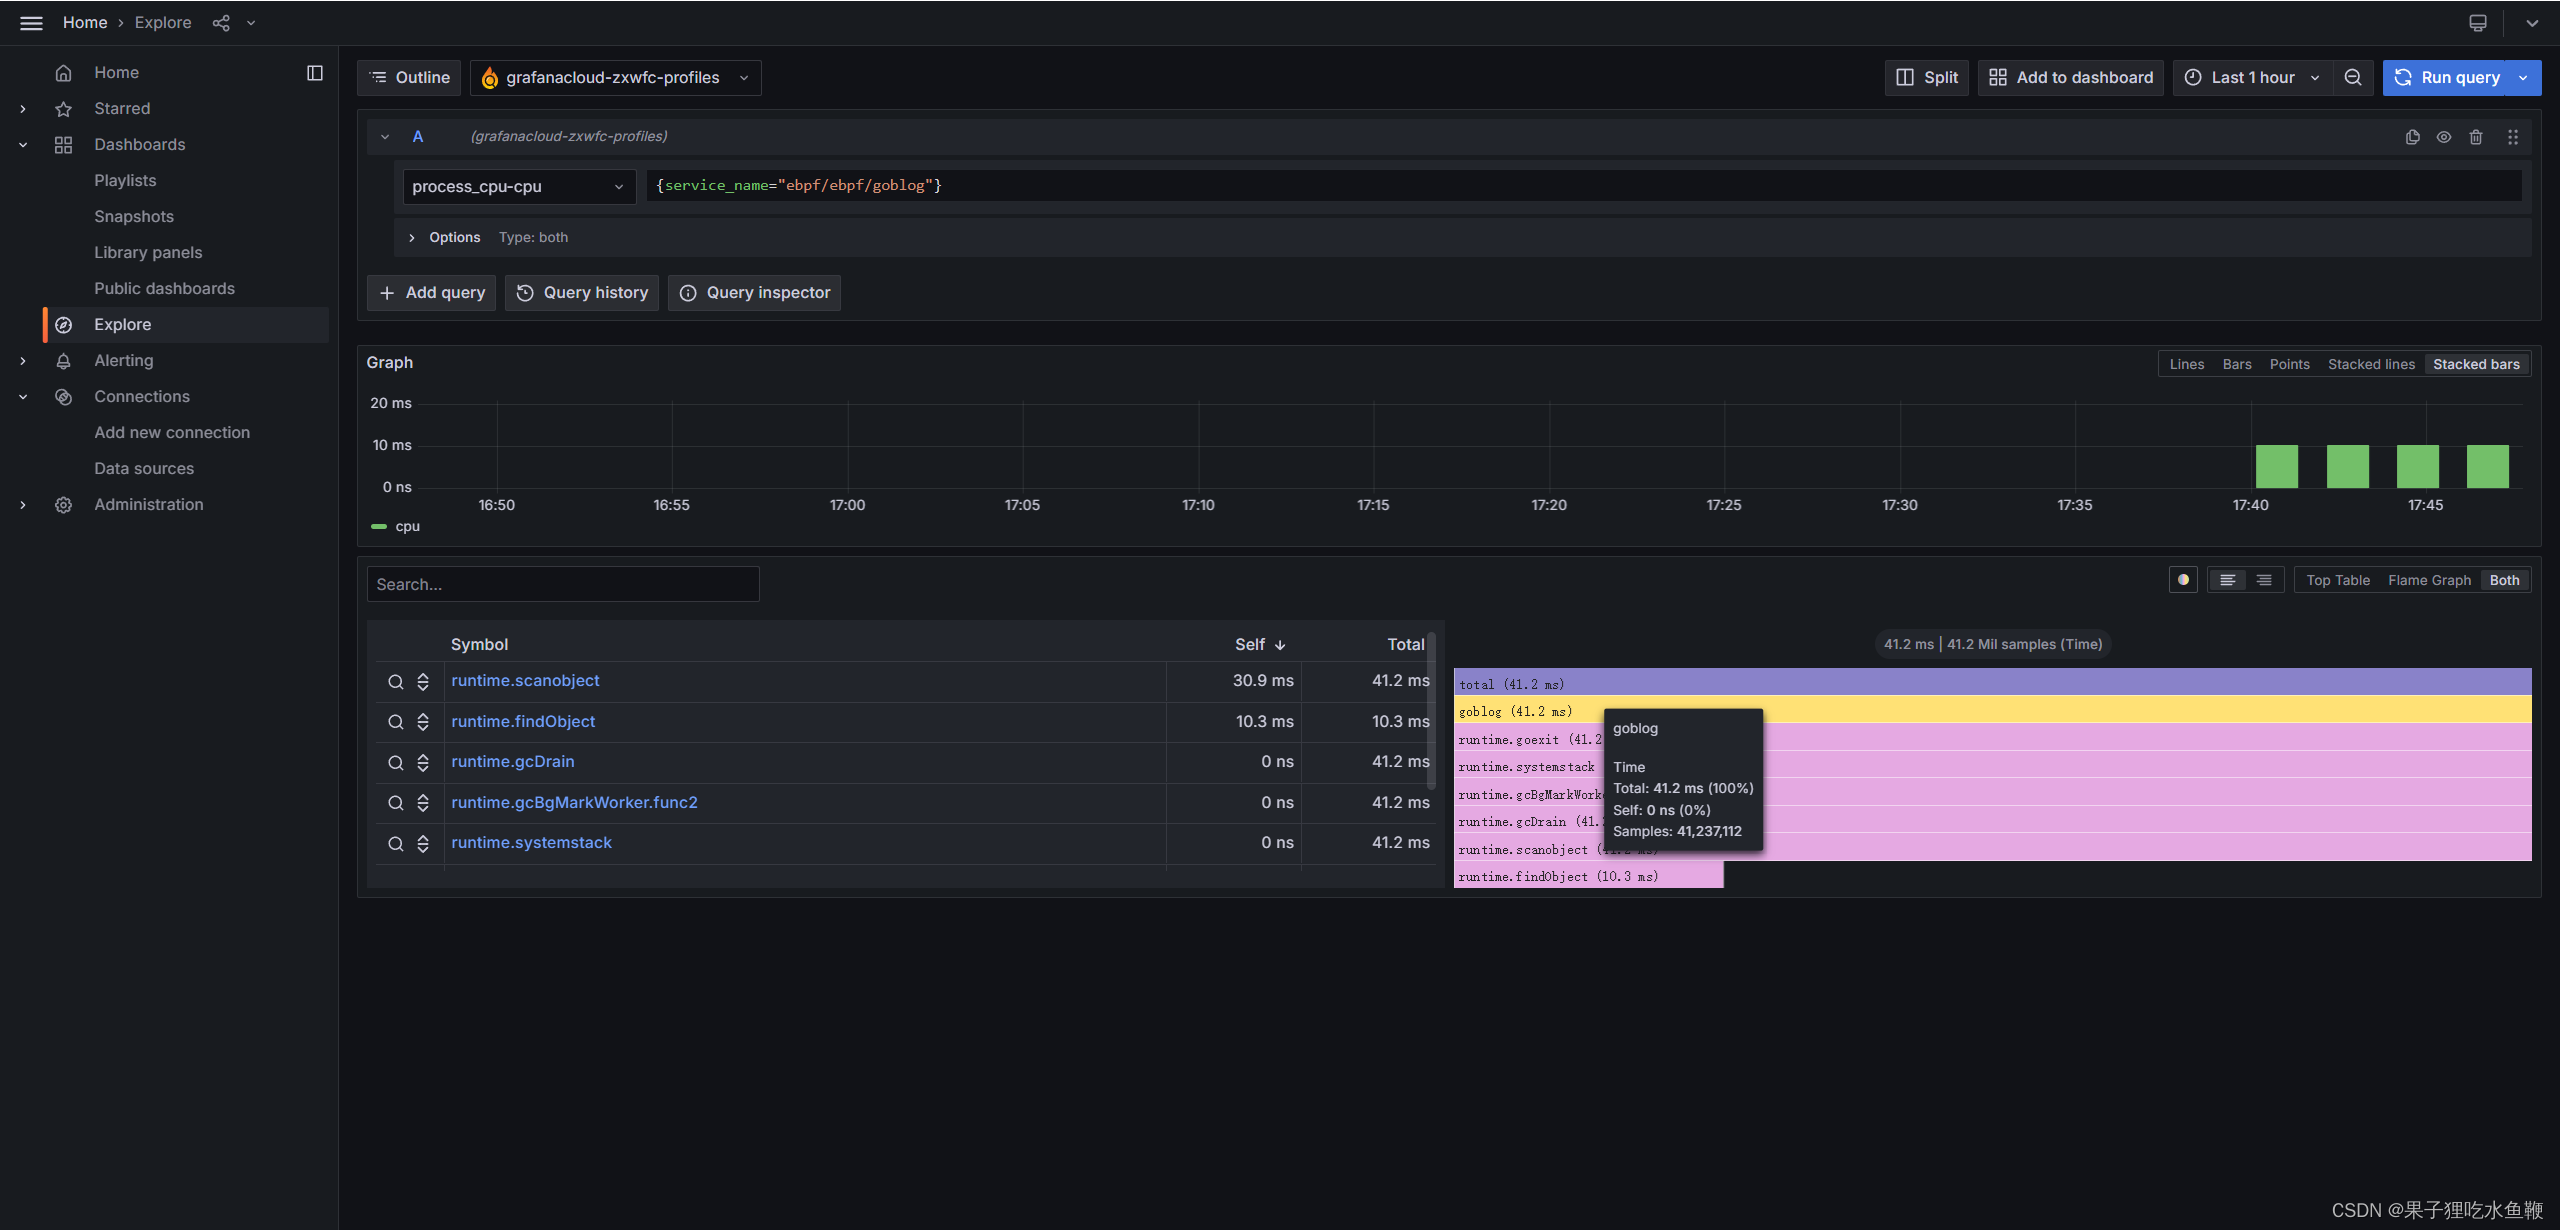
java服务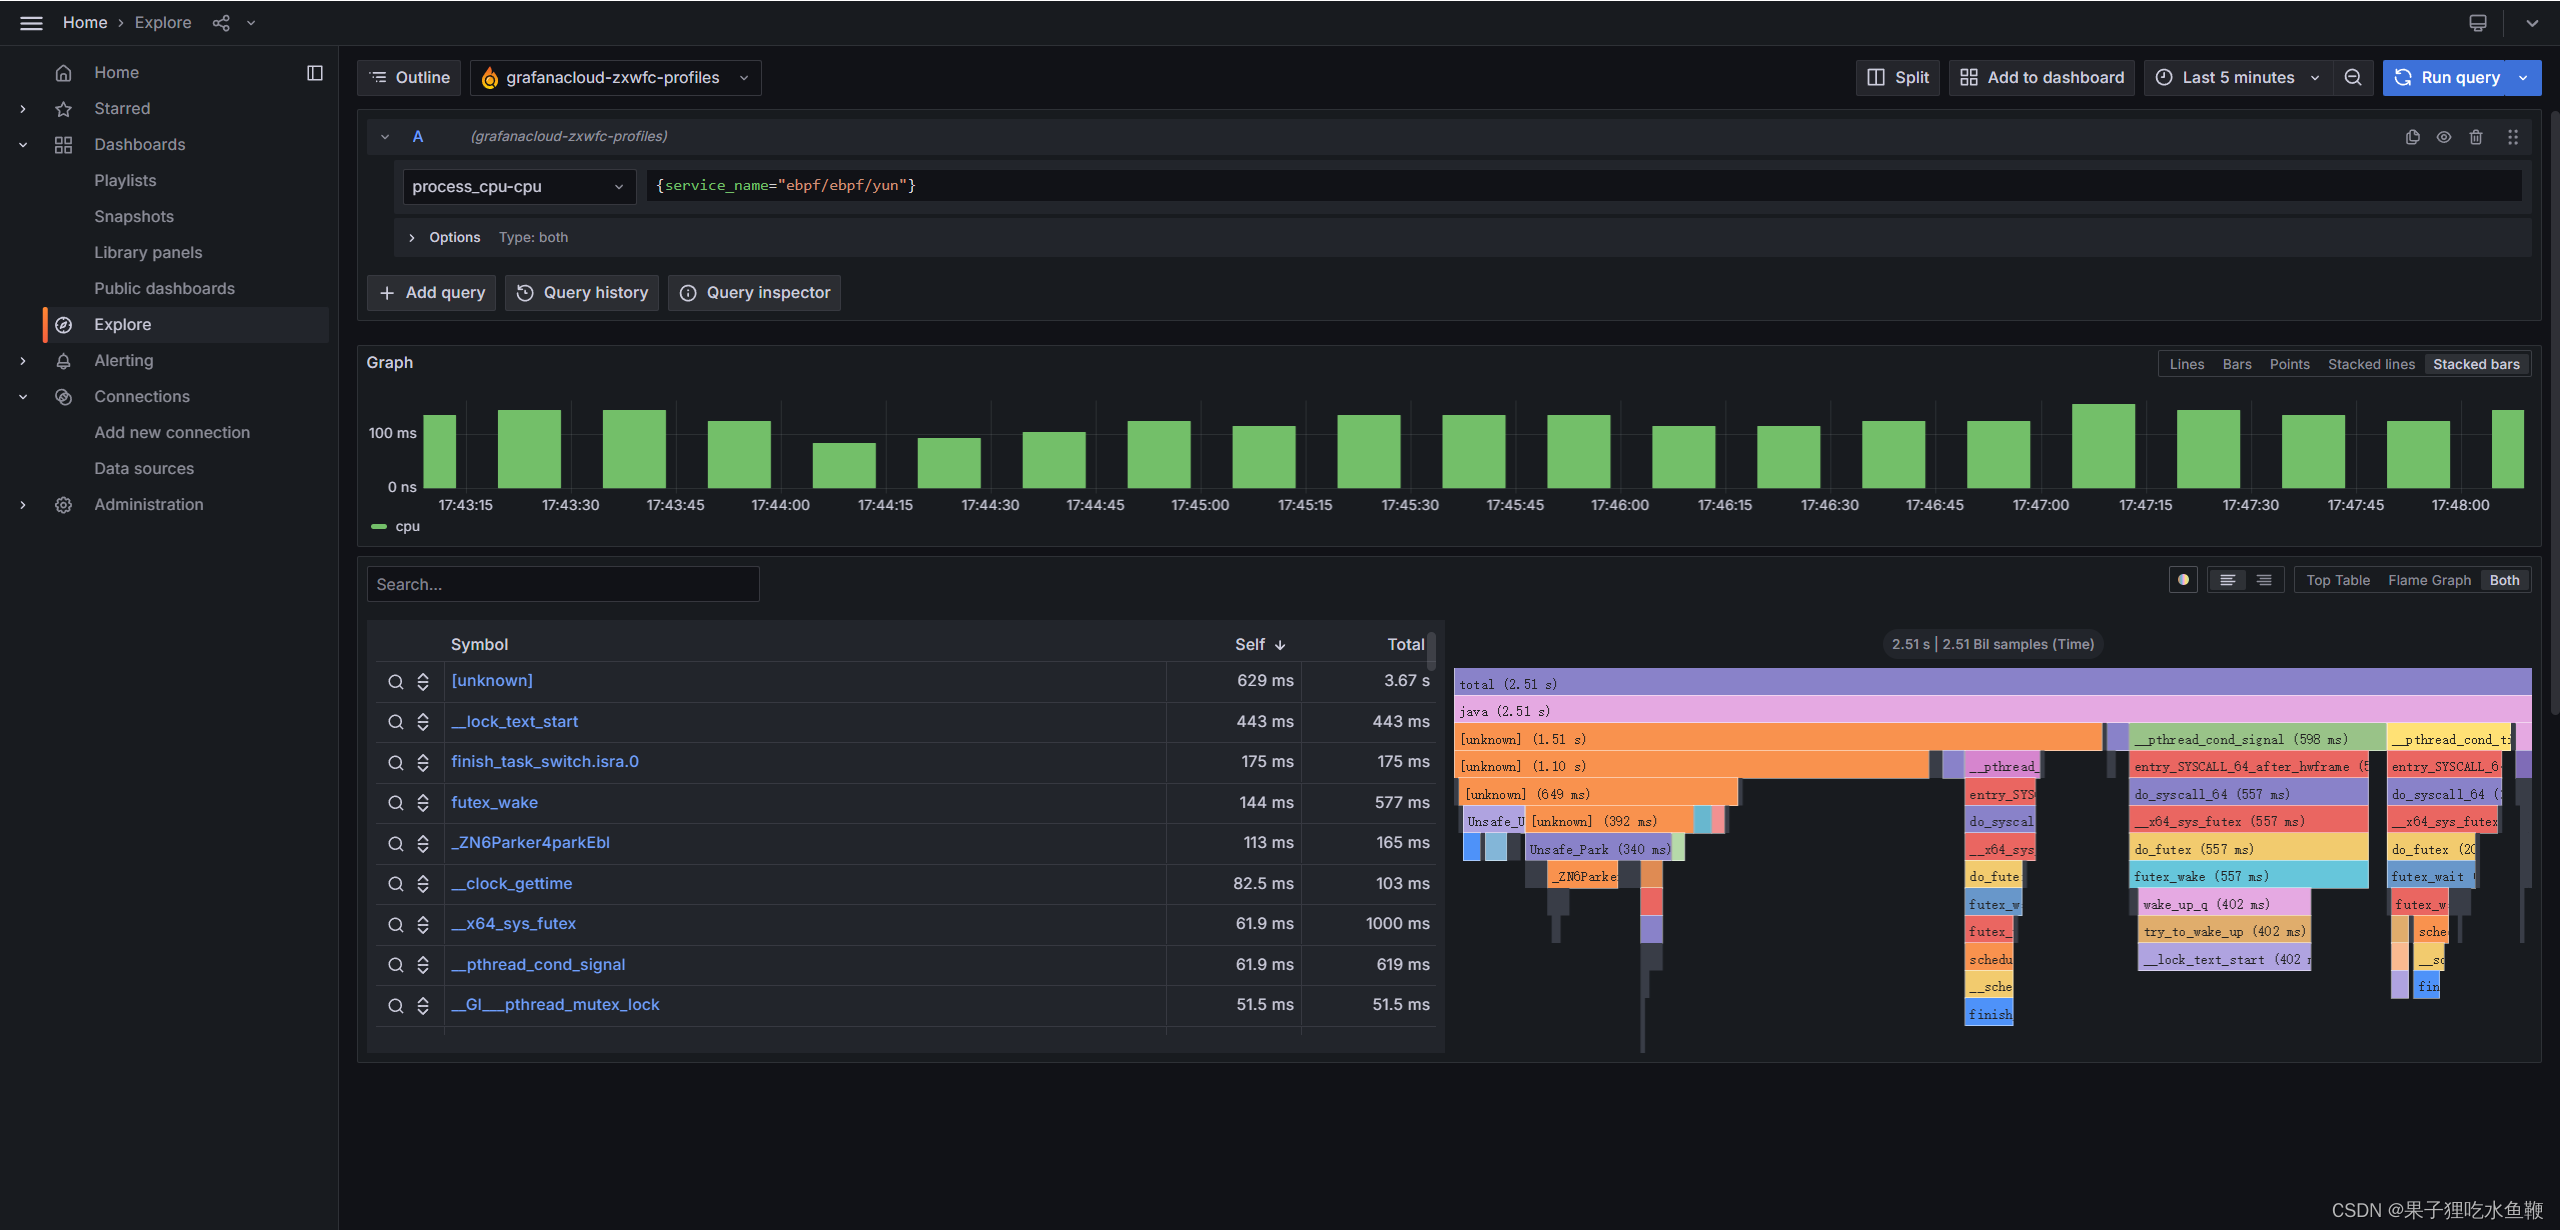
通过时间筛选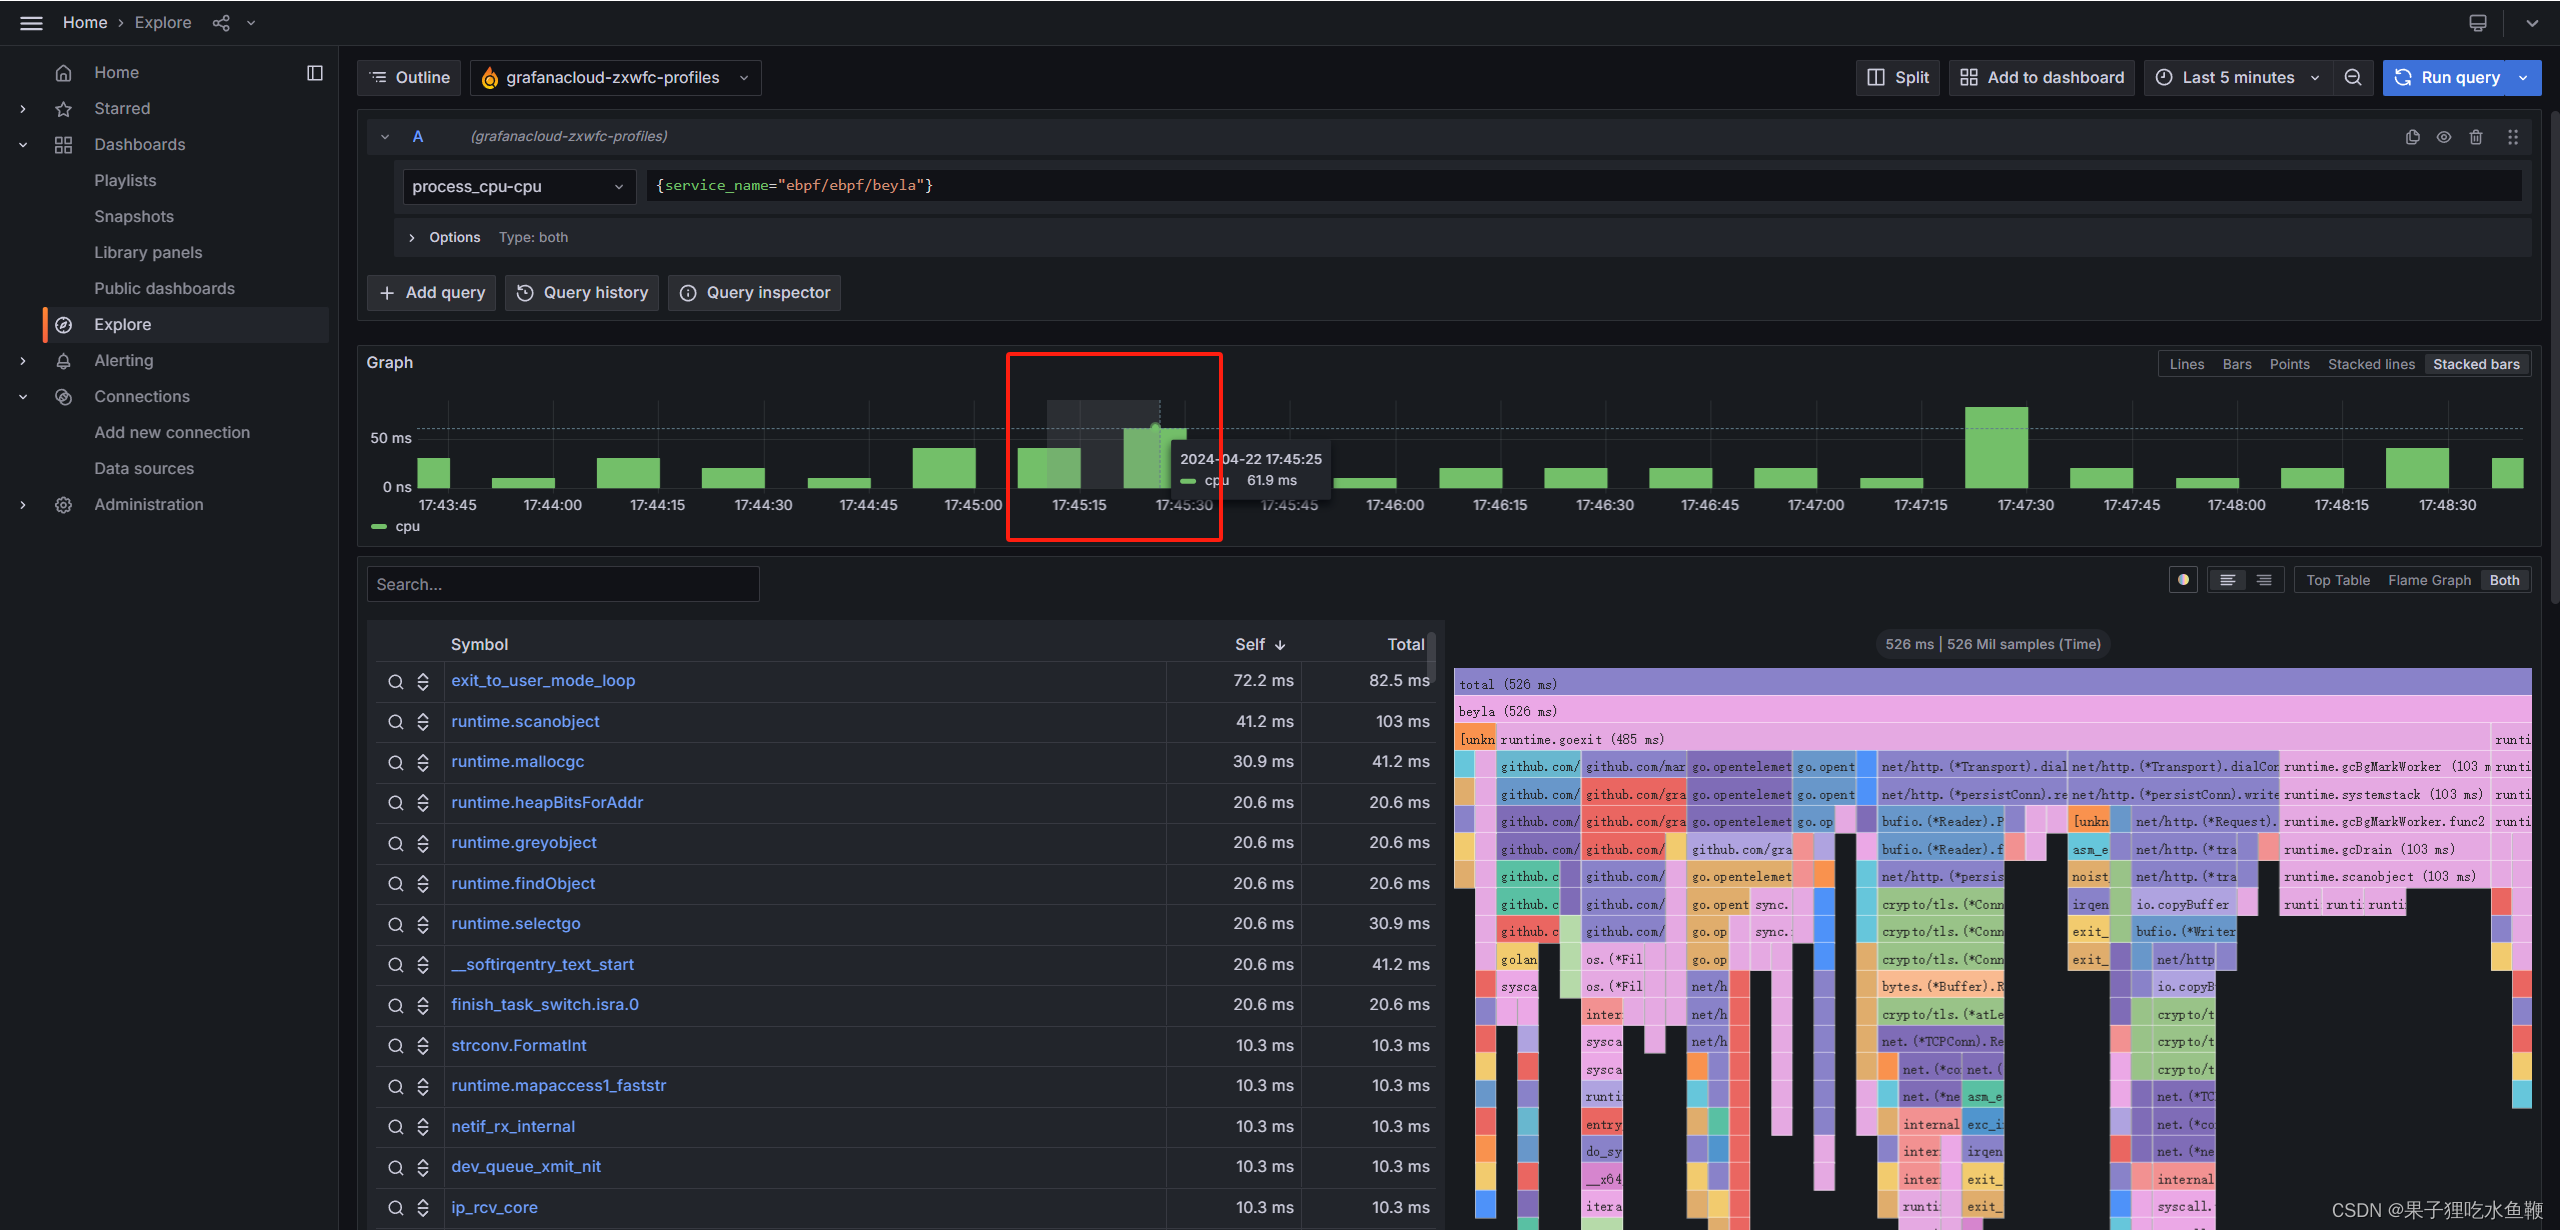
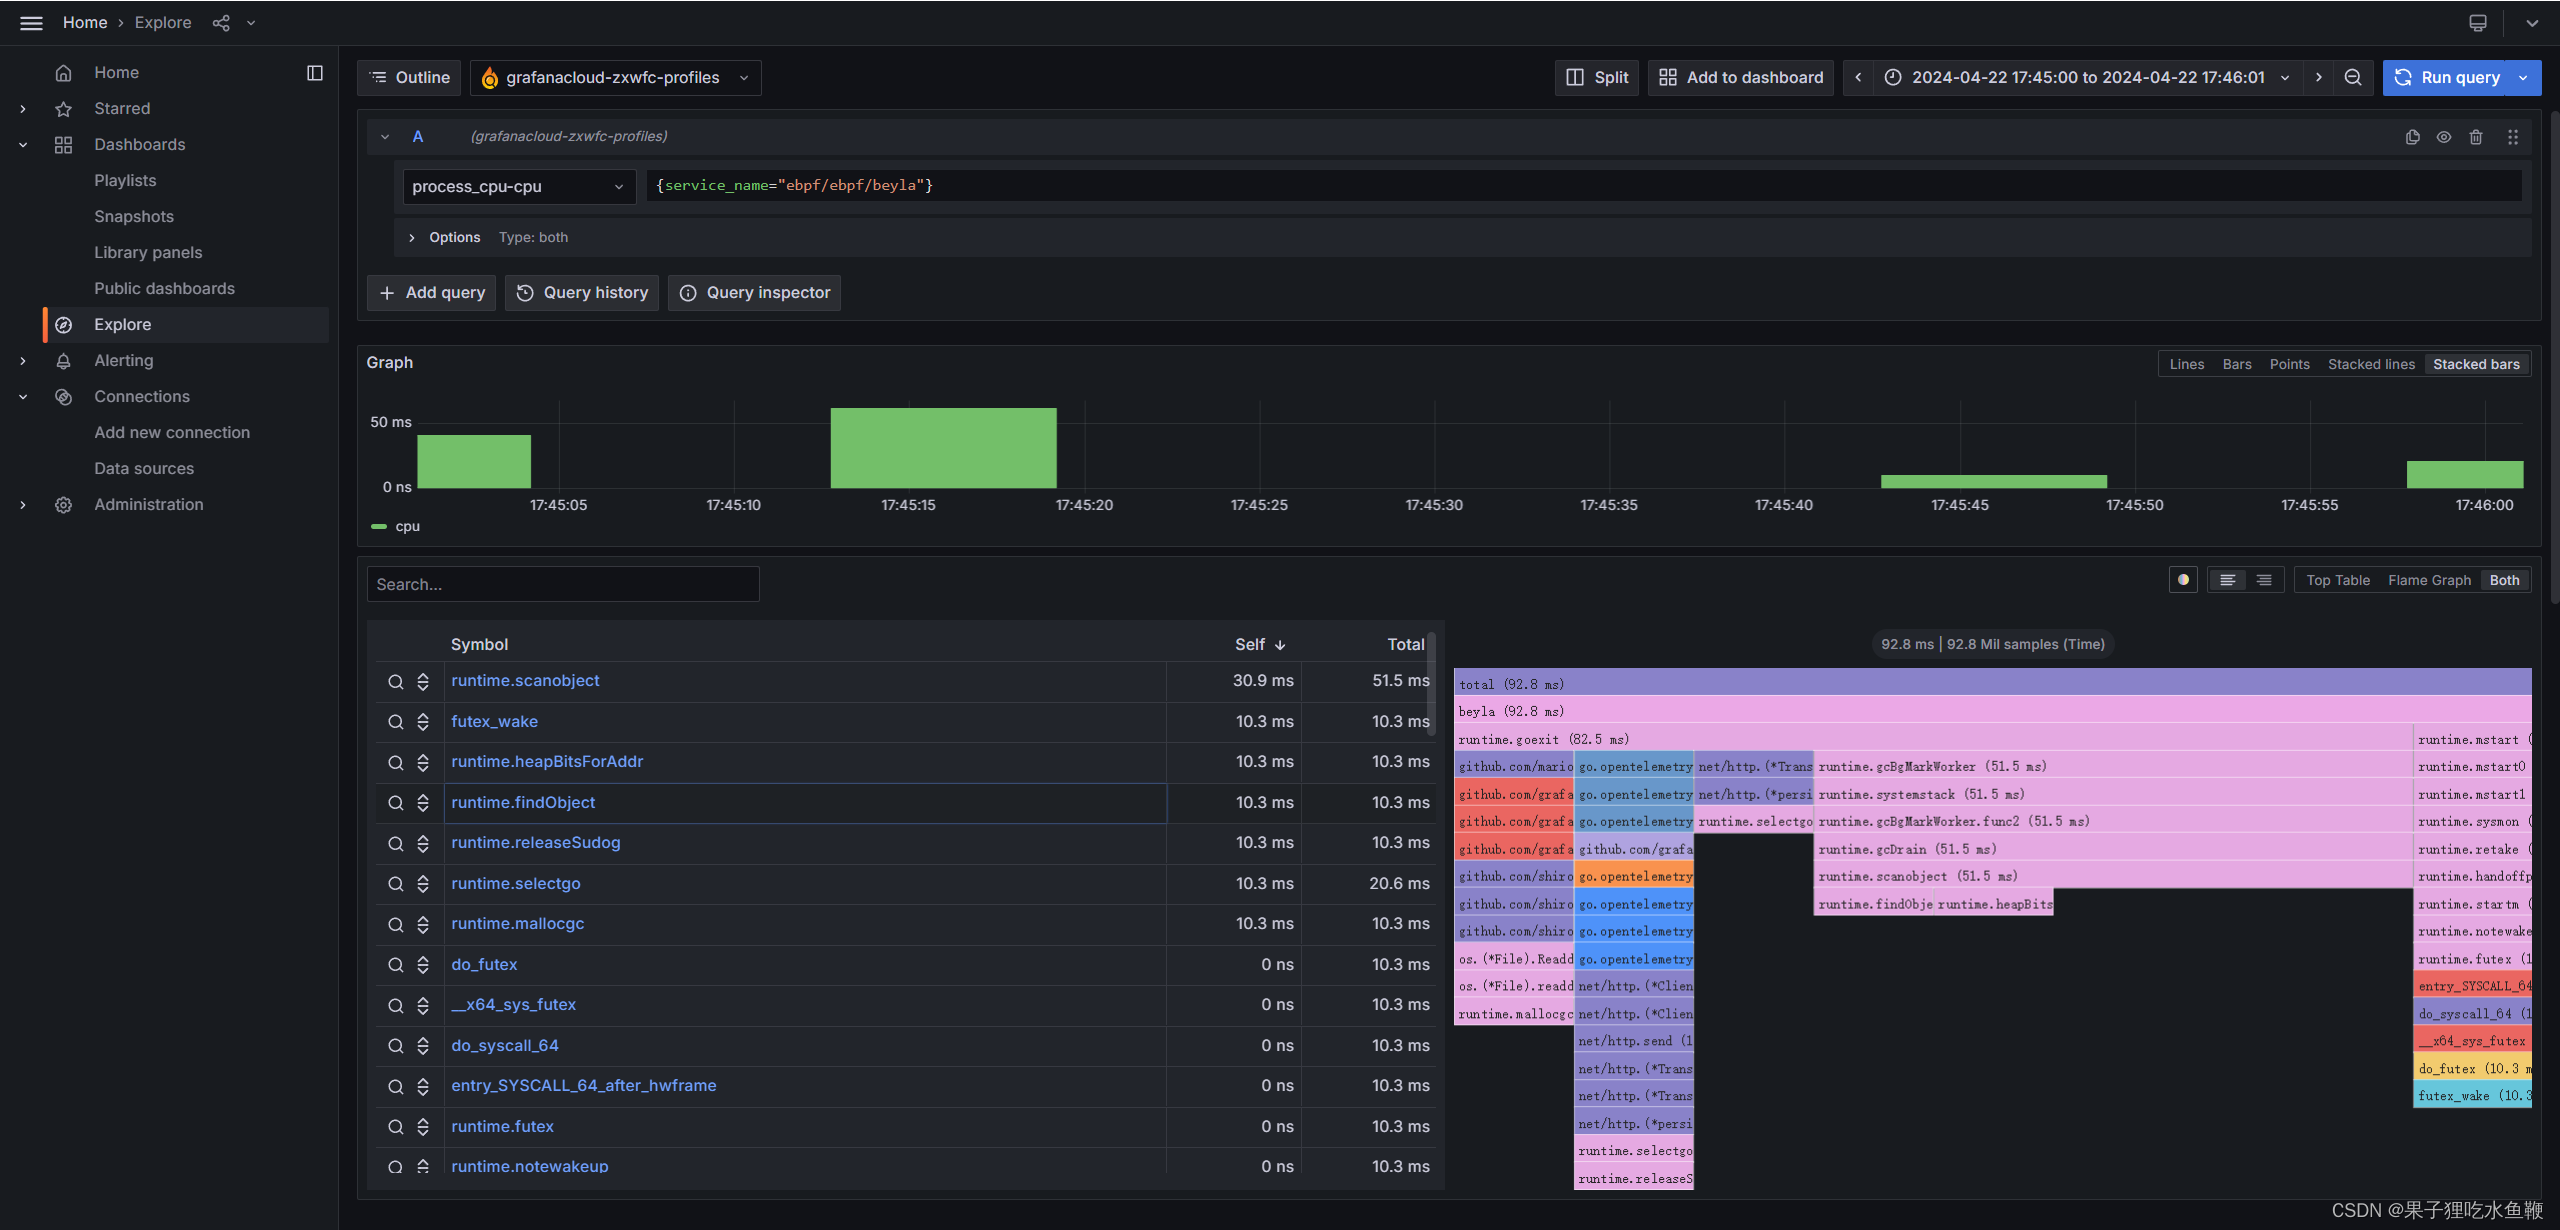
目前这一块的学习研究还不够深入,可能有很多问题需要指正。观察数据,根据某一个trace事件而产生的火焰图暂时没有找到方法去体现。只能根据时间去展示某个服务一段时间内的火焰图。(如果有大佬有相关经验,烦请指导一下)
可能将beyla的OTEL_EXPORTER_OTLP_ENDPOINT这个配置指向grafana agent可以实现对于某个trace的火焰图的渲染,目前尝试还没有成功。
4.总结
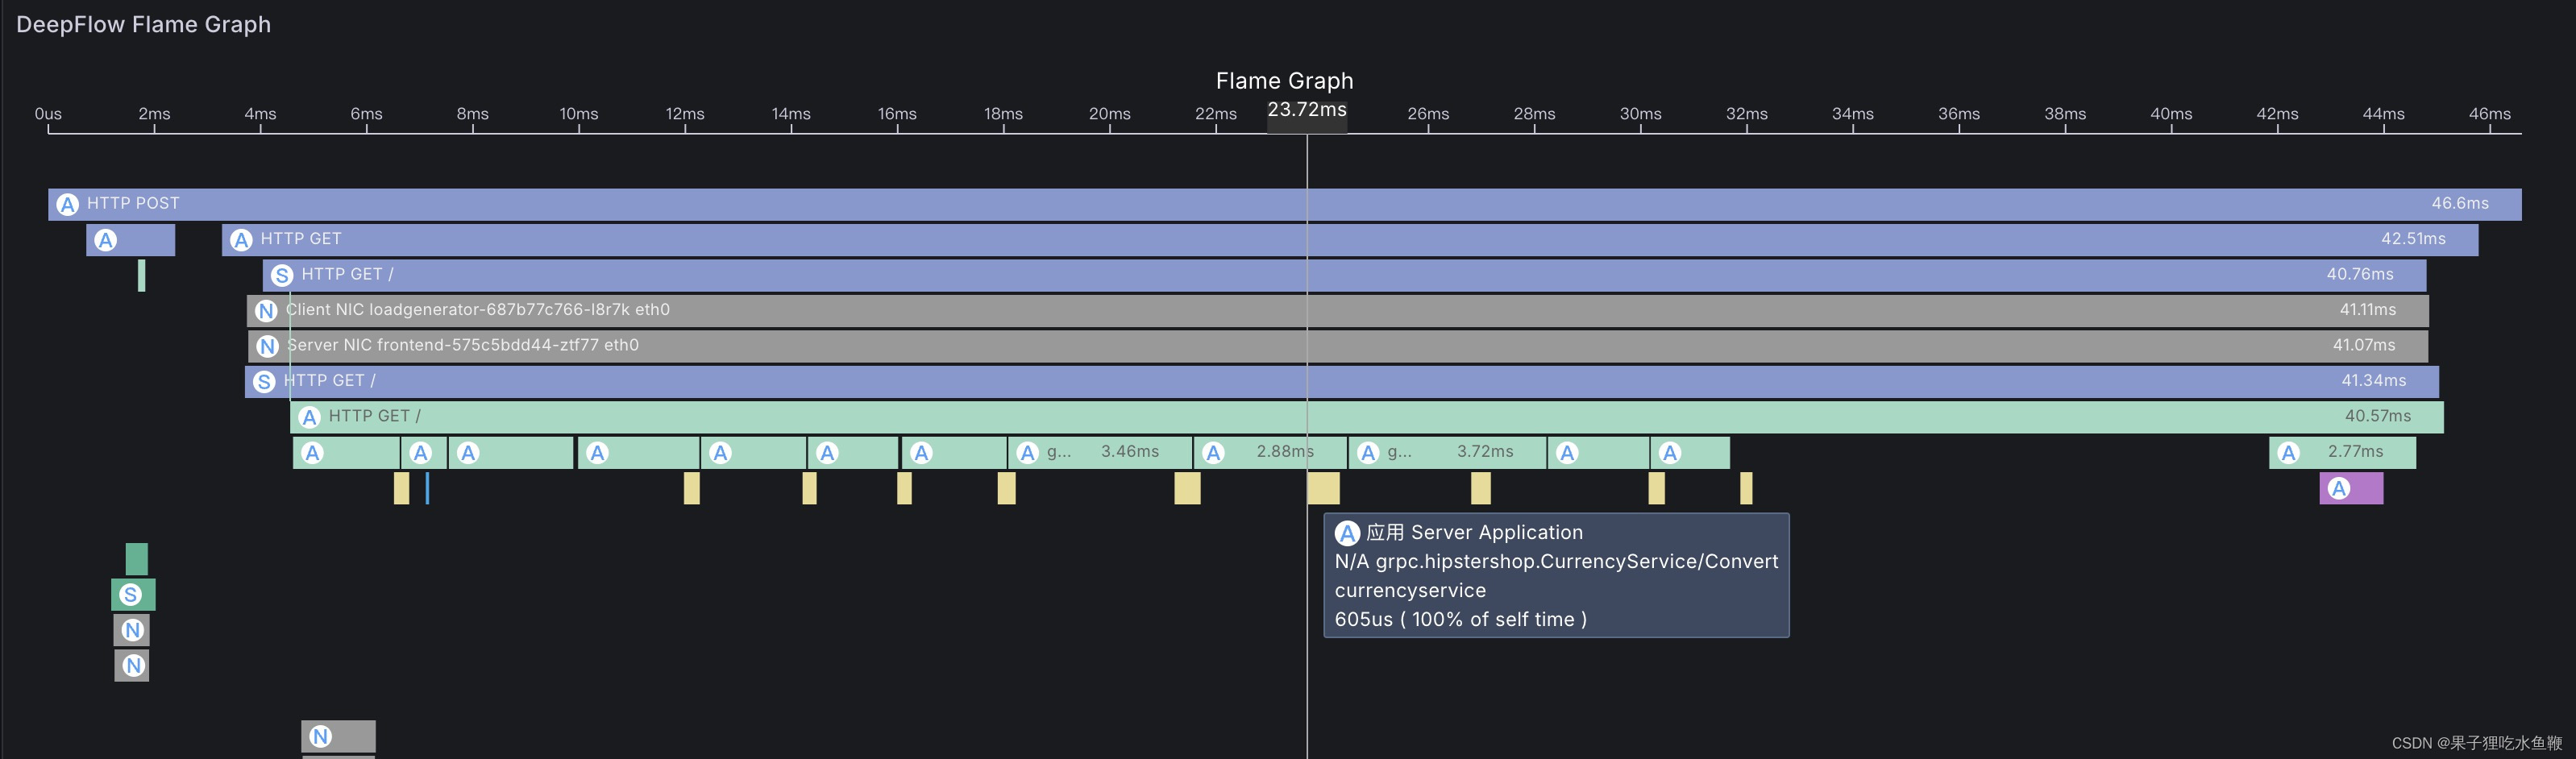
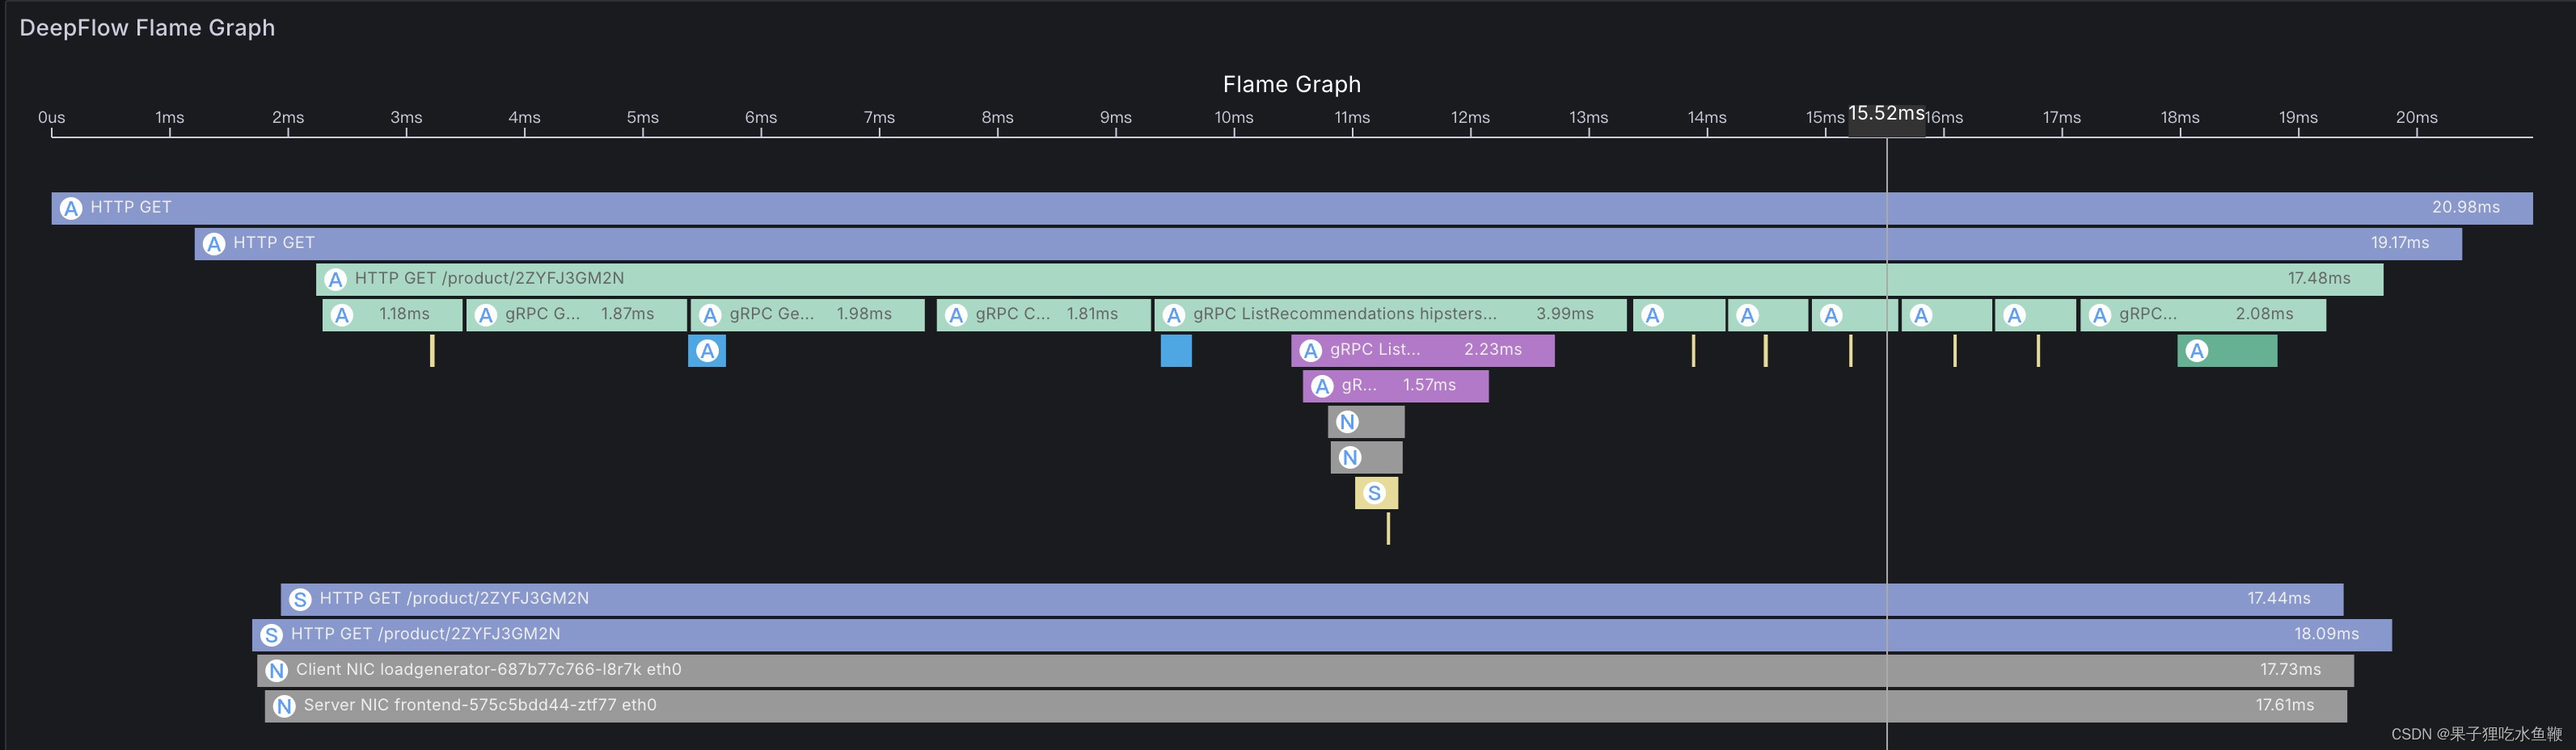
deepflow 可以根据事件去渲染对应的火焰图。但是社区版的部署需要的资源也非常高,一般个人的云服务器很难实现,不过可以通过虚拟机的方式去尝试一下。其中包含了grafana,ck,mysql等很多组件。
skywalking rover采集的数据配合skywalking前端渲染出来的效果如下: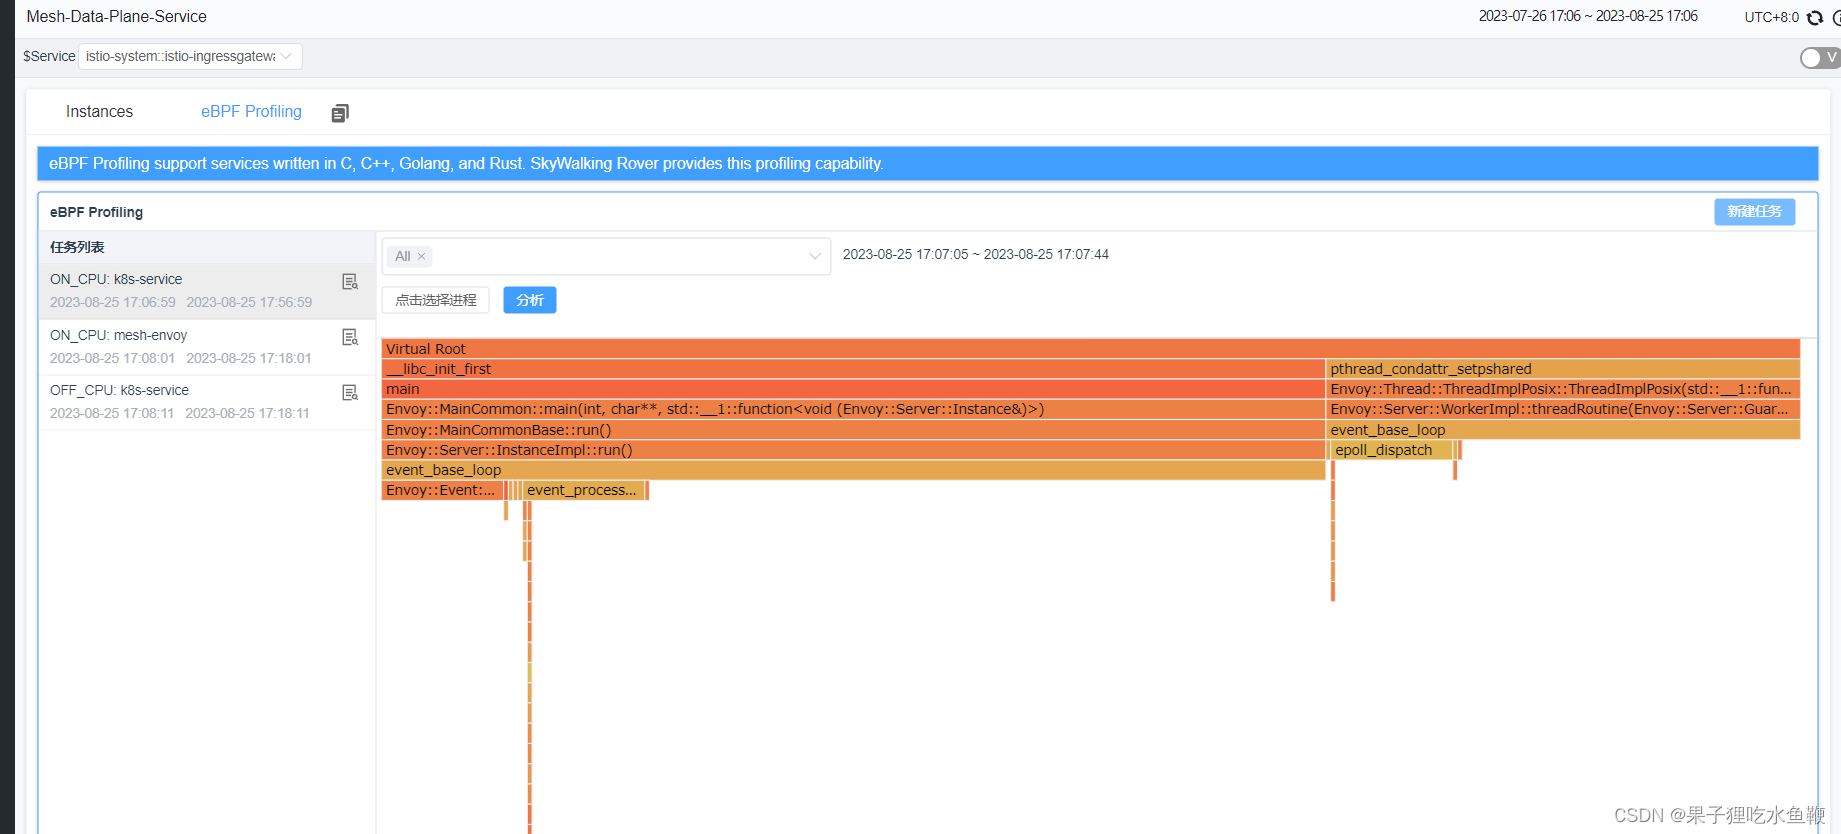
beyla和deepflow突出的数据都是符合otel协议的,可以通过otel-collector进行转发。
希望有经验的大佬留言指导,一起讨论讨论。如果发现问题留言一定回复!
请勿转载,谢谢!


 1738
1738

 被折叠的 条评论
为什么被折叠?
被折叠的 条评论
为什么被折叠?
 到【灌水乐园】发言


