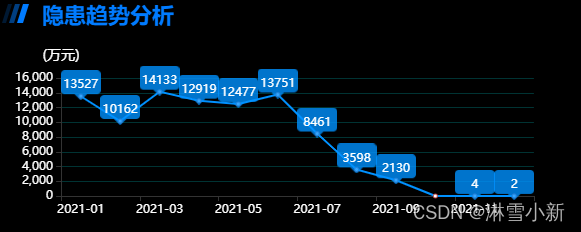
echarts markPoint显示(上面图片文字)
  data() {
    return {
      option1: {
        textStyle: {
          color: '#fff'
        },
        grid: {
          top: '34px',
          bottom: '34px'
        },
        xAxis: {
          type: 'category',
          nameTextStyle: {
            color: '#fff',
            fontSize: 14 // 字体大小
          },
          data: []
        },
        yAxis: {
          type: 'value',
          name: '(万元)',
          nameTextStyle: {
            color: '#fff',
            fontSize: 14 // 字体大小
          },
          splitLine: {
            // 分割线配置
            show: true,
            lineStyle: {
              color: 'rgba(0, 255, 255, .2)'
            }
          }
        },
        series: [
          {
            data: [],
            type: 'line',
            markPoint: {
              data: []
            },
            itemStyle: {
              normal: {
                lineStyle: {
                  color: '#0091FF'
                }
              }
            }
          }
        ]
      }
    }
  },
  methods: {
  getEventCharts1() {
      let url = '/apis/law/fine'
      Axios.get(url).then((res) => {
        if (res.data.code === 200) {
          let arr = res.data.data || []
          this.option1.series[0].data = arr.map((item) => item.num)
          arr.forEach((items, index) => {
            let obj = {
              name: '',
              value: items.num,
              xAxis: index,
              yAxis: items.num + 50,
              itemStyle: {
                color: '#0091FF'
              },
              symbolSize: [40, 30],
              symbol: 'image://' + require('@/assets/left/bar1.png')
            }
            this.option1.series[0].markPoint.data.push(obj)
            this.option1.series[0].markPoint.data = this.option1.series[0].markPoint.data.filter(
              (res) => res.value !== '0'
            )
          })
          this.option1.xAxis.data = arr.map((item) => item.mon)
          if (this.option1.series[0].data && this.option1.series[0].data.length > 0) {
            this.initChart1()
          }
        }
      })
    },
}


 1138
1138

 被折叠的 条评论
为什么被折叠?
被折叠的 条评论
为什么被折叠?
 到【灌水乐园】发言


