const industryColor = {
type: 'linear',
x: 1,
y: 0,
x2: 1,
y2: 1,
colorStops: [
{
offset: 0,
color: '#30CCC2'
},
{
offset: 0.8,
color: 'rgba(9, 33, 63, 0.2)'
}
]
};
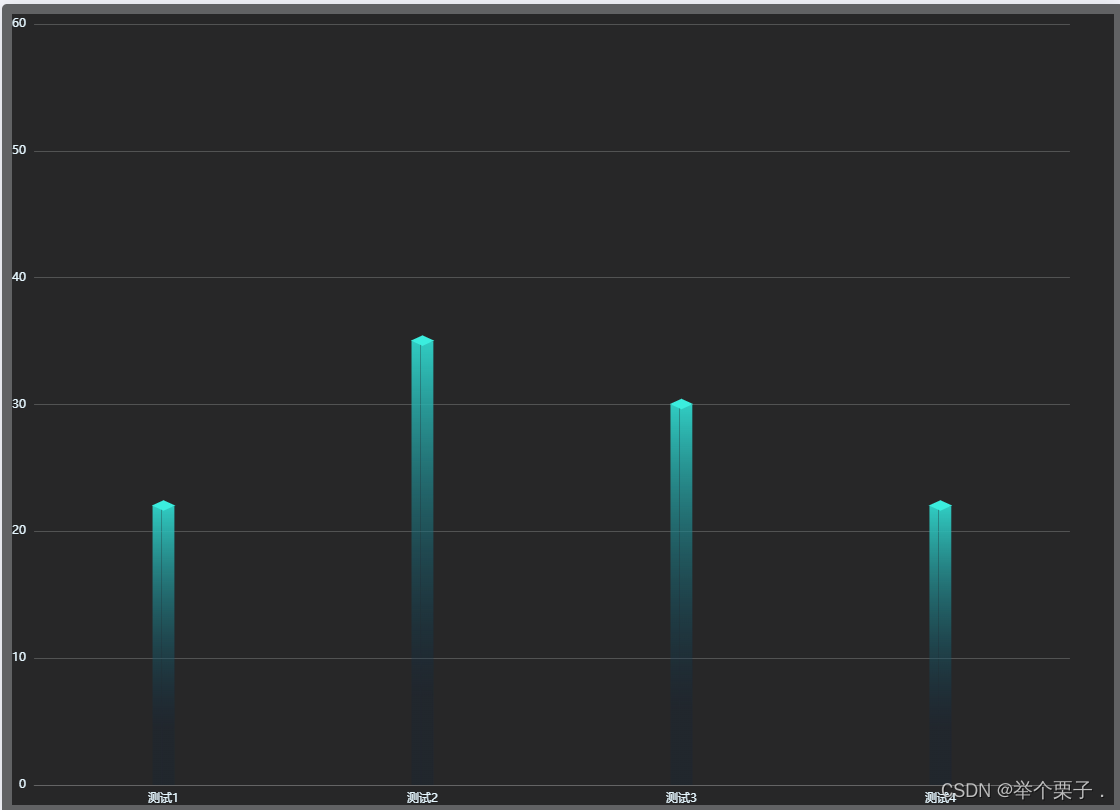
const industryData = [22, 35, 30, 22, 60, 56];
var option = {
backgroundColor: 'rgba(0, 0, 0, 0.6)',
animation: false,
tooltip: {
trigger: 'axis',
axisPointer: {
type: 'shadow'
}
},
grid: {
left: '0%',
right: '4%',
bottom: '0%',
top: '10px',
containLabel: true
},
xAxis: {
type: 'category',
data: ['测试1', '测试2', '测试3', '测试4'],
axisLabel: {
color: '#E6F7FF'
},
axisLine: {
show: true,
lineStyle: {
color: 'rgba(255, 255, 2555, 0.1)'
}
},
axisTick: {
show: false
},
animation: false
},
yAxis: {
type: 'value',
axisLabel: {
color: '#E6F7FF'
},
splitLine: {
show: true,
lineStyle: {
color: 'rgba(255,255,255,0.2)'
}
},
animation: false
},
series: [
{
name: '测试1',
type: 'bar',
barWidth: 9,
data: industryData,
itemStyle: {
//柱子左面
normal: {
// 重要的是color配置:线性渐变, 从上往下
color: {
type: 'linear',
x: 1,
y: 0,
x2: 1,
y2: 1,
colorStops: [
{
offset: 0,
color: '#30CCC2'
},
{
offset: 0.8,
color: 'rgba(9, 33, 63, 0.2)'
}
]
}
}
},
tooltip: {
show: false
}
},
{
name: '测试1',
tooltip: {
show: true,
padding: 100,
position: [-10, '50%'],
borderWidth: 100
},
type: 'bar',
barWidth: 13,
barCategoryGap: '60%',
itemStyle: {
//柱子右面
normal: {
// 重要的是color配置:线性渐变, 从上往下
color: industryColor,
borderWidth: 0.3,
borderColor: 'rgba(9, 36, 83, 0.1)'
}
},
data: industryData,
// 间隔为0
barGap: 0,
z: 5
},
{
z: 10,
name: '测试1',
// 这里是柱子的顶部,type: "pictorialBar" 可以自定义图形或者使用内置选项
type: 'pictorialBar',
symbolPosition: 'end',
data: industryData,
symbol: 'diamond',
symbolOffset: [0, -12],
symbolRotate: 90,
symbolSize: [10.5, 23],
itemStyle: {
normal: {
borderWidth: 0,
color: '#3BEDDE'
}
},
tooltip: {
show: false
}
}
]
};


 1038
1038

 被折叠的 条评论
为什么被折叠?
被折叠的 条评论
为什么被折叠?
 到【灌水乐园】发言


