


 本文详细介绍了如何在SpringBoot项目中集成Prometheus进行监控,并结合Grafana实现可视化展示。首先,文章阐述了Prometheus和Grafana的基本概念和作用。接着,通过添加依赖和配置文件,展示了在SpringBoot中启用Prometheus的步骤。然后,配置Prometheus以监控SpringBoot应用,包括设置scrape_interval和job。最后,指导如何在Grafana中导入Dashboard,以实时查看SpringBoot应用的监控指标。
本文介绍SpringBoot如何使用Prometheus配合Grafana监控。
1.关于Prometheus
Prometheus是一个根据应用的metrics来进行监控的开源工具。相信很多工程都在使用它来进行监控,有关详细介绍可以查看官网:https://prometheus.io/docs/introduction/overview/。
2.有关Grafana
Grafana是一个开源监控利器,如图所示。

从图中就可以看出来,使用Grafana监控很高大上,提供了很多可视化的图标。
官网地址:https://grafana.com/
3.SpringBoot使用Prometheus
3.1 依赖内容
在SpringBoot中使用Prometheus其实很简单,不需要配置太多的东西,在pom文件中加入依赖,完整内容如下所示。
<?xml version="1.0" encoding="UTF-8"?>
3.2 配置文件
配置文件中加入配置,这里就只进行一些简单配置,management.metrics.tags.application属性是本文配合Grafana的Dashboard设置的,如下所示:
spring.application.name=springboot_prometheus
management.endpoints.web.exposure.include=*
management.metrics.tags.application=${spring.application.name}
3.3 设置application
修改启动类,如下所示.
@SpringBootApplication public class Springboot2PrometheusApplication {
public static void main(String[] args) {
    SpringApplication.run(Springboot2PrometheusApplication.class, args);
}
@Bean
MeterRegistryCustomizer<MeterRegistry> configurer(
        @Value("${spring.application.name}") String applicationName) {
    return (registry) -> registry.config().commonTags("application", applicationName);
} }
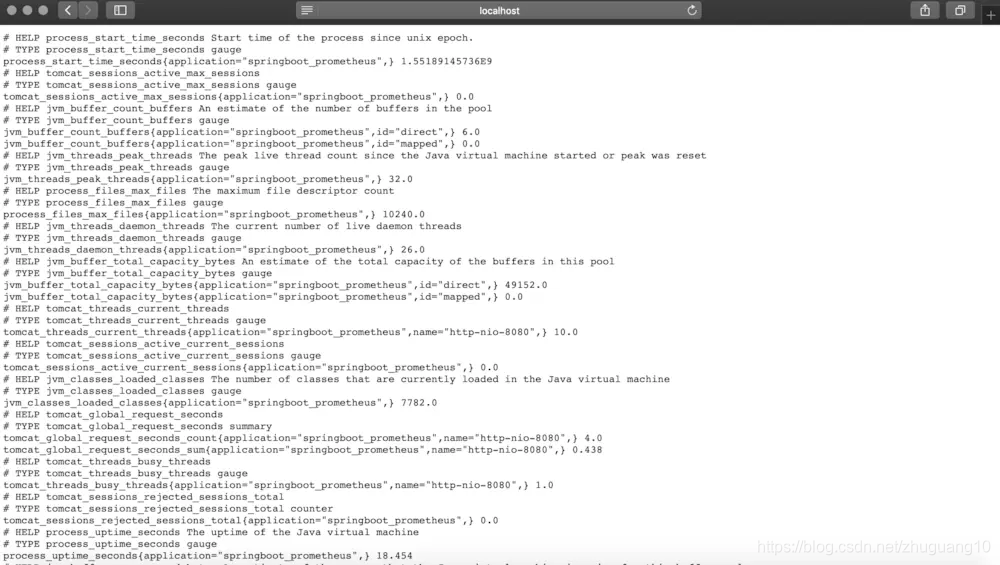
SpringBoot项目到这里就配置完成了,启动项目,访问http://localhost:8080/actuator/prometheus,如图所示,可以看到一些度量指标。
4.Prometheus配置
4.1 配置应用
在prometheus配置监控我们的SpringBoot应用,完整配置如下所示。
my global config global: scrape_interval: 15s # Set the scrape interval to every 15 seconds. Default is every 1 minute.
evaluation_interval: 15s # Evaluate rules every 15 seconds. The
default is every 1 minute. # scrape_timeout is set to the global
default (10s).Alertmanager configuration alerting: alertmanagers:
Load rules once and periodically evaluate them according to the global ‘evaluation_interval’. rule_files: # - “first_rules.yml”
- “second_rules.yml”
A scrape configuration containing exactly one endpoint to scrape:
Here it’s Prometheus itself. scrape_configs:
- job_name: ‘prometheus’
static_configs:
- targets: [‘127.0.0.1:9090’]
###以下内容为SpringBoot应用配置- job_name: ‘springboot_prometheus’
scrape_interval: 5s
metrics_path: ‘/actuator/prometheus’
static_configs:
- targets: [‘127.0.0.1:8080’]
4.2 启动Prometheus
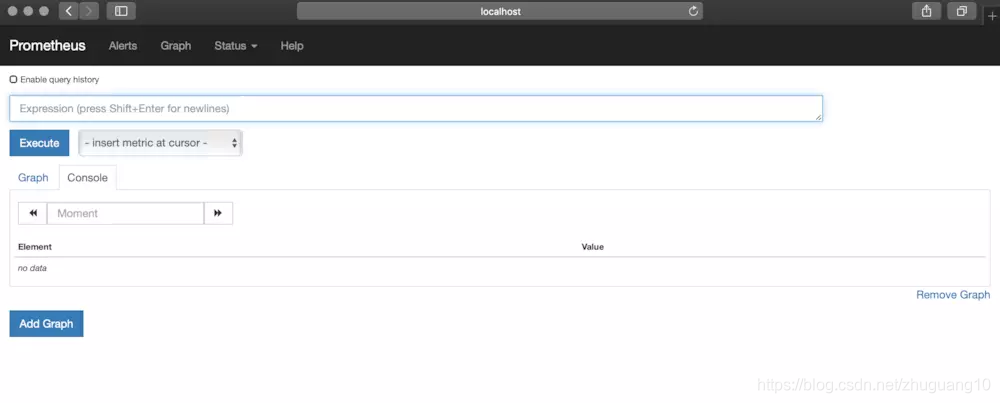
启动Prometheus,浏览器访问,查看Prometheus页面,如图所示。
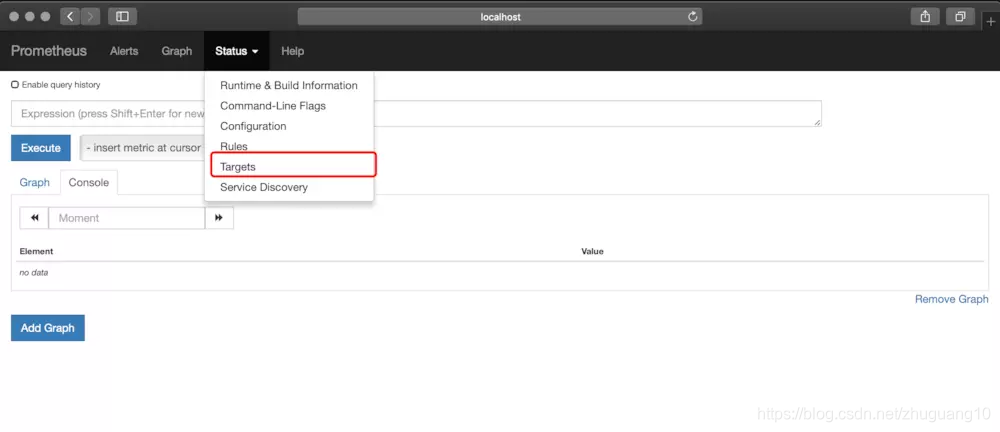
点击如图所示位置,可以查看Prometheus监控的应用。
列表中UP的页面为存活的实例,如图所示。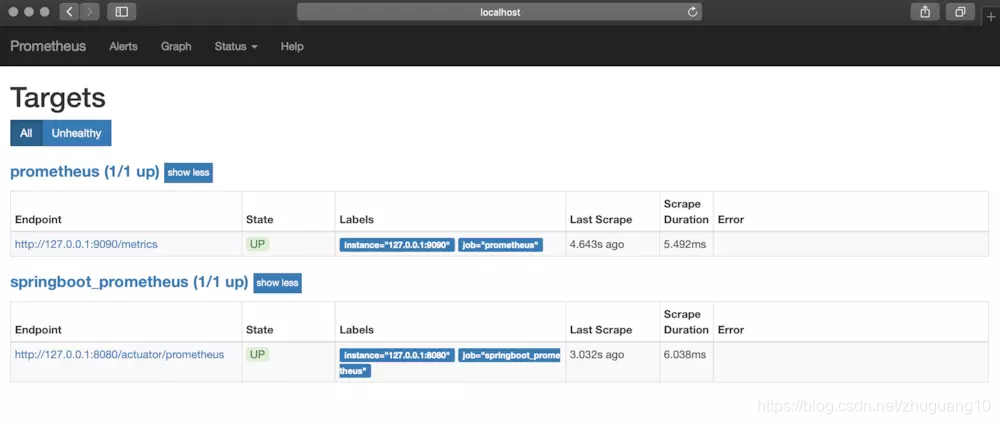
也可以查看很多指数,如下所示。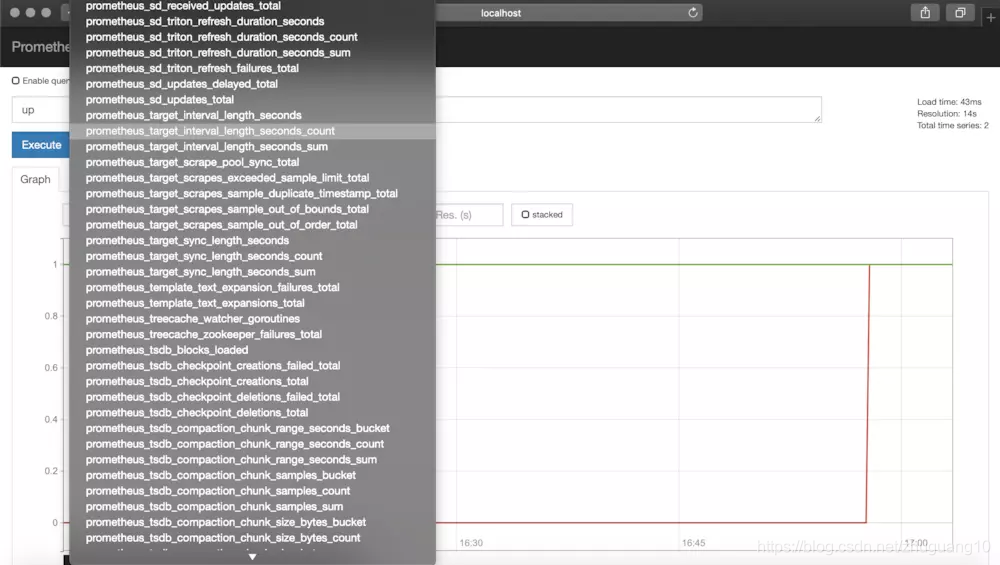
5.Grafana配置
启动Grafana,配置Prometheus数据源,这里以ID是4701的Doshboard为例(地址:https://grafana.com/dashboards/4701)如图。

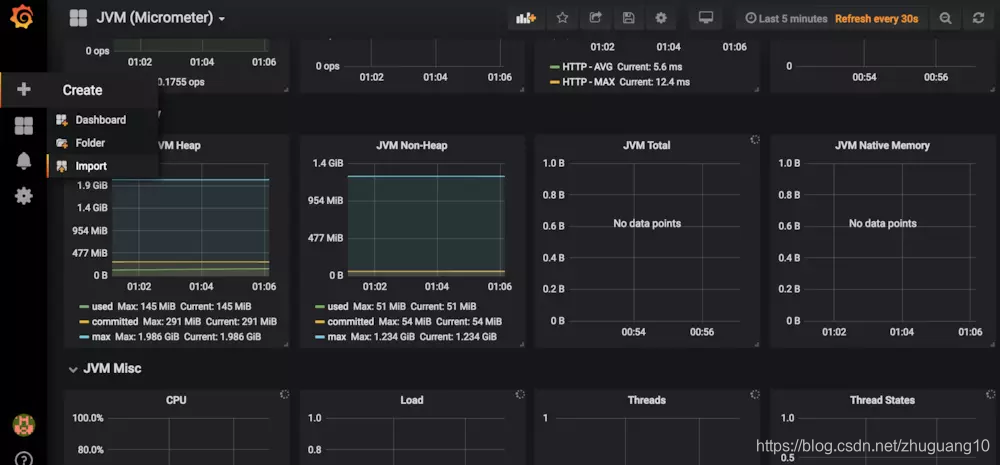
在Grafana内点击如图所示import按钮
在如图所示位置填写4701,然后点击load。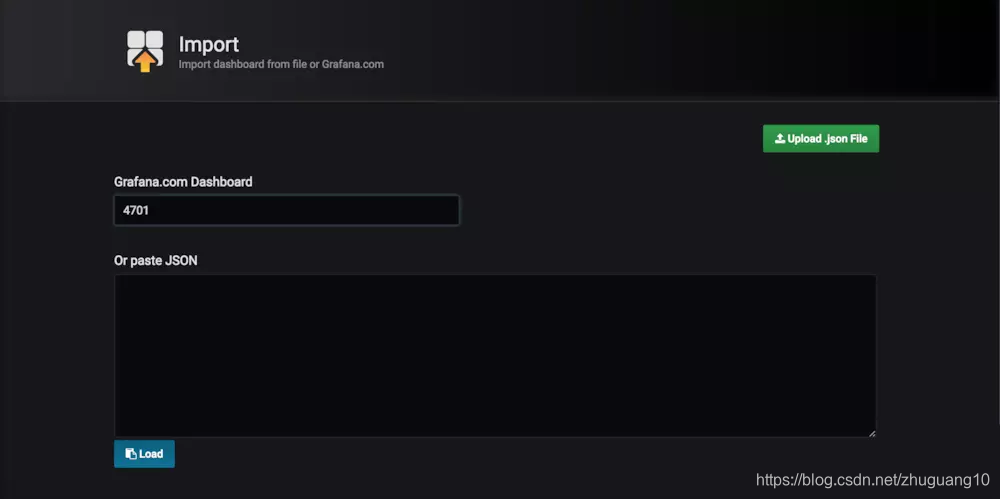
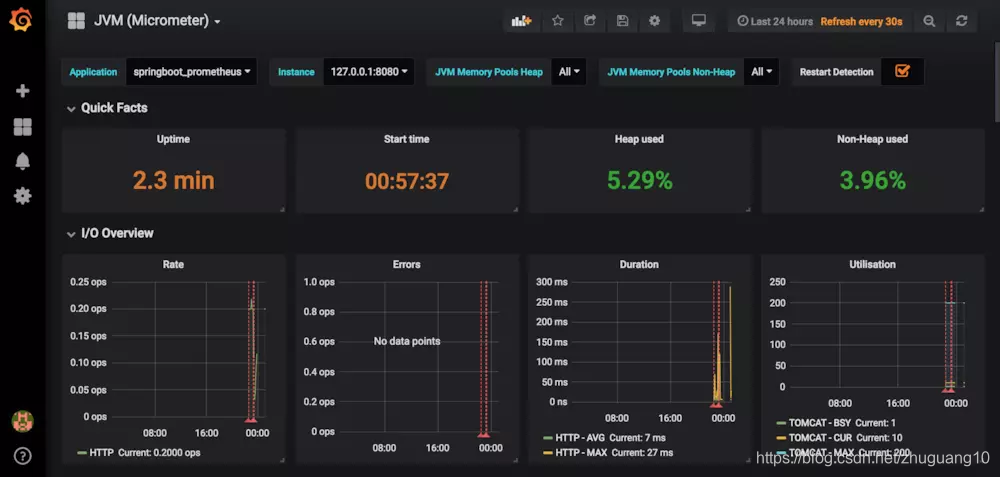
接下来导入Doshboard。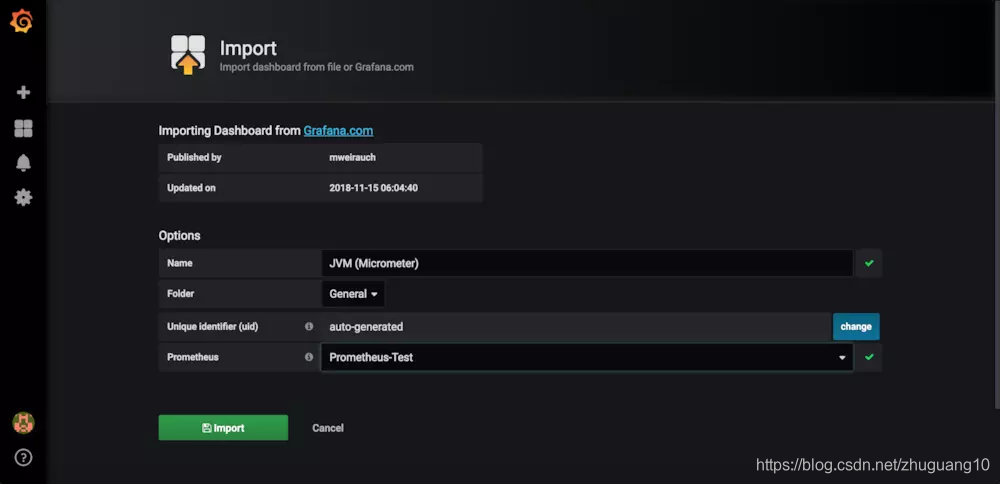
导入后就可以看到我们的SpringBoot项目对应的指标图表了,如图。


 1万+
1万+

 被折叠的 条评论
为什么被折叠?
被折叠的 条评论
为什么被折叠?
 到【灌水乐园】发言


