


 本文详细介绍了如何在Springboot项目中集成Prometheus,涉及基本配置、Actuator端点的管理、使用micrometer-registry-prometheus收集度量指标,以及PromQL表达式的使用和数据外推机制。
目录:
(1)Prometheus基本原理和使用
(2)Springboot中集成Prometheus
上文介绍了prometheus的基本原理和使用。本文将继续介绍如何在springboot中集成prometheus。
本文中将出现前文或上文的描述,一般指本系列的前文。
基本配置
首先需要在springboot项目中引入两个依赖包,分别是spring-boot-starter-actuator和micrometer-registry-prometheus。
spring-boot-starter-actuator
Spring Boot Actuator是一个Spring Boot的子项目,它提供了一些用于监控和管理Spring Boot应用程序的端点(endpoints)和功能。
通过使用Actuator,可以轻松地监视应用程序的运行情况,包括度量指标、健康信息、配置信息等。
Actuator 默认只会开放 /actuator/health 这个端点,如果要开放其他 endpoint,需要额外在 application.properties 中做设置:
management.endpoints.web.exposure.include=*   # 暴露所有端点
# management.endpoints.web.exposure.include="health, info, metrics, prometheus, threaddump"  暴露常用的端点
# management.endpoints.web.base-path="/status"  将/actuator/xxx修改为/status/xxx,防止被猜到
# management.server.port=10111   指定端口,默认跟server.port一样,可以防止被猜到
其他配置请参考官方文档。
在Actuator中,一个重要的端点为/actuator/prometheus。在前文中说过,Prometheus根据配置的job定时去拉取各个监控节点的数据,任何组件只要提供对应的HTTP接口就可以接入监控,不需要任务SDK或其他集成过程。因此,该端点只要能提供prometheus格式的指标,就能在Prometheus中查询到。
但是prometheus端点并不是默认包含的,而是需要额外的支持。因此需要引入micrometer-registry-prometheus库。重新访问可以看到如下结果:
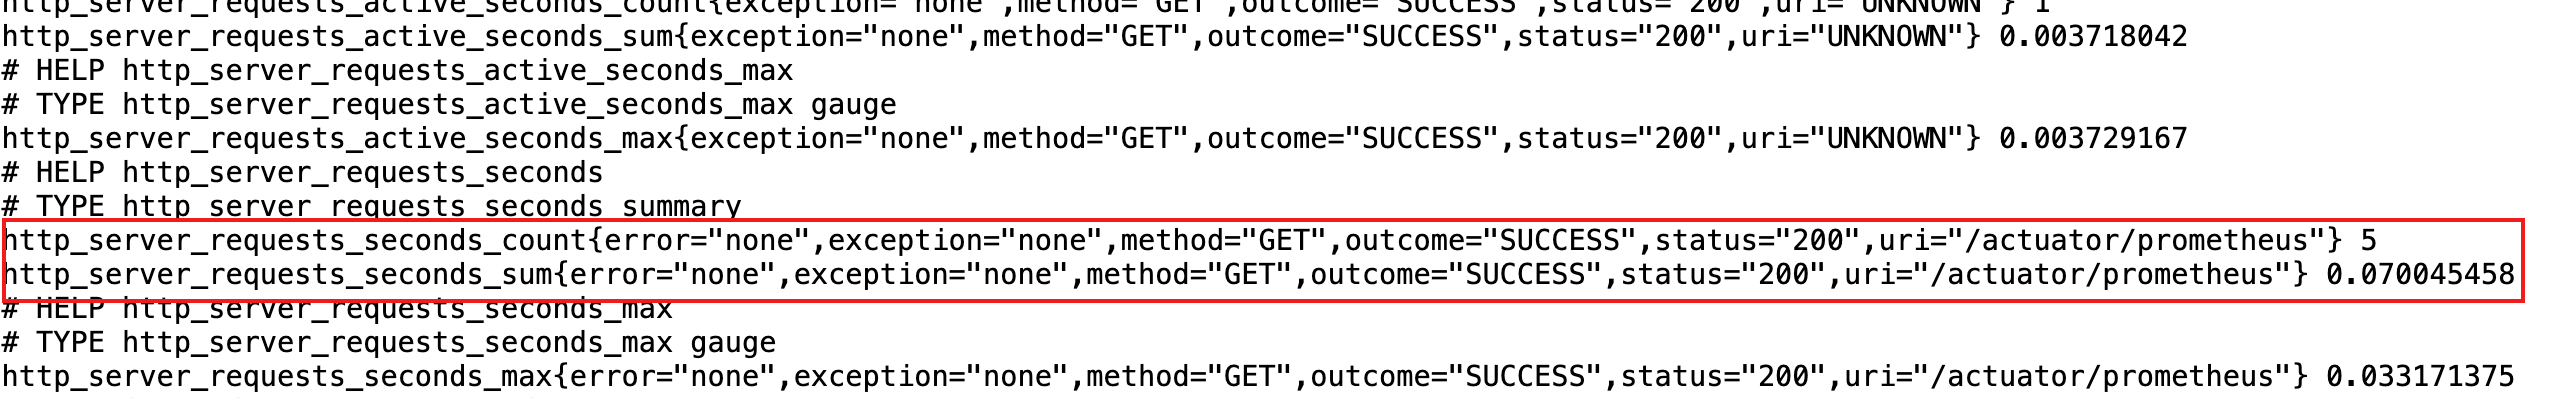
从中可以看到,访问了该端点5次,耗时0.07s。Prometheus中如果配置了抓取job,就可以通过这个端点来查询这个指标。
上图是默认的指标名称,如果修改了指标名如下:
management:
  endpoints:
    web:
      exposure:
        include: "health, info, metrics, prometheus, threaddump"
  observations:
    http:
      client:
        requests:
          name: "application:client_request"
      server:
        requests:
          name: "application:request"
注意,老版本的actuator的配置略有不同,这里以3.4.3为例。
则生成的指标名也会发生改变:
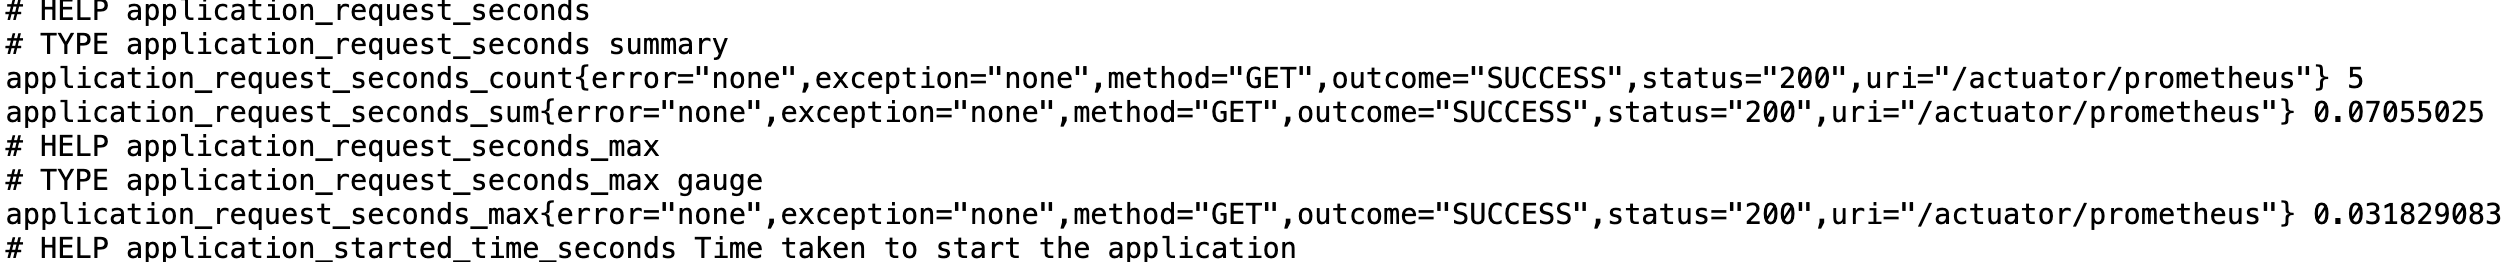
前缀变成了自定义名称,但稍微有点区别,那就是冒号变成了下划线。
这是因为在micrometer库中,会对指标名称就行规范化处理,将特殊字符如:替换成下划线_。
Micrometer 默认会将指标名称中的特殊字符(如 :, ., - 等)替换为下划线 _,以确保兼容性。
具体代码实现在micrometer-registry-prometheus库的PrometheusNamingConvention类的name方法中,其返回为:
return PrometheusNaming.sanitizeMetricName(conventionName);
而sanitizeMetricName方法中使用了replaceIllegalCharsInMetricName方法,其实现如下:
private static String replaceIllegalCharsInMetricName(String name) {
    int length = name.length();
    char[] sanitized = new char[length];
    for (int i = 0; i < length; i++) {
      char ch = name.charAt(i);
      if (ch == '.'
          || (ch >= 'a' && ch <= 'z')
          || (ch >= 'A' && ch <= 'Z')
          || (i > 0 && ch >= '0' && ch <= '9')) {
        sanitized[i] = ch;
      } else {
        sanitized[i] = '_';
      }
    }
    return new String(sanitized);
  }
micrometer-registry-prometheus
Micrometer 为基于 JVM 的应用程序的性能监测数据收集提供了一个通用的 API,支持多种度量指标类型,这些指标可以用于观察、警报以及对应用程序当前状态做出响应。事实上,Actuator默认就包含了 micrometer 的基本库。但为了让度量指标符合Prometheus需要的格式,因此还需要引入micrometer-registry-prometheus。
<dependency>
    <groupId>io.micrometer</groupId>
    <artifactId>micrometer-registry-prometheus</artifactId>
</dependency>
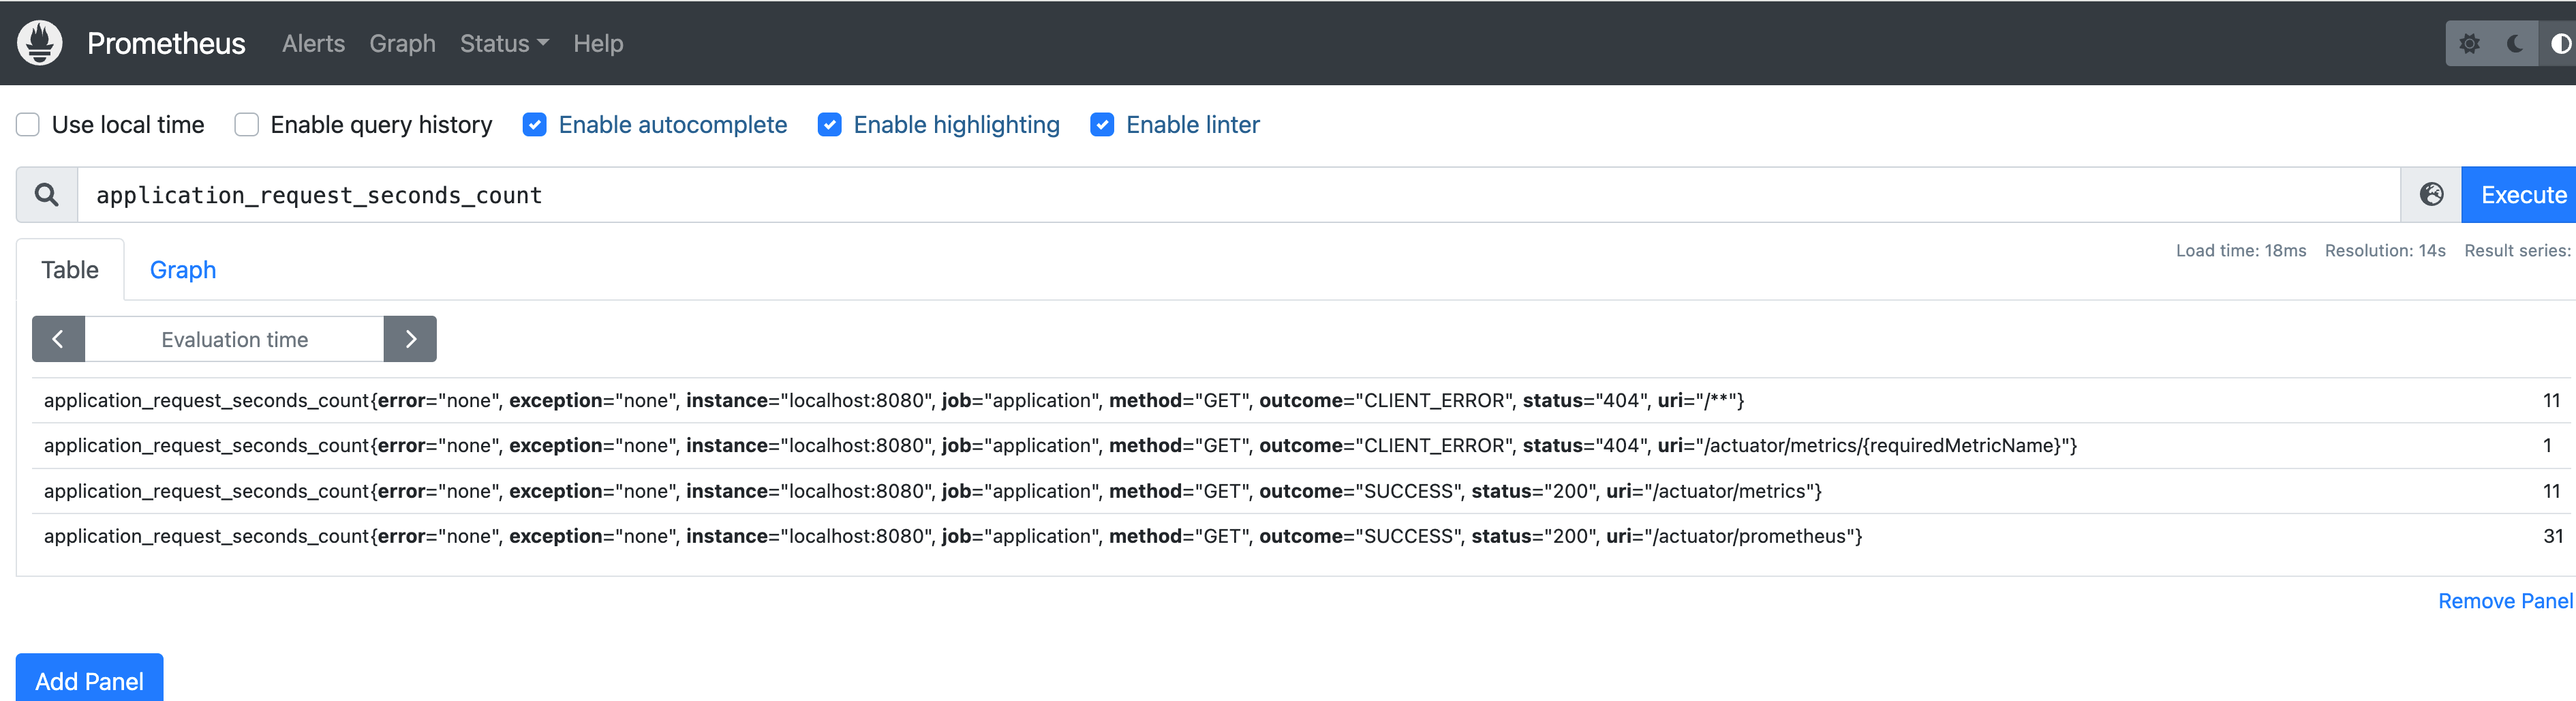
配置好之后,启动项目,访问actuator提供的prometheus端口,就能看到prometheus格式的指标了。
当然,要在prometheus中查询的话还需要配置抓取指标的job:
- job_name: "application"
    scrape_interval: 20s
    scrape_timeout: 20s
    metrics_path: "/actuator/prometheus"
    static_configs:
      - targets: ["localhost:8080"]
actuator 健康检查
Actuator的health端点默认只显示status: UP,如果想扩展健康检查的内容,如数据库、Redis、自定义逻辑等,只需要实现HealthIndicator即可。
内置 Health Check 指示器
事实上,spring-boot-starter-actuator组件已经内置了HealthIndicator的实现,只需要开启management.endpoint.health.show-details=always。
访问/actuator/health端点可以看到如下结果:
{
    "status": "UP",
    "components": {
        "diskSpace": {
            "status": "UP",
            "details": {
                "total": 494384795648,
                "free": 229441642496,
                "threshold": 10485760,
                "path": "/xx/xx/.",
                "exists": true
            }
        },
        "ping": {
            "status": "UP"
        },
        "ssl": {
            "status": "UP",
            "details": {
                "validChains": [],
                "invalidChains": []
            }
        }
    }
}
内置的 redis 健康指示器
假如项目中使用了redis,如何将其添加到health check里面呢?下面以redisson客户端为例进行说明。
spring-boot-starter-actuator中包含了RedisHealthIndicator,只需要在项目中引入redisson依赖,即使不配置redis服务器的连接参数,springboot在启动的时候也会尝试以默认参数,即127.0.0.1:6379来尝试连接redis。访问health端口,可看到components中多一个redis状态信息:
"redis": {
	"status": "UP",
	"details": {
		"version": "7.0.8"
	}
}
停止本地redis,再次访问health端点,会发现此时health是down的:
"redis": {
	"status": "DOWN",
	"details": {
      	"error": "org.springframework.data.redis.RedisSystemException: Unable to write command into connection! Check CPU usage of the JVM. Try to increase nettyThreads setting. Netty pending tasks: 0, Node source: NodeSource [slot=0, addr=null, redisClient=null, redirect=null, entry=null], connection: RedisConnection@1789451741 [redisClient=[addr=redis://localhost:6379,localhost/127.0.0.1:6379], channel=[id: 0xda73cfe7, L:/127.0.0.1:62677 ! R:localhost/127.0.0.1:6379], currentCommand=null, usage=1], command: (INFO), params: [server] after 3 retry attempts"
    }
}
内置的 db 健康指示器
如果项目中使用了DB,想要将其添加到 health check 中也是一样的。
以 postgresql 数据库为例,首先添加依赖:
<dependency>
    <groupId>org.springframework.boot</groupId>
    <artifactId>spring-boot-starter-data-jpa</artifactId>
</dependency>
<dependency>
    <groupId>org.postgresql</groupId>
    <artifactId>postgresql</artifactId>
</dependency>
配置好db的连接参数:
spring:
  datasource:
    username: postgres
    password: yourpassword
    driver-class-name: org.postgresql.Driver
    url: jdbc:postgresql://localhost:5432/postgres
启动项目并访问 health 端点,components 中会增加 db 的状态:
"db": {
	"status": "UP",
	"details": {
		"database": "PostgreSQL",
		"validationQuery": "isValid()"
	}
}
添加其他组件的健康检查也都是类似的方式,actuator 内置了大部分主流组件的 health check 指示器,具体可以参考 actuator 官方文档或代码。
如果是 actuator 不支持的组件,或者想添加自定义的 check 指标又该如何做呢?
扩展自定义检查指标
如果想扩展自定义健康检查指标,也只需要实现HealthIndicator就好。下面添加一个自定义指标:
@Component
public class DummyHealthIndicator implements HealthIndicator {
    @Override
    public Health health() {
        return Health.up().withDetail("execute_time", new Date()).build();
    }
}
再次访问 health 端点会发现返回结果的components中多了一项:
"dummy": {
	"status": "UP",
	"details": {
		"execute_time": "2024-12-16T05:31:52.079+00:00"
	}
}
当然这里只是一个简单的例子,实际情况可能比这个复杂多了。下面我们举一个 quarkus 项目的例子。
在 quarkus 项目中没有spring-boot-starter-actuator,但是有一个类似的组件,那就是quarkus-smallrye-health,其提供了一个 HealthCheck 的接口,与 HealthIndicator 的作用类似,自定义实现 redis 的 health check 如下:
@Readiness
@ApplicationScoped
public class RedisHealthCheck implements HealthCheck {

    private final RedissonClient redissonClient;

    @Inject
    public RedisHealthCheck(final RedissonClient redissonClient) {
        this.redissonClient = redissonClient;
    }

    @Override
    public HealthCheckResponse call() {
        HealthCheckResponseBuilder responseBuilder = HealthCheckResponse.named("Redis connection health check");
        try {
            BaseRedisNodes baseRedisNodes = getRedisNodes();
            if (baseRedisNodes.pingAll()) {
                if (baseRedisNodes instanceof RedisCluster) {
                    responseBuilder.up().withData("masters", ((RedisCluster) baseRedisNodes).getMasters().toString()).withData("slaves", ((RedisCluster) baseRedisNodes).getSlaves().toString());
                } else {
                    responseBuilder.up().withData("master", ((RedisSingle) baseRedisNodes).getInstance().toString());
                }
            } else {
                return responseBuilder.down().withData("Error", "Cannot ping Redis").build();
            }
        } catch (Exception e) {
            return responseBuilder.down().withData("Error", e.getMessage()).build();
        }
        return responseBuilder.build();
    }

    private <T extends BaseRedisNodes> T getRedisNodes() {
        if (redissonClient.getConfig().isClusterConfig()) {
            return (T) redissonClient.getRedisNodes(RedisNodes.CLUSTER);
        } else {
            return (T) redissonClient.getRedisNodes(RedisNodes.SINGLE);
        }
    }
}
Health Check 的作用
Health Check 可以在系统运行时动态地监控和反馈应用或其依赖组件的运行状态,从而确保系统的可用性和稳定性。它通常用于自动化运维、容器编排(如 Kubernetes)、负载均衡器判断服务可用性等场景。
例如可以将 startupProbe,livenessProbe 和 readinessProbe 的路径设置为 health check 的端点。当某个 pod 不可用时及时将其从服务中排除。
如果觉得 health check 太重,也可以只使用探针的 health check,配置如下:
management.endpoint.health.probes.enabled=true
这样就会新增 "livenessState":{"status":"UP"} 和 "readinessState":{"status":"UP"}。对应/actuator/health/liveness 和 /actuator/health/readiness 端点。
Health Check 监控和告警
上面介绍了如何做 health check, 接下来将根据 health check 来生成 prometheus 指标,用来做服务监控和告警。
Prometheus 支持四种类型的指标,分别是 Counter, Guage, Histogram 和 Summary。因此可以用 micrometer 来生成一个 Guage 指标,该指标从 health 端口来获取状态值,将该指标注册到 PrometheusMeterRegistry 中,就可以通过 prometheus 来进行监控和告警了。
实现如下:
@Configuration
public class Health2MetricsBridgeConfig {

    @Autowired
    public void configure(final PrometheusMeterRegistry prometheusMeterRegistry, final HealthEndpoint healthEndpoint) {
        Gauge.builder("application_health_microservice", healthEndpoint, Health2MetricsBridgeConfig::healthToCode)
                .description("Displays the current overall health status of the micro service.")
                .register(prometheusMeterRegistry);
    }

    private static int healthToCode(final HealthEndpoint health) {
        final Status status = health.health().getStatus();
        return statusToCode(status);
    }

    private static int statusToCode(final Status status) {
        return switch (status.getCode()) {
            case "UP" -> 0;
            case "WARN" -> 1;
            default -> 2;
        };
    }
}
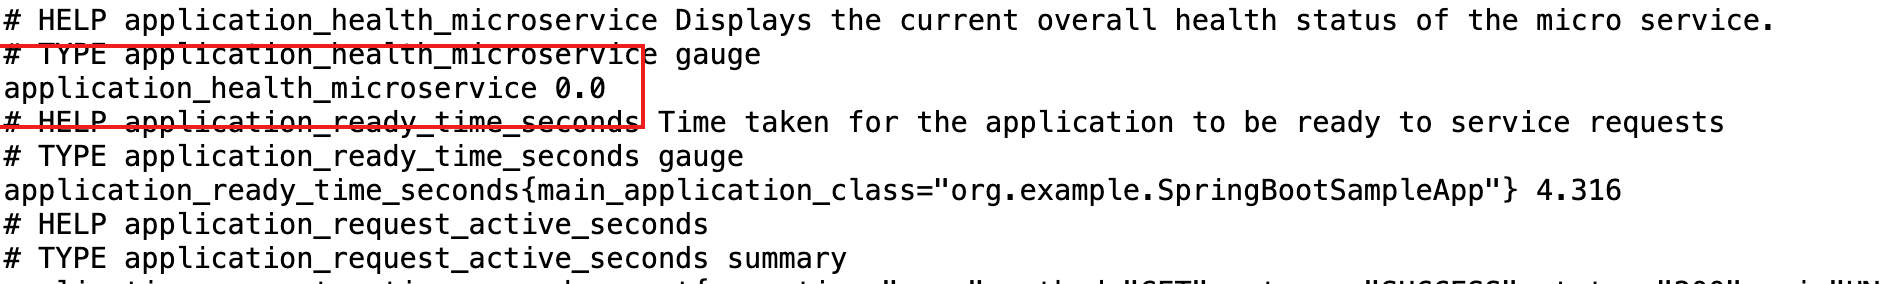
该指标从 health 端点来获取状态信息,并将其映射为 0,1,2。访问 /actuator/prometheus 可以看到指标值:
在 prometheus 告警中添加如下指标即可触发报警:
- alert: your-service_Health_Unavailable
   absent(application_health_microservice{service="your-service"})
   for: 10m
   ...
PromQL表达式
前文说过,Prometheus中有很多函数,可以从不同维度来对指标进行统计。
其中,最常用的有rate(), increase(),irate(), deriv()等函数。
rate表示每秒的速率,increase表示在时间窗口内的增长数量,increase = rate x 时间窗口。
在计算某个时间窗口内的指标变化情况时,比如rate和increase,至少需要两个样本数据。当数据样本少于2个时,无法计算结果。这意味着,你必须选取合适的时间窗口。
通常来说,时间窗口选择的最佳实践是采样间隔时间的四倍。也就是说,如果job的采样间隔时间是15s,则时间窗口为1min比较合适。当使用Grafana时,也可以用$__rate_interval模版变量来自动选择一个合适的时间窗口。
rate()
此函数计算整个采样周期内每秒的增长率。
例如:rate(http_requests_total[5m]) 得出的是HTTP在5分钟窗口内,平均每秒的请求率。作为最常见的函数,它以可预测的每秒输出单位产生平滑的rate。
irate()
即 “瞬时rate”,此函数和rate()一样,计算每秒的增长率,但只对规定采样周期内的最后两个样本进行计算,而忽略前面所有样本。
例如:irate(http_requests_total[5m]) 选取规定5分钟窗口内的最后两个样本,并计算两者之间每秒的增长率。如果想让一个放大的图形显示出对rate变化的快速响应,那这个函数就很有用,它呈现的结果会比rate()的有更多的峰值。
increase()
此函数和 rate() 完全一样,只是它没有将最终单位转换为 “每秒”(1/s)。每个规定的采样周期就是它的最终单位。
例如:increase(http_requests_total[5m]) 得出的是5分钟的采样周期内处理完成的HTTP请求的总增长量(单位1/5m)。因此increase(foo[5m])/ (5 * 60) 等同于rate(foo[5m])。
这三个函数都有一个共同的要求,就是它们在规定的采样周期中都需要有至少两个样本才能运行。少于两个样本的序列将从结果中删除。
如何精准计算在固定时间窗口和该窗口中一些数据点的增长是一个要权衡和不完美的近似值问题。Prometheus选择的方法是在所提供的采样周期中通过有限的数据,来提供平均下来最正确的答案。让我们来看看它是如何做到这点的。
数据外推
rate()和 increase()两个函数的外推经常让人混淆。
例如,对于只有整数增量的counter,increase() 也可能返回非整数结果,如2.5883。这是因为increase() 是在规定时间窗口的总范围内得到counter增长量的近似值(比如increase(foo[5m])中的5分钟)。
实际上,时间窗口中的第一个和最后一个样本,永远不会与规定时间窗口的开始和结束100%重合。因此increase() (以及rate())会在窗口与窗口的界限中外推第一个和最后一个数据点之间的斜率,以得出一个平均而言更接近整个窗口内预期增长的数值(如果在窗口边界确实有样本)。
下图显示了一个使用 rate()的例子,窗口时间为1分钟,采样间隔为15秒,在窗口中发生了一次counter实际增加 1 的情况。
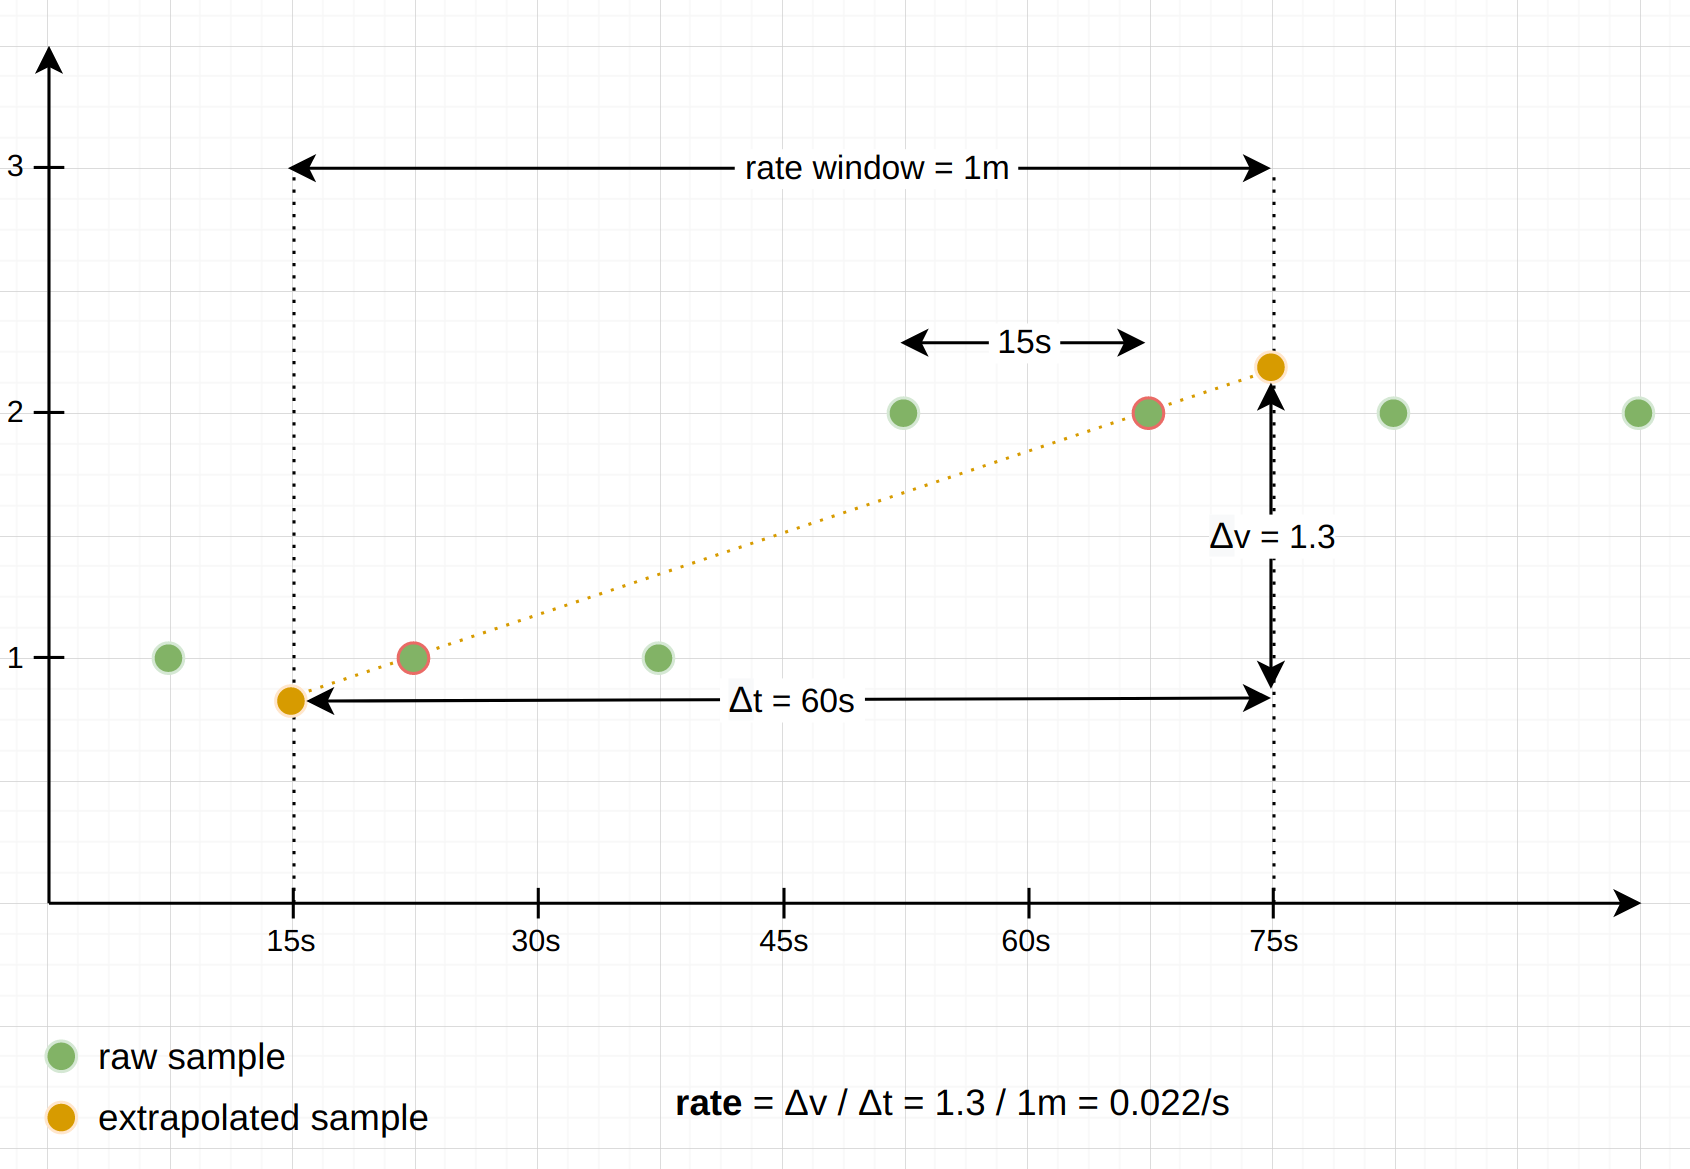
如图所示,报告结果是基于窗口中第一个和最后一个样本之间的斜率产生的,并外推到窗口边界处。
注意,这种外推是有一些例外的:当第一个或最后一个样本距离各自的窗口边界大于窗口中样本之间平均间隔的1.1倍时,序列会在窗口中开始或结束。在这种情况下,外推只向窗口边界延伸半个平均样本区间,而不是全部。同样,函数会避免外推至负值,因为counter总是从0开始,永远不会是负值。相反,只有达到预期值0时,外推才会发生。
避免过度外推如下图所示:
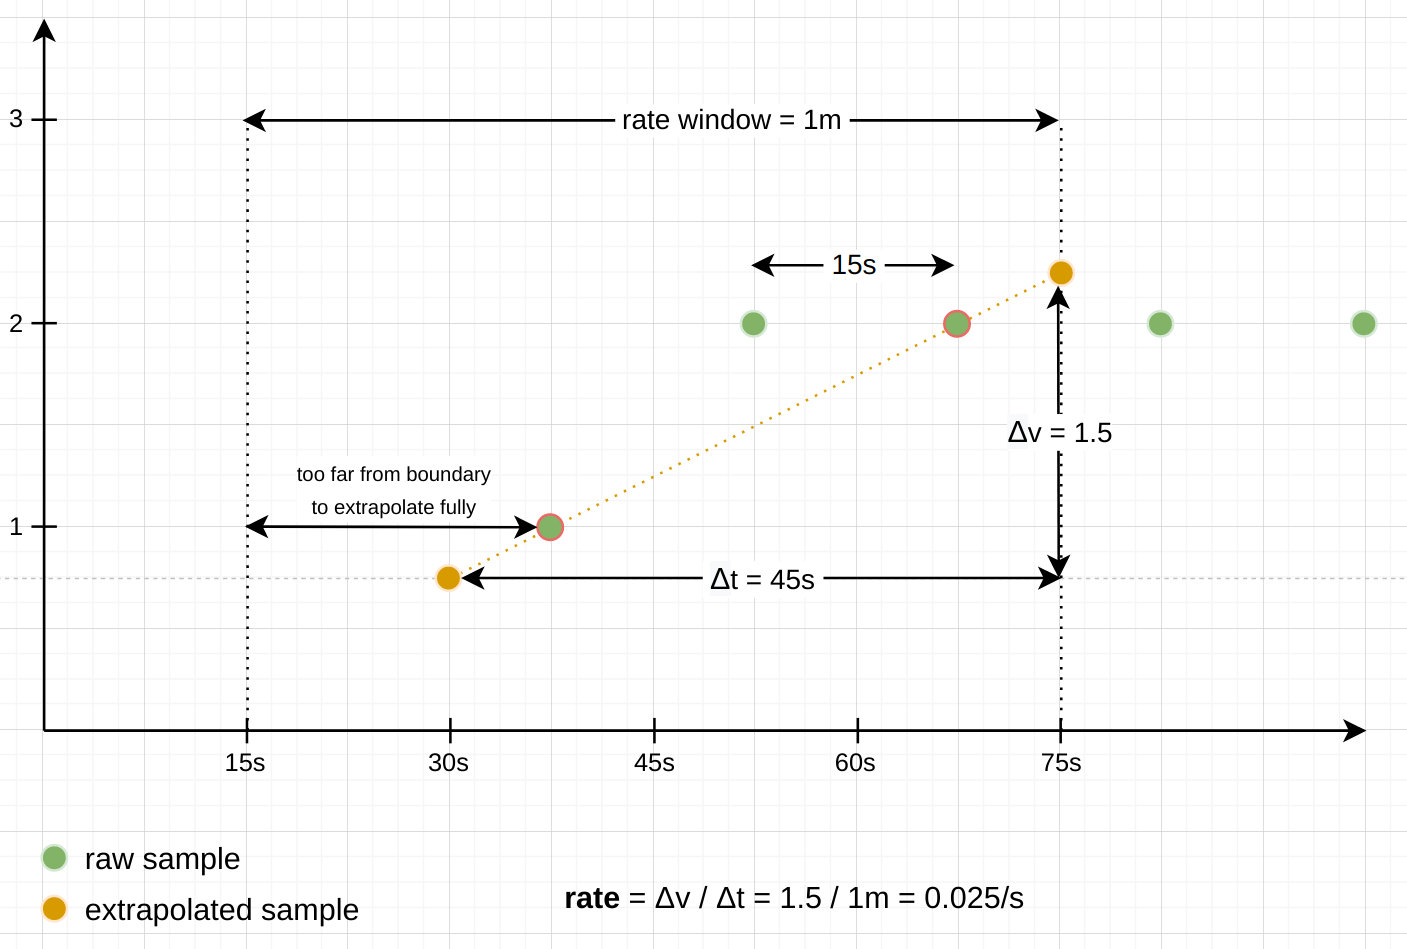
当采样的数据不连续,数据量较少时,通过rate或increase函数画出来的图形可能看起来不符合实际,这正是因为数据外推造成的。
当采样数据保持一定数量且连续不断时,rate函数或increase函数的数据外推机制才符合实际情况。
处理Counter重置
尽管counter一般只会叠加,但在某些情况下,它们也会重置为0 。
为了不把这些重置解释成实际的负rate,和counter相关的函数具有检测和处理这些重置的逻辑:
- 当在提供的时间窗口下迭代样本时,函数会检查是否有任何样本的值比前一个低,并将这种情况解释为counter重置。Counter在重置后总是从0开始,那么根据这个假设,这些函数只是将新的采样值加到之前看到的采样值上,以补偿重置。
参考资料
[1].https://www.cnblogs.com/cjsblog/p/14434883.html
[2].https://promlabs.com/blog/2022/12/11/avoid-these-6-mistakes-when-getting-started-with-prometheus/
[3].https://promlabs.com/blog/2021/01/29/how-exactly-does-promql-calculate-rates/
[4].https://www.metricfire.com/blog/understanding-the-prometheus-rate-function/


 6379
6379


 到【灌水乐园】发言


