


可参考链接,需找开发商量jmx端口暴露方式
https://www.jianshu.com/p/8a5e681b18ce 或者 http://www.mamicode.com/info-detail-2323750.html
上图两个链接为不同的jmx暴露方式,实则大同小异,需跟开发商量,以免程序启动不了
下载jmx_exporter的jar包
创建配置文件namenode.yaml(datanode.yaml)放在任意位置,内容为你想要的metrics
参考配置:
---
startDelaySeconds: 0
hostPort: master:1234 #master为本机IP(一般可设置为localhost);1234为想设置的jmx端口(可设置为未被占用的端口)
#jmxUrl: service:jmx:rmi:///jndi/rmi://127.0.0.1:1234/jmxrmi
ssl: false
lowercaseOutputName: false
lowercaseOutputLabelNames: false
其他参数参考:
| Name | Description |
|---|---|
| startDelaySeconds | start delay before serving requests. Any requests within the delay period will result in an empty metrics set. |
| hostPort | The host and port to connect to via remote JMX. If neither this nor jmxUrl is specified, will talk to the local JVM. |
| username | The username to be used in remote JMX password authentication. |
| password | The password to be used in remote JMX password authentication. |
| jmxUrl | A full JMX URL to connect to. Should not be specified if hostPort is. |
| ssl | Whether JMX connection should be done over SSL. To configure certificates you have to set following system properties:-Djavax.net.ssl.keyStore=/home/user/.keystore-Djavax.net.ssl.keyStorePassword=changeit-Djavax.net.ssl.trustStore=/home/user/.truststore-Djavax.net.ssl.trustStorePassword=changeit |
| lowercaseOutputName | Lowercase the output metric name. Applies to default format and name. Defaults to false. |
| lowercaseOutputLabelNames | Lowercase the output metric label names. Applies to default format and labels. Defaults to false. |
| whitelistObjectNames | A list of ObjectNames to query. Defaults to all mBeans. |
| blacklistObjectNames | A list of ObjectNames to not query. Takes precedence over whitelistObjectNames. Defaults to none. |
| rules | A list of rules to apply in order, processing stops at the first matching rule. Attributes that aren‘t matched aren‘t collected. If not specified, defaults to collecting everything in the default format. |
| pattern | Regex pattern to match against each bean attribute. The pattern is not anchored. Capture groups can be used in other options. Defaults to matching everything. |
| attrNameSnakeCase | Converts the attribute name to snake case. This is seen in the names matched by the pattern and the default format. For example, anAttrName to an_attr_name. Defaults to false. |
| name | The metric name to set. Capture groups from the pattern can be used. If not specified, the default format will be used. If it evaluates to empty, processing of this attribute stops with no output. |
| value | Value for the metric. Static values and capture groups from the pattern can be used. If not specified the scraped mBean value will be used. |
| valueFactor | Optional number that value (or the scraped mBean value if value is not specified) is multiplied by, mainly used to convert mBean values from milliseconds to seconds. |
| labels | A map of label name to label value pairs. Capture groups from pattern can be used in each. name must be set to use this. Empty names and values are ignored. If not specified and the default format is not being used, no labels are set. |
| help | Help text for the metric. Capture groups from pattern can be used. name must be set to use this. Defaults to the mBean attribute decription and the full name of the attribute. |
| type | The type of the metric, can be GAUGE, COUNTER or UNTYPED. name must be set to use this. Defaults to UNTYPED. |
前提:
1.java程序的目录结构展示(因断网环境所以没办法用树状图命令tree来展示,只能截图)
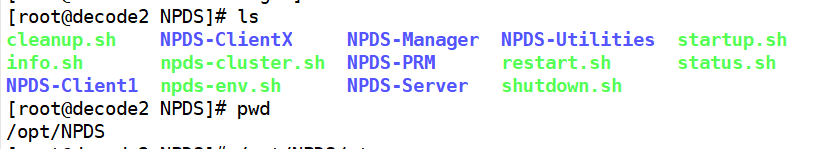
如上图所示,一个服务器有一个java程序,其中子程序包括manager(管理端), server,client,PRM, Utilities,关联关系是agent和server要从manager管理端获取各种参数,server再向agent发包,这样程序就算跑起来了。
这里主要监控server和client
下图为manager和server以及其中一个client的目录结构
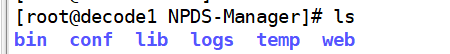
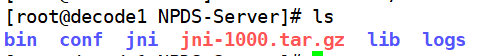
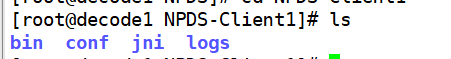
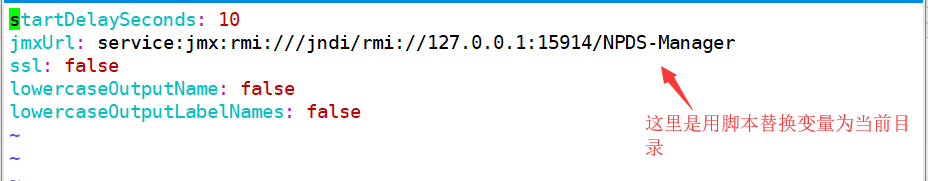
各conf目录下都有一个namenode.conf,内容如下
startDelaySeconds: 10
jmxUrl: service:jmx:rmi:///jndi/rmi://127.0.0.1:${JMX_PORT}/${APP_NAME}
ssl: false
lowercaseOutputName: false
lowercaseOutputLabelNames: false
各conf目录下都有一个namenode.yaml,内容如下(此为manager下conf中的)
各个子程序bin目录下都有关于程序的启动脚本,先执行1脚本启动,然后2脚本是让程序开启一个prometheus jmx端口,以便jmx exporter探针找到这个端口,收集到java程序的metrics信息,达到监控的目的
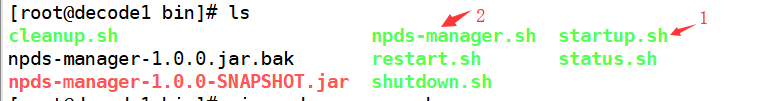
下图是npds-manager.sh脚本中实现开启jmx端口的脚本信息,完整脚本信息在最下面
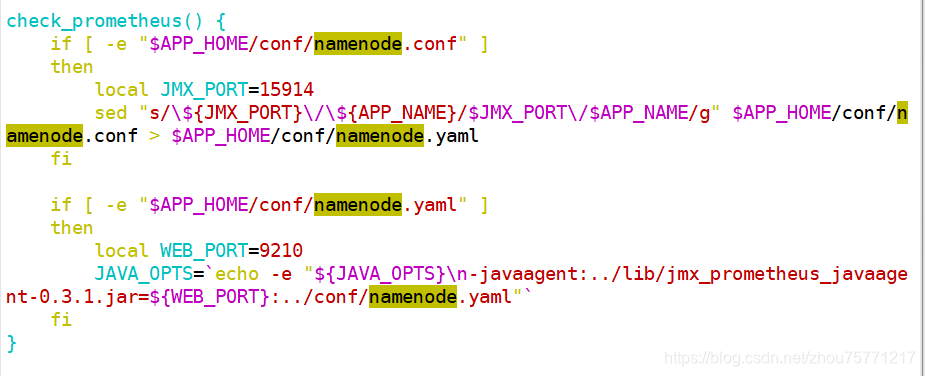
这样启动java程序后,访问ip加自定义的端口9210就能访问到manager的mertrics信息了,达到监控的目的
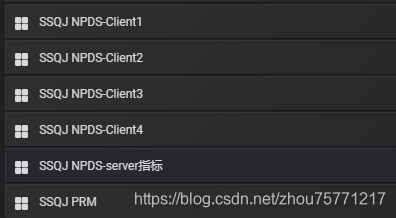
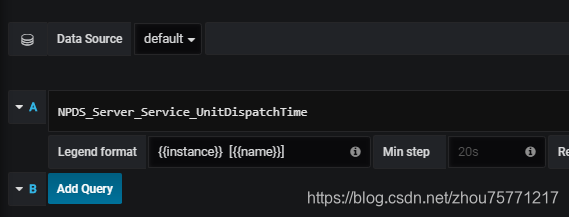
然后找开发要他们想要监控的参数,以我为例要的参数如下图:
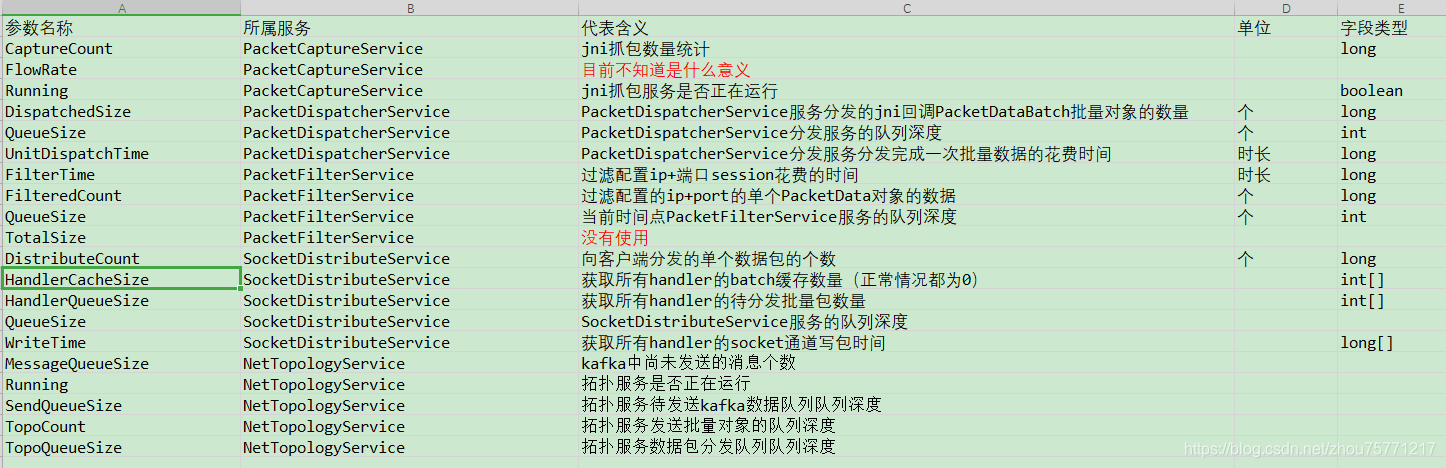
再以此一个个配置,就能实现监控了
vim npds-manager.sh
#!/bin/bash
then
echo "=================================================================="
echo "ERROR: Please set the JAVA_HOME variable in your environment!"
echo "=================================================================="
exit 20
ficd=$(pwd)
if [ ${cd:0-3} != "bin" ]
then
echo "=================================================================="
echo "ERROR: Please execute the script in the bin directory!"
echo "=================================================================="
exit 21
fiAPP_HOME=${cd%/bin}
APP_NAME=NPDS-Manager
APP_MAIN_CLASS=cn.com.greattimes.npds.manager.boot.ManagerBootstrap
JPS_FLAG=ManagerBootstrap
LIBRARY_PATH=$APP_HOME/jni
JAVA_OPTS="-server
-Xmx1G
-Xms1G"DEBUG=0
RET_CODE=0
FORCE_KILL=0
CHECK_STATUS=1
CHECK_STATUS_TIMEOUT=5
check_env() {
local DIR=${APP_HOME:POS+1}if [ ! $DIR == $APP_NAME ]
then
echo "=================================================================="
exit 22
fiif [ ! -d "$APP_HOME/logs" ]
then
mkdir $APP_HOME/logs
fiif [ $DEBUG -eq 1 ]
then
local DBG_PORT=9310
fi
}check_prometheus() {
if [ -e "$APP_HOME/conf/namenode.conf" ]
then
local JMX_PORT=15914
fiif [ -e "$APP_HOME/conf/namenode.yaml" ]
then
local WEB_PORT=9210
fi
}check() {
PID=0
local TMP=$(jps -v | grep $JPS_FLAG | grep $APP_HOME)
TMP=${TMP%% *}if [ ${#TMP} -ne 0 ]
then
PID=$TMP
fiif [ $PID -ne 0 ]
then
RUNNING=1
else
RUNNING=0
fi
}print() {
if [ $QUIET_MODE -eq 1 ]
then
return
fiecho "$1" "$2"
}
if [ ! -n "$1" ]
then
return 2
fips -p $1 > /dev/null
if [ $? -eq 0 ]
then
kill -9 $1
fi
}start() {
checkif [ $RUNNING -eq 1 ]
then
print "=================================================================="
print "WARN: $APP_NAME(PID=$PID) is running."
print "=================================================================="
return 1
fiinfo
if [ $CHECK_STATUS -eq 0 ]
then
print -n "..."
print "------------------------------------------------------------------"
print "WARN: $APP_NAME is started without checking status."
return 1
filocal n=0
for ((; n<$CHECK_STATUS_TIMEOUT; n++))
do
if [ $n -lt 3 ]
then
sleep 1
print -n "."
else
checkif [ $RUNNING -eq 1 ]
then
print "Done!"
return 0
else
sleep 1
fi
fi
done
print "------------------------------------------------------------------"
print "ERROR: $APP_NAME failed to start for unknown reasons. "
print " Please refer to the log file for details."
return 2
stop() {
checkif [ $RUNNING -eq 0 ]
then
print "=================================================================="
print "WARN: $APP_NAME is stopped."
print "=================================================================="
return 1
fiinfo
print -n "Stopping $APP_NAME"if [ $FORCE_KILL -eq 1 ]
then
print -n "..."kill_pid $PID
print "------------------------------------------------------------------"
print "WARN: $APP_NAME was killed by force."
return 1if [ $CHECK_STATUS -eq 0 ]
then
print -n "..."
print "------------------------------------------------------------------"
print "WARN: $APP_NAME is stopped without checking status."
return 1
filocal n=0
for ((; n<$CHECK_STATUS_TIMEOUT; n++))
do
if [ $n -lt 3 ]
then
sleep 1
print -n "."
else
checkif [ $RUNNING -eq 0 ]
then
print "Done!"
return 0
else
sleep 1
fi
fi
donekill_pid $PID
print "------------------------------------------------------------------"
print "WARN: $APP_NAME was killed for stopping timeout."
return 1
}restart() {
checkif [ $RUNNING -eq 1 ]
then
if [ $CHECK_STATUS -eq 0 ]
then
FORCE_KILL=1
fi
stop
fistart
}status() {
checkif [ $RUNNING -eq 0 ]
then
print "=================================================================="
print "INFO: $APP_NAME is stopped."
print "=================================================================="
return 0
else
print "=================================================================="
print "INFO: $APP_NAME(PID=$PID) is running."
print "=================================================================="
return 1
fi
}info() {
if [ $QUIET_MODE -eq 1 ]
then
return
fiecho "=================================================================="
echo "$APP_NAME Information:"
echo "------------------------------------------------------------------"
echo "JAVA_HOME=$JAVA_HOME"
echo "CLASS_PATH=$CLASS_PATH"
echo
echo `$JAVA_HOME/bin/java -version`
echo "APP_HOME=$APP_HOME"
echo "APP_MAIN_CLASS=$APP_MAIN_CLASS"
echo "=================================================================="
}check_env
if [ $# -gt 1 ]
then
for v in $@
do
if [ "$v" == "$1" ]
then
continue
fi
case "$v" in
'--quiet')
QUIET_MODE=1
;;
'--nocheck')
CHECK_STATUS=0
;;
'--force')
FORCE_KILL=1
;;
*)
;;
esac
done
ficase "$1" in
'start')
check_prometheus
start
;;
'stop')
check_prometheus
stop
;;
'restart')
check_prometheus
restart
;;
'status')
status
;;
'info')
info
;;
*)
echo "=================================================================="
echo "Usage: $0 <commands> [options]"
echo "------------------------------------------------------------------"
echo "where commands include:"
echo
echo -e " start [options]"
echo -e " --quiet\twithout console output"
echo -e " --nocheck\twithout checking status"
echo
echo -e " stop [options]"
echo -e " --quiet\twithout console output"
echo -e " --nocheck\twithout checking status"
echo -e " --force\tforce-kill"
echo
echo -e " restart [options]"
echo -e " --quiet\twithout console output"
echo -e " --nocheck\twithout checking status"
echo -e " --force\tstart after force-kill"
echo
echo -e " status \t\tdisplay running status"
echo
echo -e " info \t\tdisplay environment information"
echo "=================================================================="
;;
esacRET_CODE=`echo $?`
exit $RET_CODE


 1215
1215

 被折叠的 条评论
为什么被折叠?
被折叠的 条评论
为什么被折叠?
 到【灌水乐园】发言


