Model Representation代码展示
import numpy as np
import matplotlib.pyplot as plt
x_train = np.array([1.0, 2.0])
y_train = np.array([300.0, 500.0])
print(f"x_train = {x_train}")
print(f"y_train = {y_train}")
print(f"x_train.shape:{x_train.shape}")
m = x_train.shape[0]
print(f"Number of training examples is:{m}")
m = len(x_train)
print(f"Number of training examples is:{m}")
x_i = x_train[0]
y_i = y_train[0]
print(f"x^(i)={x_i},y^(i)={y_i}")
plt.scatter(x_train, y_train)
plt.title("Housing Price")
plt.show()
def compute_model_output(x, w, b):
m = x.shape[0]
f_wb = np.zeros(m)
print(f_wb)
for i in range(m):
f_wb[i] = w * x[i] + b
return f_wb
w = 100
b = 100
tmp_f_wb = compute_model_output(x_train, w, b)
print(tmp_f_wb)
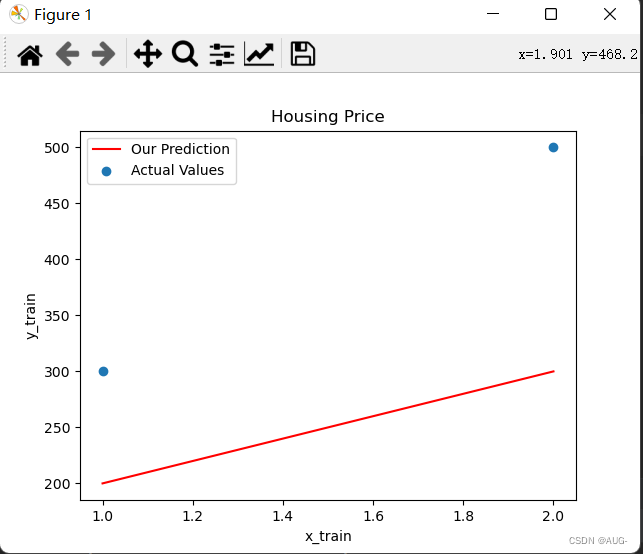
plt.plot(x_train, tmp_f_wb, c='red', label='Our Prediction')
plt.scatter(x_train, y_train, label='Actual Values')
plt.title("Housing Price")
plt.xlabel('x_train')
plt.ylabel('y_train')
plt.legend()
plt.show()
w = 200
b = 100
x_i = 1.2
cost = w * x_i + b
print(f"预测的价格是:{cost}")
输出
Cost Function代码
import numpy as np
import matplotlib.pyplot as plt
x_train = np.array([1.0, 2.0])
y_train = np.array([300.0, 500.0])
def compute_cost(x, y, w, b):
m = x.shape[0]
cost_sum = 0
for i in range(m):
f_wb = w * x[i] + b
cost = (f_wb - y[i]) ** 2
cost_sum = cost_sum + cost
total_cost = cost_sum/(2*m)
return total_cost


 1068
1068

 被折叠的 条评论
为什么被折叠?
被折叠的 条评论
为什么被折叠?
 到【灌水乐园】发言


