How to Draw Graph(一)

本文探讨了如何在二维平面上展示图论中的图,并强调了如何通过算法保持图中Group的结构。介绍了一种使用梯度下降法来最小化能量函数的方法,以确定顶点的最佳坐标。
我们这里讨论的图是图论中的图,主要是研究如何将图显示在一个2D的平面上。首先举一个例子,考虑一个随机图:

我们定义3n个顶点,分成3个团(Group),我们定义:

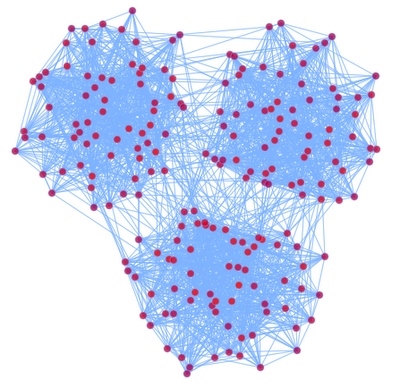
p(vi,vj)为vi和vj有边的概率,如果vi,vj属于同一个团,我们去比较大的概率,否则取比较小的概率。这样我们定义了一个有3个Group的随机图。

如果我们想把这个图在2D平面上显示出来,我们希望显示出来的图也能够显示出这种Group的结构。下面就是我们根据一定算法画出来的图:


对于画图的问题,我们可以如下定义:

给定一个图G{V,E},我们的任务是为每个顶点选择2D坐标vi(x,y),以最小化一个我们定义的能量函数E(V,E)。

首先我们考虑最小化的算法,我们可以用经典的梯度下降法,算法如下:
1. 对顶点vi,i=1,2,......,|V|,随机生成每个顶点的坐标。
2. for t = 1 to T:
       for i = 1 to |V|:
           计算E相对于vi的梯度下降方向ei,并产生vi的下一个位置 vi(t+1) = vi(t) + alpha * e,alpha是步长

这就是梯度下降法的步骤,当然还可以用很多优化算法,比如共轭梯度法,或者进化计算的方法。下面我们主要考虑如何设计能量函数E,E的设计我们将得到分子结构的启发。 
### Nebula Graph Retrieval-Augmented Generation Implementation and Usage In the context of implementing a Retrieval-Augmented Generation (RAG) system with Nebula Graph, one can draw parallels to how systems like GraphRAG operate by integrating graph-based indexing, retrieval, and generation phases. For Nebula Graph specifically, this involves leveraging its capabilities as a distributed graph database to enhance information retrieval processes. #### Integration of RAG Components Using Nebula Graph The process begins with **graph-based indexing**, where data from various sources is indexed within Nebula Graph's structure. This allows for efficient querying based on relationships between entities stored in the graph format[^1]. For **retrieval**, queries are formulated using nGQL (the query language used by Nebula Graph). These queries target specific patterns or paths through the graph that match user input or document content. The efficiency here comes not just from searching but also traversing connections efficiently due to the inherent nature of graphs being optimized for such operations[^2]. Finally, during the **generation phase**, retrieved results inform subsequent actions—whether it be summarization, question answering, etc.—by providing contextualized insights derived directly from structured relational data represented within Nebula Graph. Machine learning models trained on similar datasets could then generate responses augmented by these precise retrievals. ```python from nebula3.gclient.net import ConnectionPool from nebula3.Config import Config config = Config() connection_pool = ConnectionPool() # Establish connection parameters according to your setup. session = connection_pool.get_session('root', 'password') query = "MATCH p=(n)-[r]->(m) WHERE n.name='example' RETURN p LIMIT 10" result = session.execute(query) for row in result.rows(): print(row) ``` This code snippet demonstrates establishing a basic connection to a Nebula Graph instance and executing an example pattern-matching query which might serve as part of the retrieval mechanism in a larger RAG framework. --related questions-- 1. How does the performance characteristic of Nebula Graph compare when utilized in large-scale RAG applications? 2. What machine learning frameworks integrate seamlessly with Nebula Graph for enhancing generative tasks? 3. Can you provide examples of industries benefiting most significantly from applying RAG techniques over Nebula Graph databases? 4. Are there any open-source projects demonstrating full-stack implementations combining Nebula Graph with RAG methodologies?
评论 3
添加红包

请填写红包祝福语或标题

红包个数最小为10个

红包金额最低5元

当前余额3.43前往充值 >
需支付:10.00
成就一亿技术人!
领取后你会自动成为博主和红包主的粉丝 规则
hope_wisdom
发出的红包
实付
使用余额支付
点击重新获取
扫码支付
钱包余额 0

抵扣说明:

1.余额是钱包充值的虚拟货币,按照1:1的比例进行支付金额的抵扣。
2.余额无法直接购买下载,可以购买VIP、付费专栏及课程。

余额充值