


在Qt中创建一个折线图并固定y轴显示最后的10个数据点,你可以使用Qt Charts模块。以下是一个简单的示例,展示了如何创建一个带有QLineSeries的折线图,并限制y轴只显示最后的10个数据点。
首先,确保你已经在你的项目中添加了Qt Charts模块。你可以在你的CMakeLists.txt或.pro文件中添加以下内容:
CMakeLists.txt:
find_package(Qt6 REQUIRED COMPONENTS Charts Core Gui Widgets)

# Then link the necessary libraries
target_link_libraries(your_target_name PRIVATE Qt6::Charts Qt6::Core Qt6::Gui Qt6::Widgets)
.pro文件:
QT += charts core gui widgets |
然后,下面是一个完整的示例程序:
main.cpp:
#include <QtWidgets/QApplication>
#include <QtWidgets/QMainWindow>
#include <QtCharts/QChartView>
#include <QtCharts/QLineSeries>
#include <QtCharts/QValueAxis>
#include <vector>

class MainWindow : public QMainWindow {
    Q_OBJECT

public:
    MainWindow(QWidget *parent = nullptr) : QMainWindow(parent), series(new QLineSeries()), chart(new QChart()) {
        QChartView *chartView = new QChartView(chart, this);
        chartView->setRenderHint(QPainter::Antialiasing);
        setCentralWidget(chartView);

        chart->addSeries(series);
        chart->createDefaultAxes();

        // Set up the Y-axis to only show the last 10 points
        QValueAxis *axisY = qobject_cast<QValueAxis *>(chart->axes(Qt::Vertical).first());
        axisY->setRange(0, 10);  // Fix the range of Y-axis from 0 to 10

        // Initialize data
        for (int i = 0; i < 10; ++i) {
            data.push_back(i);  // Initial fill with some data
            series->append(i, i);  // Append initial data to the series
        }

        // Setup a timer to simulate new data points
        QTimer *timer = new QTimer(this);
        connect(timer, &QTimer::timeout, this, &MainWindow::addNewPoint);
        timer->start(1000);  // Add a new point every second
    }

private slots:
    void addNewPoint() {
        // Generate a new random data point
        int newValue = qrand() % 11;  // Simulate data between 0 and 10

        // Remove the oldest point
        if (data.size() == 10) {
            series->remove(0);  // Remove the first point from the series
            data.erase(data.begin());  // Remove the first element from the data
        }

        // Add the new point to the end
        data.push_back(newValue);
        series->append(data.size() - 1, newValue);

        // Optionally, scroll the chart to always show the last points
        chart->axisX()->setRange(0, 10);
    }

private:
    QLineSeries *series;
    QChart *chart;
    std::vector<int> data;
};

int main(int argc, char *argv[]) {
    QApplication app(argc, argv);
    MainWindow window;
    window.resize(800, 600);
    window.show();
    return app.exec();
}

#include "main.moc"
说明:
- 创建
MainWindow类:继承自QMainWindow,并包含一个QLineSeries对象和一个QChart对象。 - 初始化图表:在构造函数中,设置图表视图,并将初始的10个数据点添加到折线图中。
- 设置Y轴范围:将Y轴范围固定为0到10。
- 添加定时器:使用
QTimer每秒添加一个新的数据点,并移除最旧的数据点以保持数据点数为10。 - 更新图表:在
addNewPoint槽函数中,移除最旧的数据点并添加最新的数据点,同时更新X轴范围以确保显示最新的10个点。
这个示例展示了如何在Qt中创建一个动态更新的折线图,并保持Y轴只显示最后的10个数据点。
上面将MainWindow 的头文件和源文件分开
将 MainWindow 的头文件和源文件分开是更常见的做法,这有助于代码的组织和维护。下面是如何将之前的示例拆分为头文件和源文件。
mainwindow.h:
#ifndef MAINWINDOW_H
#define MAINWINDOW_H

#include <QMainWindow>
#include <QtCharts/QChart>
#include <QtCharts/QLineSeries>
#include <vector>
#include <QTimer>

QT_CHARTS_USE_NAMESPACE

class MainWindow : public QMainWindow {
    Q_OBJECT

public:
    MainWindow(QWidget *parent = nullptr);
    ~MainWindow();

private slots:
    void addNewPoint();

private:
    QLineSeries *series;
    QChart *chart;
    std::vector<int> data;
    QTimer *timer;
};

#endif // MAINWINDOW_H
mainwindow.cpp:
#include "mainwindow.h"
#include <QtWidgets/QApplication>
#include <QtCharts/QChartView>
#include <QtCharts/QValueAxis>
#include <cstdlib> // For qrand() and srand()
#include <ctime>   // For time()

MainWindow::MainWindow(QWidget *parent)
    : QMainWindow(parent), series(new QLineSeries()), chart(new QChart()), timer(new QTimer(this)) {
    QChartView *chartView = new QChartView(chart, this);
    chartView->setRenderHint(QPainter::Antialiasing);
    setCentralWidget(chartView);

    chart->addSeries(series);
    chart->createDefaultAxes();

    // Set up the Y-axis to only show the last 10 points (0-9 indexes)
    QValueAxis *axisY = qobject_cast<QValueAxis *>(chart->axes(Qt::Vertical).first());
    axisY->setRange(0, 10); // Fix the range of Y-axis from 0 to 10

    // Initialize random seed
    std::srand(std::time(nullptr));

    // Initialize data
    for (int i = 0; i < 10; ++i) {
        data.push_back(std::rand() % 11); // Initial fill with random data
        series->append(i, data.back());   // Append initial data to the series
    }

    // Connect timer to addNewPoint slot
    connect(timer, &QTimer::timeout, this, &MainWindow::addNewPoint);
    timer->start(1000); // Add a new point every second
}

MainWindow::~MainWindow() {
    // Clean up, if necessary
}

void MainWindow::addNewPoint() {
    // Generate a new random data point
    int newValue = std::rand() % 11; // Simulate data between 0 and 10

    // Remove the oldest point
    if (data.size() == 10) {
        series->remove(0); // Remove the first point from the series
        data.erase(data.begin()); // Remove the first element from the data
    }

    // Add the new point to the end
    data.push_back(newValue);
    series->append(data.size() - 1, newValue);

    // Scroll the chart to always show the last points (optional)
    // Note: This might not be necessary depending on your use case
    // chart->axisX()->setRange(0, 10); // Uncomment if you want to fix the X-axis range

    // Alternatively, to keep the X-axis dynamic but show the last 10 points:
    // Adjust the X-axis range to keep the last 10 points visible
    if (data.size() > 1) {
        chart->axisX()->setRange(data.size() - 10, data.size() - 1);
    } else {
        chart->axisX()->setRange(0, data.size() - 1);
    }
}
main.cpp:
#include <QtWidgets/QApplication>
#include "mainwindow.h"

int main(int argc, char *argv[]) {
    QApplication app(argc, argv);
    MainWindow window;
    window.resize(800, 600);
    window.show();
    return app.exec();
}
说明:
- 头文件 (
mainwindow.h):定义了MainWindow类,包括其构造函数、析构函数、私有槽函数addNewPoint,以及私有成员变量。 - 源文件 (
mainwindow.cpp):实现了MainWindow类的构造函数、析构函数和addNewPoint槽函数。在构造函数中,初始化了图表、数据、定时器等,并设置了必要的连接。 - 主函数文件 (
main.cpp):创建了QApplication对象和MainWindow对象,并启动了应用程序的事件循环。
请注意,我在 addNewPoint 函数中添加了一些代码来处理 X 轴的范围,以确保总是显示最后的 10 个数据点。根据你的具体需求,你可能需要调整这部分代码。如果你希望 X 轴始终是从 0 到 9(即固定显示 10 个点),则只需保持原来的 chart->axisX()->setRange(0, 10); 即可。如果你希望 X 轴是动态的,但总是显示最后的 10 个点,则使用我提供的替代方案。
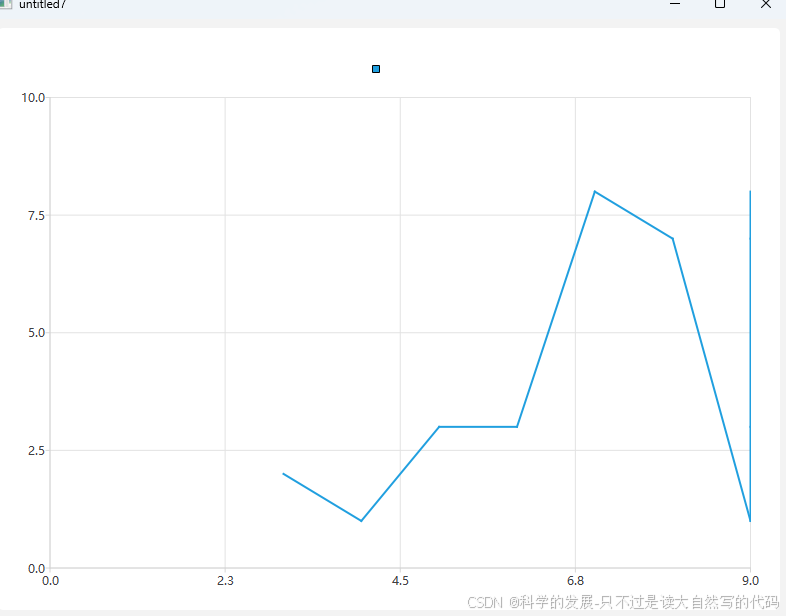
运行效果


 被折叠的 条评论
为什么被折叠?
被折叠的 条评论
为什么被折叠?
 到【灌水乐园】发言


