


 本文展示了如何使用Echarts创建具有颜色渐变效果的柱状图,通过LinearGradient实现从红色到黑色的渐变。代码示例中详细说明了配置项,包括数据、坐标轴设置和itemStyle的定义,帮助读者理解并应用到自己的项目中。
Echarts 柱状图 颜色渐变 渐变规则
废话不多say 上代码
👍记得点赞哦 😄
👇大佬请看👇
- 颜色渐变控制:
color: new echarts.graphic.LinearGradient(
1, 0, 0, 0,
          [
            {offset: 0, color: '#D40F76'},
            {offset: 1, color: '#339DD9'}
          ]
        )
- 具体写法 Html
<div id="even_reporting"></div>
- 具体写法 Js
方法名(){
let even_reporting = echarts.init(document.getElementById("even_reporting"));
option = {
xAxis: [
{
type: 'category',
data: ['1','2','3','4','5'],
axisPointer: {
type: 'shadow'
}
}
],
yAxis: [
{
type: 'value',
name: '渐变',
min: 0,
max: 250,
interval: 50,
}
],
series: [{
name: '渐变',
type: 'bar',
data: [30, 60, 35, 150, 120,],
itemStyle: {
normal: {
color: new echarts.graphic.LinearGradient(
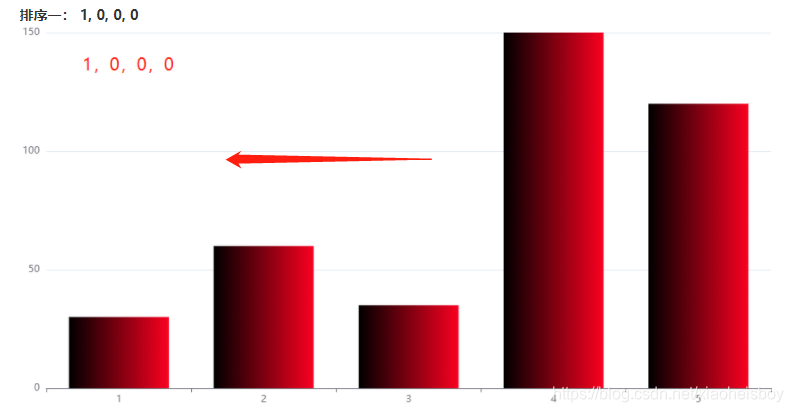
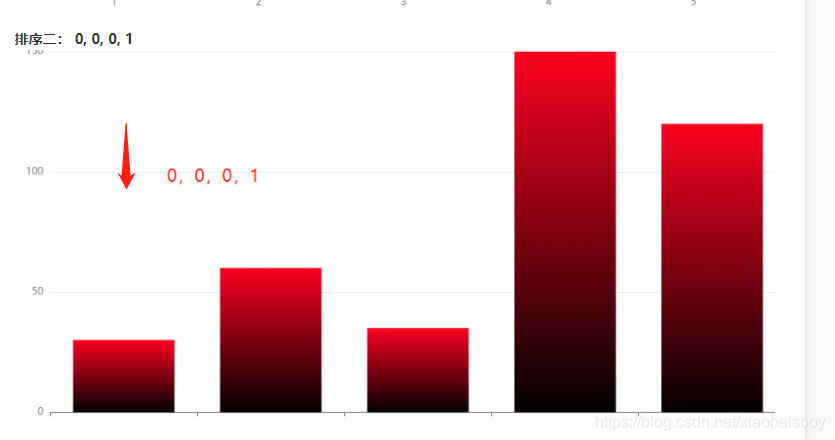
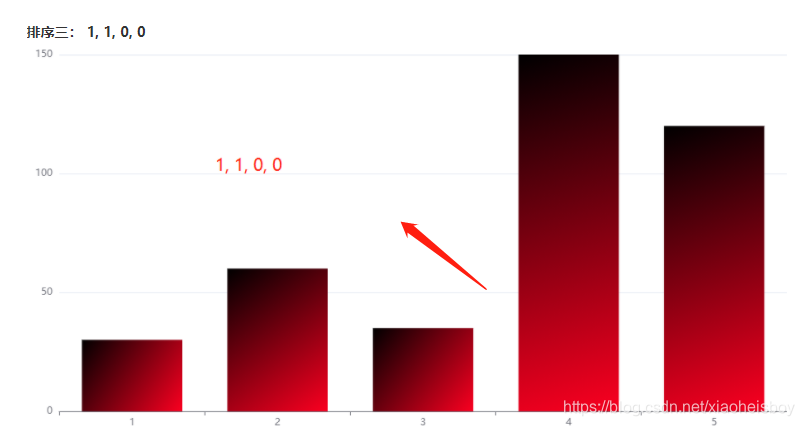
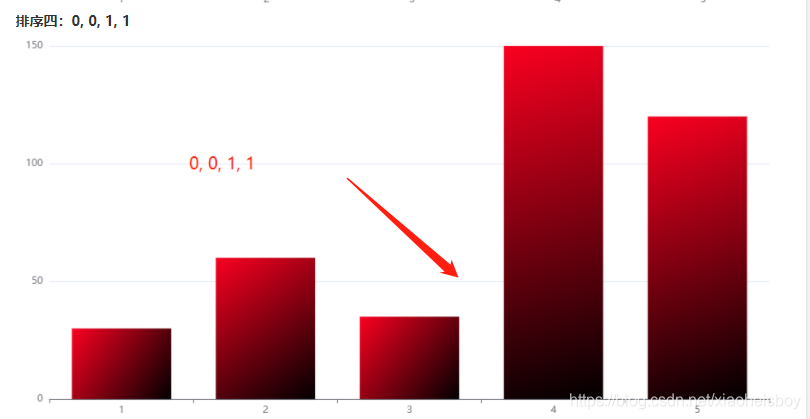
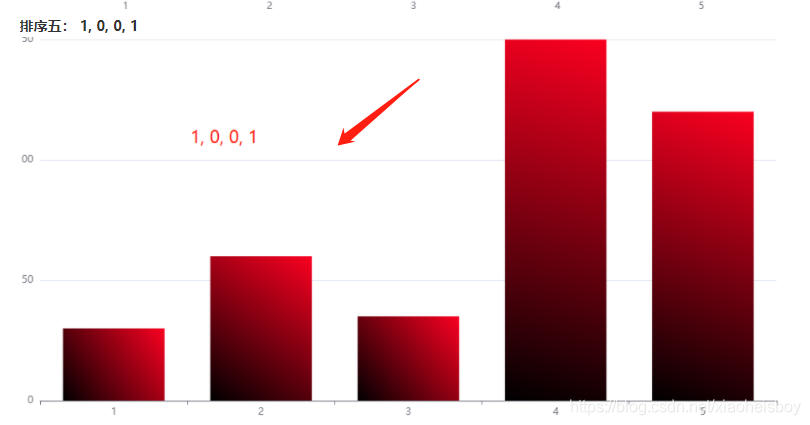
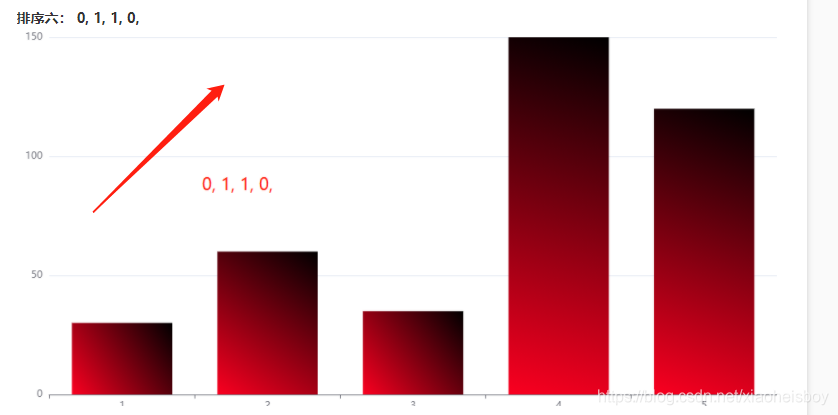
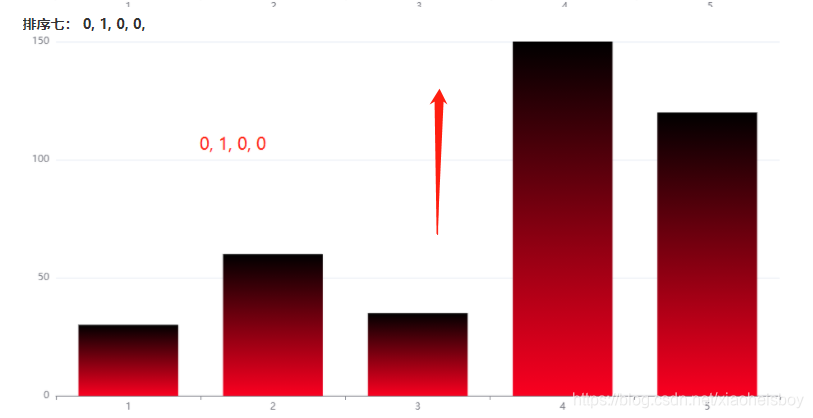
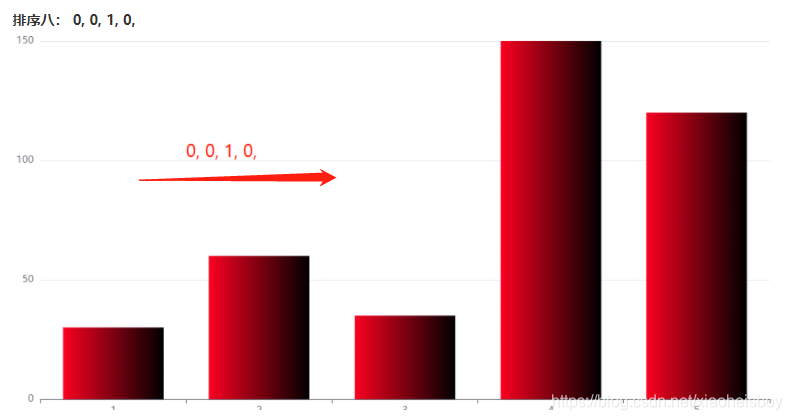
1, 0, 0, 0, // 这里不同的排序会出现不同的效果 查看4 渐变规则
[
{offset: 0, color: '#fa0020'}, // 红
// 可以加0.2等
{offset: 1, color: '#000000'}, // 黑
]
)
},
},
}]
even_reporting.setOption(option);
}
-
效果:
-
渐变规则
都看👓完了,就👍1️⃣👇吧


 1860
1860

 被折叠的 条评论
为什么被折叠?
被折叠的 条评论
为什么被折叠?
 到【灌水乐园】发言


