


程序员还是要学数学
# 导入需要用到的库
import numpy as np
import matplotlib.pyplot as plt
# 定义存储输入数据( x )和目标数据( y )的数组
x, y = [], []
# 遍历数据集,变量sample 对应的正是一个个样本
for sample in open("D:\machinellearning\MachineLearning-master\MachineLearning-master\_Data\prices.txt", "r"):
# 由于数据是用逗号隔开的,所以调用Python 中的split 方法并将逗号作为参数传入
xx, yy = sample.split(",")
# 将字符串数据转化为浮点数
x.append(float(xx))
y.append(float(yy))
# 读取完数据后,将它们转化为Numpy 数组以方便进一步的处理
x, y = np.array(x), np.array(y)
# 标准化
x = (x - x.mean()) / x.std()
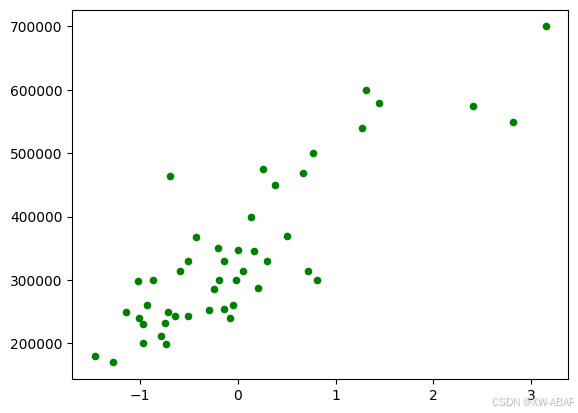
# 将原始数据以散点爵的形式画出
plt.figure()
plt.scatter(x, y, c="g", s=20)
plt.show()
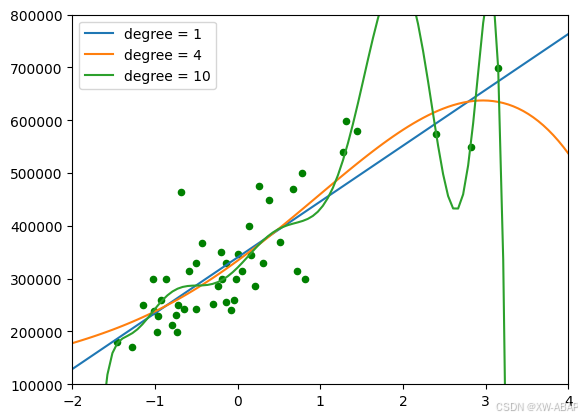
# 在(- 2,4)这个区间上取100 个点作为画图的基础
x0 = np.linspace(-2, 4, 100)
# 利用Numpy 的函数定义训练并返回多项式回归模型的函数
# deg 参数代表着模型参数中的n ,亦即模型中多项式的次数
# 返回的模型能够根据输入的x (默认是xO ),返回相对应的预测的y
def get_model(deg):
return lambda input_x=x0: np.polyval(np.polyfit(x,y,deg), input_x)
# 根据参数n 、输入的x 、y 返回相对应的损失
def get_cost(deg, input_x, input_y):
return 0.5 * ((get_model(deg)(input_x) - input_y) ** 2).sum()
# 定义测试参数集并根据它进行各种实验
test_set = (1, 4, 10)
for d in test_set:
# 输出相应的损失
print(get_cost(d, x, y))
# 画出相应的图像
plt.scatter(x, y, c="g", s=20)
for d in test_set:
plt.plot(x0, get_model(d)(), label="degree = {}".format(d))
# 将横轴、纵轴的范围分别限制在(- 2 均、( 105, 8 x 10⁵)
plt.xlim(-2, 4)
plt.ylim(1e5, 8e5)
# 调用legend 方法使曲线对应的label 正确显示
plt.legend()
plt.show()
96732238800.35292
94112406641.67741
75874846680.09283


 2150
2150

 被折叠的 条评论
为什么被折叠?
被折叠的 条评论
为什么被折叠?
 到【灌水乐园】发言


