


第一步:下载echarts
npm install echarts --save
开发:
main.js
//引入echart:
import echarts from 'echarts'
//注册
Vue.prototype.$echarts = echarts
第三步:引入echarts
//第一种引入方法
import echarts from 'echarts'
//第一种方法不出来用下面这种
import * as echarts from 'echarts'
第四步:初始化
let myChart = echarts.init(document.getElementById('chart_example'));
第五步:定义数据
let option = {
xAxis: {
type: "category",
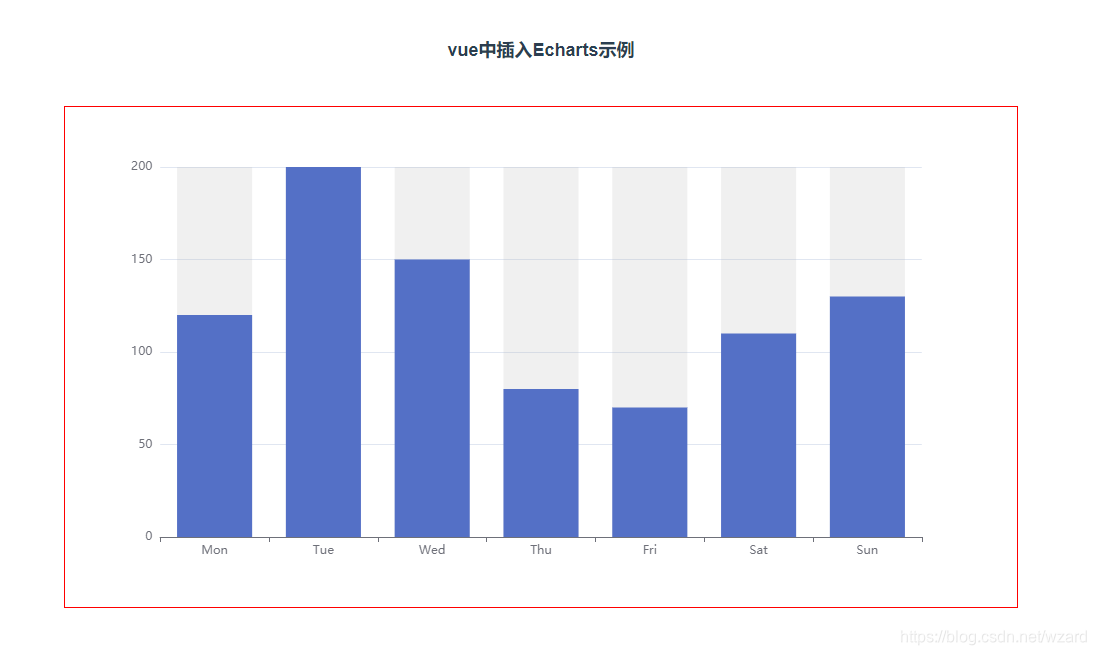
data: ["Mon", "Tue", "Wed", "Thu", "Fri", "Sat", "Sun"],
},
yAxis: {
type: "value",
},
series: [
{
data: [120, 200, 150, 80, 70, 110, 130],
type: "bar",
showBackground: true,
backgroundStyle: {
color: "rgba(180, 180, 180, 0.2)",
},
},
],
};
第六步:绘制
myChart.setOption(option);
效果图
完整代码
<template>
  <div>
    <h2>vue中插入Echarts示例</h2>
    <div id="chart_example"></div>
  </div>
</template>

<script>
import * as echarts from "echarts";
export default {
  data() {
    return {};
  },
  mounted() {
    let this_ = this;
    let myChart = echarts.init(document.getElementById("chart_example"));
    let option = {
      xAxis: {
        type: "category",
        data: ["Mon", "Tue", "Wed", "Thu", "Fri", "Sat", "Sun"],
      },
      yAxis: {
        type: "value",
      },
      series: [
        {
          data: [120, 200, 150, 80, 70, 110, 130],
          type: "bar",
          showBackground: true,
          backgroundStyle: {
            color: "rgba(180, 180, 180, 0.2)",
          },
        },
      ],
    };
    myChart.setOption(option);

    //建议加上以下这一行代码,不加的效果图如下(当浏览器窗口缩小的时候)。超过了div的界限(红色边框)
    window.addEventListener("resize", function () {
      myChart.resize();
    });
  },
  methods: {},
  watch: {},
  created() {},
};
</script>

<style scoped>
h2 {
  text-align: center;
  padding: 30px;
  font-size: 18px;
}
#chart_example {
  width: 50%;
  height: 500px;
  border: 1px solid red;
  margin: 0 auto;
}
</style>


 6万+
6万+

 被折叠的 条评论
为什么被折叠?
被折叠的 条评论
为什么被折叠?
 到【灌水乐园】发言


