


 博客围绕Matlab子图展开,提到Matlab会隐式调整子图间距及与整个figure的边距。但当需要根据需求设置合理间距和边距时,提出可使用一个函数来进行定制,避免在繁琐格式上花费时间。
使用subplot(row, col, i)创建的子图,matlab会隐式地调整它们的间距以及它们和整个figure的边距,以达到它所认为的美观或者合理的设置,然而如果我们想根据需求设置合理的间距以及边距,该怎么定制呢?
这里提供一个函数(是在没必要把时间花费在这种繁琐的格式上):
function ha = tight_subplot(Nh, Nw, gap, marg_h, marg_w)

% tight_subplot creates "subplot" axes with adjustable gaps and margins
%
% ha = tight_subplot(Nh, Nw, gap, marg_h, marg_w)
%
%   in:  Nh      number of axes in hight (vertical direction)
%        Nw      number of axes in width (horizontaldirection)
%        gap     gaps between the axes in normalized units (0...1)
%                   or [gap_h gap_w] for different gaps in height and width
%        marg_h  margins in height in normalized units (0...1)
%                   or [lower upper] for different lower and upper margins
%        marg_w  margins in width in normalized units (0...1)
%                   or [left right] for different left and right margins
%
%  out:  ha     array of handles of the axes objects
%                   starting from upper left corner, going row-wise as in
%                   going row-wise as in
%
%  Example: ha = tight_subplot(3,2,[.01 .03],[.1 .01],[.01 .01])
%           for ii = 1:6; axes(ha(ii)); plot(randn(10,ii)); end
%           set(ha(1:4),'XTickLabel',''); set(ha,'YTickLabel','')

% Pekka Kumpulainen 20.6.2010   @tut.fi
% Tampere University of Technology / Automation Science and Engineering


if nargin<3; gap = .02; end
if nargin<4 || isempty(marg_h); marg_h = .05; end
if nargin<5; marg_w = .05; end

if numel(gap)==1;
    gap = [gap gap];
end
if numel(marg_w)==1;
    marg_w = [marg_w marg_w];
end
if numel(marg_h)==1;
    marg_h = [marg_h marg_h];
end

axh = (1-sum(marg_h)-(Nh-1)*gap(1))/Nh;
axw = (1-sum(marg_w)-(Nw-1)*gap(2))/Nw;

py = 1-marg_h(2)-axh;

ha = zeros(Nh*Nw,1);
ii = 0;
for ih = 1:Nh
    px = marg_w(1);

    for ix = 1:Nw
        ii = ii+1;
        ha(ii) = axes('Units','normalized', ...
            'Position',[px py axw axh], ...
            'XTickLabel','', ...
            'YTickLabel','');
        px = px+axw+gap(2);
    end
    py = py-axh-gap(1);
end
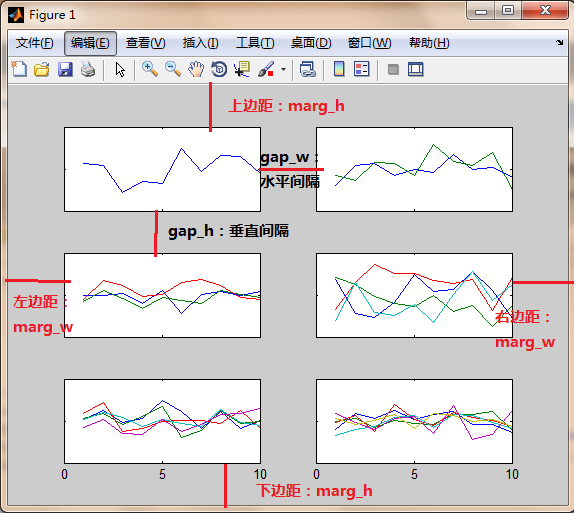
tight\_subplot(Nh, Nw, gap, marg\_h, marg_w)
我们先来介绍参数的含义:Nh, Nw用法同subplot(row, col)表示行数和列数,gap(如[0.01, 0.1])表示子图之间垂直方向和水平方向的间隔,marg_h表示的是全部子图到figure上下边界的距离,marg_w则表示的是全部子图到figure左右边界的距离。
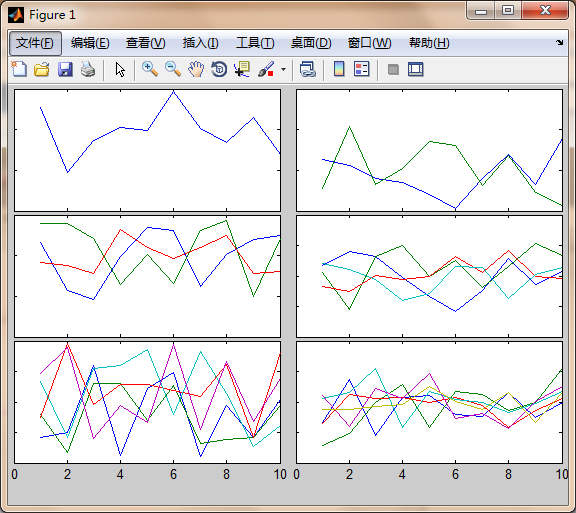
一个实例:
ha = tight_subplot(3,2,[.01 .03],[.1 .01],[.01 .01])
for ii = 1:6;
    axes(ha(ii));
    plot(randn(10,ii));
end
set(ha(1:4),'XTickLabel','');
set(ha,'YTickLabel','')


如果不是plot绘制的图像,而是imshow()显示的图像信息,使用也是如此,
创建全部子图的句柄,hs = tight_subplot(N, N)
用子图各自的句柄创建各自的坐标轴,axes(hs(i))
在每个坐标轴上显示图像信息,imshow()
N
hs = tight_subplot(N, N, [0.01, 0.01], [0.01, 0.01], [0.01, 0.01]);
for i = 1:N*N,
    axes(hs(i));
    imshow(...);
end


References
[1] <tight_subplot>
[2] Matlab中控制图像显示边界,subplot间距等
转载自:https://blog.youkuaiyun.com/lanchunhui/article/details/49820721


 7189
7189

 被折叠的 条评论
为什么被折叠?
被折叠的 条评论
为什么被折叠?
 到【灌水乐园】发言


