


 本文介绍了使用.NET3.0/WPF创建的图表控件,支持平移、缩放,具备将图表复制到剪贴板、粘贴到表格等功能。控件还允许用户在图表上添加多边形、线条,并提供了透明背景以适应各种背景需求。
Introduction
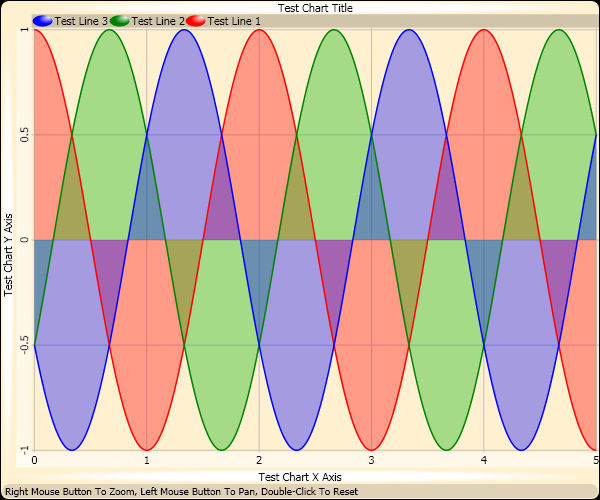
This article gives an overview of the code and algorithms I created while writing a chart control for .NET 3.0/WPF. My chart control is useful in that it includes Pan/Zoom, has a clipboard helper that copies the chart to the clipboard in a resolution that the user desires, adds data to the image in the clipboard so that the user can paste a bitmap image or paste tab separated chart line values into a spreadsheet. The cursor, when moved over the chart, shows the value of the nearest point, or the value at the centre of the cursor. Polygons and lines can be added by coordinate to the chart, and the chart has a transparent background allowing it to be overlaid over any pretty background required. To zoom into the chart, hold down the right mouse button and move the mouse up or to the right, then to pan around just drag the chart with the left mouse button.
While this chart control is quite basic right now, I intend to add other features as they are required such as databinding to static and dynamic data sources with dynamically giving the chart an animated appearance, pipe shaded bars for bar charts, and other fancy chart primitives. Updates to this control can be found at the Swordfish Charts project page on Sourceforge where I've released it under the BSD license.
原文链接:http://www.codeproject.com/Articles/17097/WPF-Chart-Control-With-Pan-Zoom-and-More


 1025
1025

 被折叠的 条评论
为什么被折叠?
被折叠的 条评论
为什么被折叠?
 到【灌水乐园】发言


