


 本文介绍了如何在Cesium中进行剖面海拔分析,通过点击测量山体部分的高度,并使用Echarts进行可视化展示。文章提供了从绘制点、线到计算距离和高度走势的代码示例,展示了完整的实现思路。
今天分享一篇关于cesium高阶功能剖面海拔分析的文章,希望能够为各位在生产中提供一定参考作用,在cesium的实际开发应用中我们会涉及到各种各样关于测量工具的需求,剖面海拔分析便是其中一种,通过点位选择出要测量的山体部分,分析其高度,并用echarts图可视化的表现出来,话不多说,直接上图:
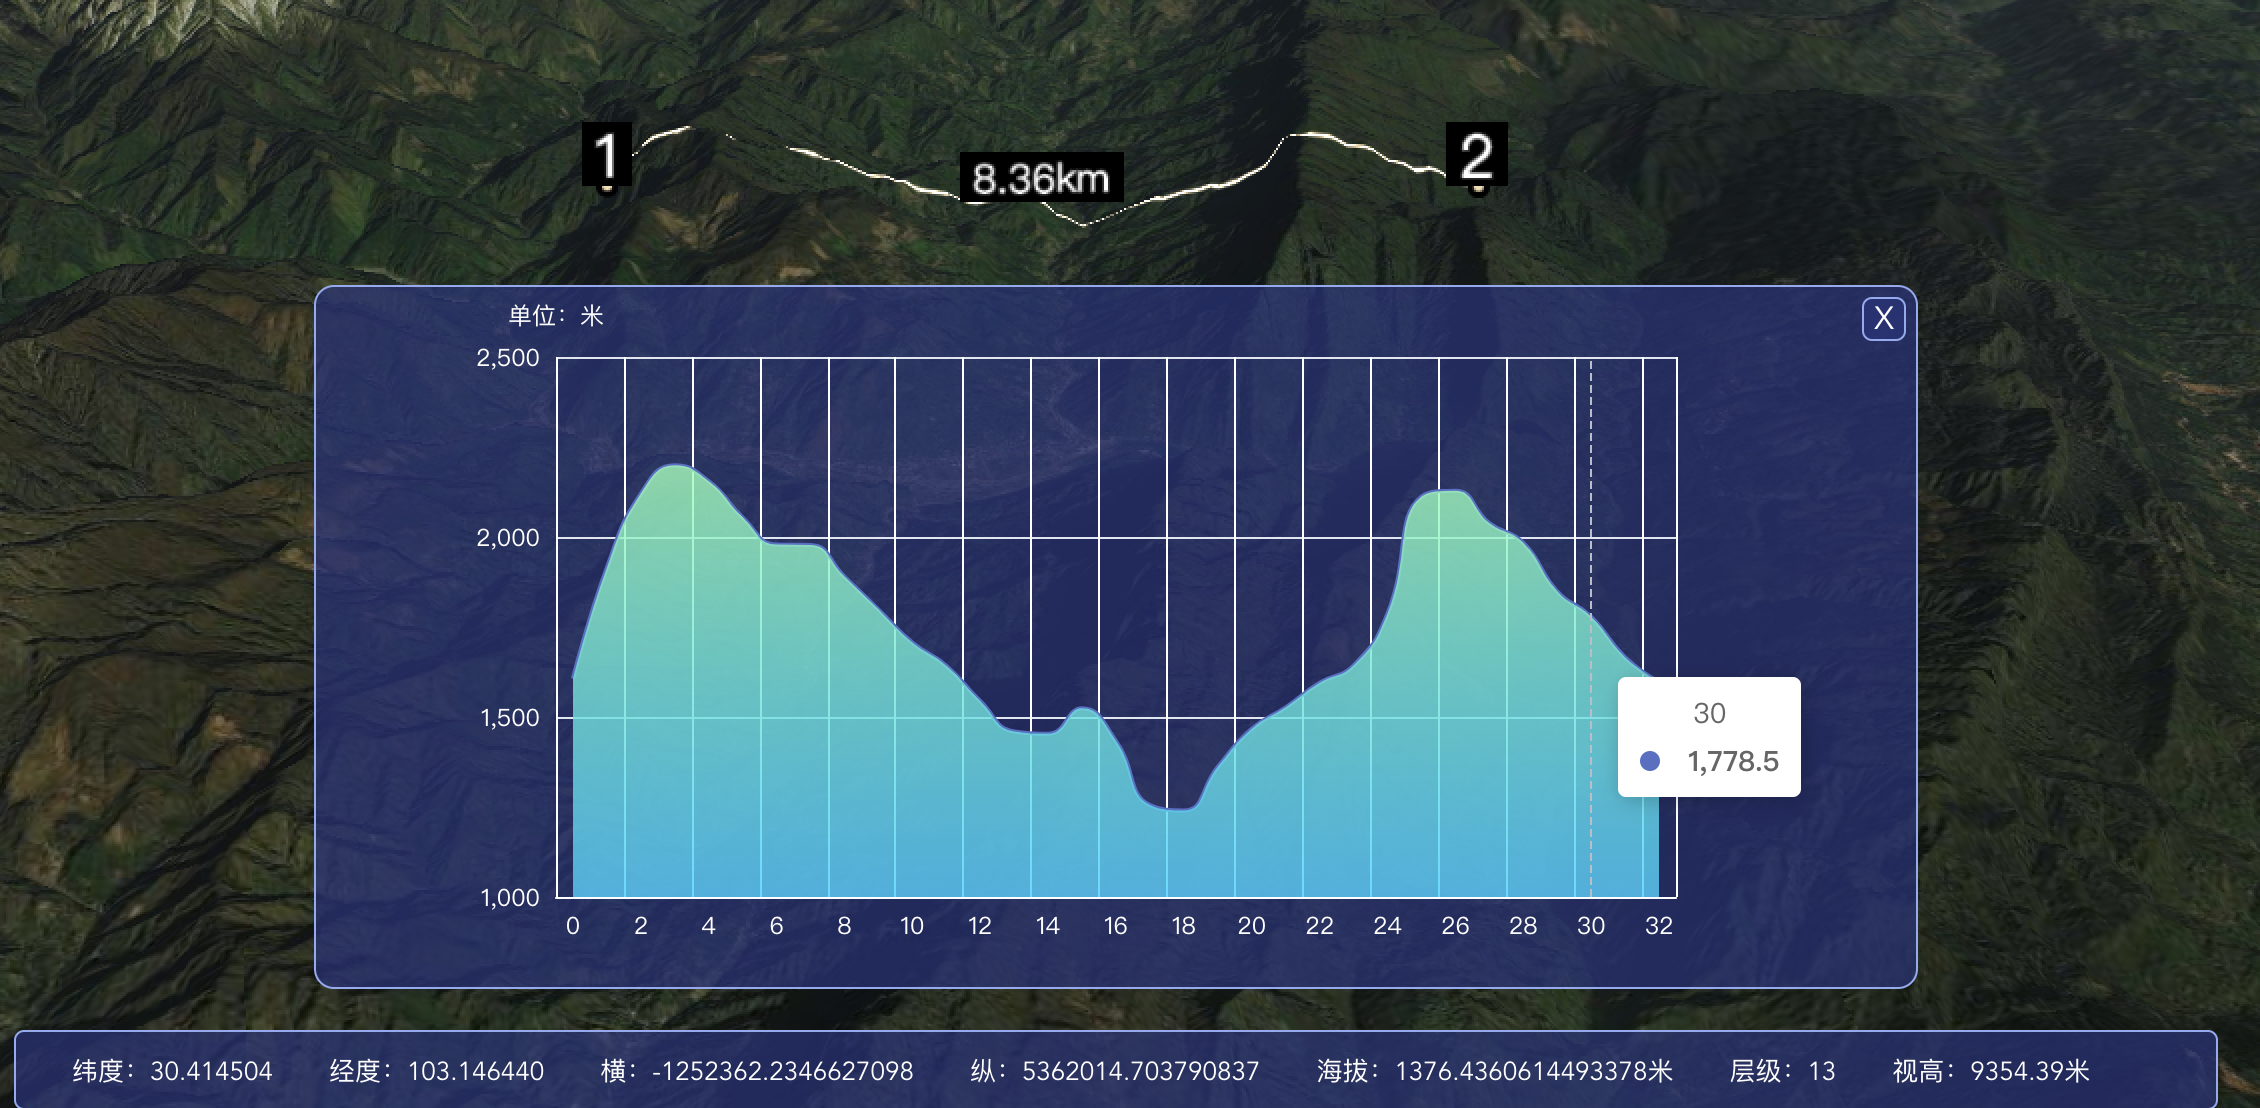
这是我们想要的效果,接下来就理一下思路:
1.我们需要一个方法可以通过点击,描绘出我们需要测量的山体部分
既然需要描绘,那就会涉及到entity的添加,直接上码:
//画点
        drawPoint(position) {
            let viewer = this.viewer
            // 本质上就是添加一个点的实体
            viewer.entities.add({
                name: '测量点',
                position: position,
                point: {
                    color: this.Cesium.Color.WHEAT,
                    pixelSize: 5,
                    outlineWidth: 3,
                    disableDepthTestDistance: Number.POSITIVE_INFINITY,
                    heightReference: this.Cesium.HeightReference.CLAMP_TO_GROUND // 规定贴地
                }
            })
        },
//画广告牌
        drawPointLabel(position, pointNum) {
            let viewer = this.viewer
            let Cesium = this.Cesium
            // 本质上就是添加一个点的实体
            return viewer.entities.add({
                name: '测量点',
                position: position,
                point: {
                    color: Cesium.Color.WHEAT,
                    pixelSize: 5,
                    outlineWidth: 3,
                    disableDepthTestDistance: Number.POSITIVE_INFINITY, //
                    heightReference: Cesium.HeightReference.CLAMP_TO_GROUND // 规定贴地
                },
                label: {
                    text: pointNum,
                    font: '30px sans-serif',
                    fillColor: Cesium.Color.WHITE,
                    outlineWidth: 2,
                    backgroundColor: Cesium.Color.BLACK,
                    showBackground: true,
                    style: Cesium.LabelStyle.FILL,
                    verticalOrigin: Cesium.VerticalOrigin.BOTTOM,
                    horizontalOrigin: Cesium.HorizontalOrigin.CENTER,
                    disableDepthTestDistance: Number.POSITIVE_INFINITY,
                    heightReference: Cesium.HeightReference.CLAMP_TO_GROUND
                }
            })
        },
//画线
        drawPolyline(positions) {
            let viewer = this.viewer
            if (positions.length < 1) return
            viewer.entities.add({
                name: '测量点',
                polyline: {
                    positions: positions,
                    width: 5.0,
                    material: new this.Cesium.PolylineGlowMaterialProperty({
                        // eslint-disable-next-line new-cap
                        color: this.Cesium.Color.WHEAT
                    }),
                    depthFailMaterial: new this.Cesium.PolylineGlowMaterialProperty({
                        // eslint-disable-next-line new-cap
                        color: this.Cesium.Color.WHEAT
                    }),
                    clampToGround: true
                }
            })
        }
有了测绘方法之后,我们就需要用这些方法,画出一条贴地直线,所有的方法操作,皆在以下代码中应用:
let Cesium = this.Cesium
let that = this
let viewer = this.viewer
let tempEntities = this.tempEntities
let floatingPoint = this.floatingPoint
let activeShape = this.activeShape
let position = []
let tempPoints = []
let activeShapePoints = []
// 开启深度检测
viewer.scene.globe.depthTestAgainstTerrain = true
// 创建场景的HTML canvas元素
let handler = new Cesium.ScreenSpaceEventHandler(viewer.scene.canvas)

// 取消鼠标双击事件
viewer.cesiumWidget.screenSpaceEventHandler.removeInputAction(Cesium.ScreenSpaceEventType.LEFT_CLICK)
viewer.cesiumWidget.screenSpaceEventHandler.removeInputAction(Cesium.ScreenSpaceEventType.LEFT_DOUBLE_CLICK)
// 监听鼠标移动
handler.setInputAction(function (movement) {
     if (Cesium.defined(floatingPoint)) {
          let newPosition = viewer.scene.pickPosition(movement.endPosition)
          if (Cesium.defined(newPosition)) {
             floatingPoint.position.setValue(newPosition)
             activeShapePoints.pop()
             activeShapePoints.push(newPosition)
                                }
                            }
}, Cesium.ScreenSpaceEventType.MOUSE_MOVE)
// 左键单击开始画线
handler.setInputAction((click) => {
    let earthPosition = viewer.scene.pickPosition(click.position)
    if (Cesium.defined(earthPosition)) {
       floatingPoint = that.drawPoint(earthPosition)
    }
// 获取位置信息
// 从相机位置创建一条射线,这条射线通过世界中movement.position像素所在的坐标,返回Cartesian3坐标
    let ray = viewer.camera.getPickRay(click.position)
// 找到射线与渲染的地球表面之间的交点。射线必须以世界坐标给出。返回Cartesian3坐标
    position = viewer.scene.globe.pick(ray, viewer.scene)
    tempPoints.push(position) // 记录点位
    that.pointNum += 1
    let tempLength = tempPoints.length // 记录点数
// 调用绘制点的接口
    let point = that.drawPointLabel(tempPoints[tempPoints.length - 1], JSON.stringify(that.pointNum))
     tempEntities.push(point)
// 存在超过一个点时
     if (tempLength > 1) {
                                // 绘制线
                                let pointLength = that.getLength(tempPoints[tempPoints.length - 2], tempPoints[tempPoints.length - 1])
                                let midPosition = that.getMidpoint(tempPoints[tempPoints.length - 2], tempPoints[tempPoints.length - 1])
                                let pointline = that.drawPolyline([tempPoints[tempPoints.length - 2], tempPoints[tempPoints.length - 1]])
                                let pointLabel = that.addLabel(midPosition, pointLength)
                                tempEntities.push(pointline) // 保存记录
                                tempEntities.push(pointLabel)
                                this.poumianArray1.push(tempPoints[tempPoints.length - 2])
                                this.poumianArray1.push(tempPoints[tempPoints.length - 1])
                                for (let i = 0; i < 5; i++) {
                                    this.profileloop()
                                }
                                // for (let i = 0; i < this.poumianArray1.length; i++) {
                                //     this.poumianArray1[i]
                                // }
                                let heightarr = []
                                let newHeightarr = []
                                // let startPoint = Cesium.Cartographic.fromCartesian(tempPoints[tempPoints.length - 2])
                                // let endPoint = Cesium.Cartographic.fromCartesian(tempPoints[tempPoints.length - 1])
                                // let geodesic = new Cesium.EllipsoidGeodesic()
                                // geodesic.setEndPoints(startPoint, endPoint)
                                // this.poumianArray1 = geodesic.interpolateUsingFraction(0.1)
                                // console.log(this.poumianArray1)
                                for (let i in this.poumianArray1) {
                                    let categary = Cesium.Cartographic.fromCartesian(this.poumianArray1[i]);
                                    let height = viewer.scene.globe.getHeight(categary)
                                    heightarr.push((height).toFixed(2))
                                }
                                this.profilechart(heightarr)
                                this.$refs.profileboxRef.style.display = 'block'
                                this.$refs.profileRef.style.color = '#ffffff'
                                activeShapePoints.pop()
                                viewer.entities.remove(activeShapePoints)
                                viewer.entities.remove(floatingPoint)
                                tempPoints = [] // 清空点位记录
                                handler.destroy()
                                handler = null
                                floatingPoint = undefined
                                activeShape = undefined
                                activeShapePoints = []
                                this.jieliuFlag = true
                                this.pointNum = 0
                                this.poumianArray1 = []
                            }
                        }, Cesium.ScreenSpaceEventType.LEFT_CLICK)
2.我们需要计算出两点之间的距离
我们在描绘的过程中通过该方法计算出两点之间的距离
 /* 空间两点表面距离计算函数 */
        getLength(start, end) {
            // 将起点与终点位置信息从笛卡尔坐标形式转换为Cartographic形式
            let startCartographic = this.Cesium.Cartographic.fromCartesian(start)
            let endCartographic = this.Cesium.Cartographic.fromCartesian(end)
            // 初始化测地线
            let geodesic = new this.Cesium.EllipsoidGeodesic()
            // 设置测地线起点和终点,EllipsoidGeodesic中setEndPoints常与surfaceDistance搭配使用
            geodesic.setEndPoints(startCartographic, endCartographic)
            // 获取起点和终点之间的表面距离,单位为km,规定四舍五入保留两位小数
            // surfaceDistance返回number 单位为m,带小数
            // console.log((geodesic.surfaceDistance / 1000).toFixed(2))
            return (geodesic.surfaceDistance / 1000).toFixed(2)
        },
3.我们需要把山体的高度走势用echarts图描绘出来
既然要描绘出山体高度的走势,那么我们就需要获得起始点位之间n个点位的高度集合,我们利用一个求始末两点之间中点的函数,求得两点之间中点的坐标,再把始末点位与中点加入到新的数组中,再两两求中点,反复迭代,可以求出两点间的n个点位集合,该过程在贴地直线描绘中进行,参考第一点中画贴地直线的代码:
 /* 空间两点计算贴地中点函数 */
        getMidpoint(start, end) {
            let Cesium = this.Cesium
            let startPoint = Cesium.Cartographic.fromCartesian(start)
            let endPoint = Cesium.Cartographic.fromCartesian(end)
            let geodesic = new Cesium.EllipsoidGeodesic()
            geodesic.setEndPoints(startPoint, endPoint)
            let geoPoint = geodesic.interpolateUsingFraction(0.5)
            // console.log(Cesium.Ellipsoid.WGS84.cartographicToCartesian(geoPoint))
            return Cesium.Ellipsoid.WGS84.cartographicToCartesian(geoPoint)
        }
最后,我们把求到的点集通过遍历求出高度集,传给echarts用图表的形式描绘出来:
for (let i in this.poumianArray1) {
     let categary = Cesium.Cartographic.fromCartesian(this.poumianArray1[i]);
     let height = viewer.scene.globe.getHeight(categary)
      heightarr.push((height).toFixed(2))
}
echarts函数:
//剖面分析的表格加载
        profilechart(heightarr) {
            let myEchart = this.$echarts.init(document.getElementById("profile"))
            let option = {
                xAxis: {
                    type: 'category',
                    axisLine: {
                        show: true,
                        lineStyle: {
                            color: "#fff",
                            width: 1,
                            type: "solid"
                        }
                    },
                    axisTick: {
                        show: false
                    },
                    splitLine: {
                        show: true,
                        lineStyle: {
                            color: "#fff",
                            width: 1,
                            type: "solid"
                        }
                    },
                    axisLabel: {//y轴文字的配置
                        textStyle: {
                            color: "#fff",
                            margin: 15
                        },
                    }
                },
                yAxis: {
                    minInterval: 500,
                    scale: true,
                    type: 'value',
                    splitLine: {
                        show: true
                    },
                    name: "单位:米",//y轴上方的单位
                    nameTextStyle: {//y轴上方单位的颜色
                        color: '#fff'
                    },
                    axisLabel: {//y轴文字的配置
                        textStyle: {
                            color: "#fff",
                            margin: 15
                        },
                    }
                },
                tooltip: {
                    trigger: 'axis',
                    axisPointer: {
                        type: 'line'
                    },
                },
                series: [
                    {
                        data: heightarr,
                        type: 'line',
                        symbol: 'none',
                        smooth: true,
                        areaStyle: {
                            opacity: 0.8,
                            color: new this.$echarts.graphic.LinearGradient(0, 0, 0, 1, [
                                {
                                    offset: 0,
                                    color: 'rgb(128, 255, 165)'
                                },
                                {
                                    offset: 1,
                                    color: 'rgb(1, 191, 236)'
                                }
                            ])
                        }
                    }
                ]
            }
            myEchart.setOption(option)
        }
以上就是我在cesium中剖面海拔的整体思路以及部分参考代码,希望能够给各位伙伴提供一些帮助,码字不易,期待点赞收藏!!!T-T💕


 1085
1085

 被折叠的 条评论
为什么被折叠?
被折叠的 条评论
为什么被折叠?
 到【灌水乐园】发言


