


Introduction
Problem Background
Significance of the Study
Honeybees are important pollinators, The Food and Agriculture Organization of the United Nations "It plays an important role in maintaining the health of human beings and the earth, protecting biodiversity and promoting food security and nutrition. However, in recent years, the Colony Collapse Disorder incident has occurred frequently, and the cause of the incident has not yet been determined, leading to a sharp decline in bee population in the affected areas, aggravating the increasingly serious pollination crisis in recent years, and causing a heavy blow to the local bee industry and agriculture. Therefore, the relevant research on CCD is very important necessary.
Question raising
It is known that the decrease of bee population can be attributed to such factors as viruses, pesticides, predators, habitat destruction and environmental conditions, as well as the activity level of typical bees given by the topic:
1.Honeybees can travel up to 20 km, but typically stay within 6 km of their hive.
2.A typical honeybee hive contains between 20,000 and 80,000 honeybees.
3.A single honeybee can visit approximately 2,000 flowers or more in a single day.
4.Because of the high workload during summertime, most honeybees work themselves to death, resulting in a shorter lifespan.
5.During autumn and wintertime, honeybees may live a bit longer (four to six months).
6.A honeybee’s level of activity, pollen consumption, and protein abundance impacts its lifespan.
Now it is necessary to study the number of bees in a period of time and the pollination of bees in a certain range.
Restatement of the Problem
Considering the background information and restricted conditions identified in the problem statement, we need to solve the following problems:
Problem 1
Build a mathematical model to study the changes in the number of bees in a period of time.
Problem 2
Further analyze the model obtained from the first question, and determine the key factors affecting the model for sensitivity analysis, study the impact of different factors on the size of bee colony, and determine the factors that have the greatest impact on the size of bee colony.
Problem 3
Based on the activity level of typical bees given in the question, study how many hives are needed to support bee pollination on a land where crops that benefit from pollination are grown.
Our Work
Assumptions and Justifications
Suppose a year is regarded as 360 days, with 90 days each quarter in spring, summer, autumn and winter.
Different climates in different regions are different. Here we make a typical deduction based on the typical bees studied, and divide the annual research according to different seasons, making the results more scientific and more reference value.
Assume that the impact of intraspecific competition is not considered for the typical bees studied in this paper.
According to the research data, it is easy to know that intraspecific competition has a very small impact on bees living in clusters, so we exclude this part of the impact for the sake of simplifying the model.
It is assumed that the known virus transmission affecting the colony genome is the culprit of CCD frequency.
At present, there is no final conclusion on the research of CCD. In order to conduct relevant research on CCD phenomenon, we choose to assume that viruses have been demonstrated as the main culprit of CCD in later research according to the known literature. We assume that viruses have a probability of causing population collapse by affecting population genetic diversity and other reasons, and put its impact in our research to make relevant reference for subsequent research, There will be a more detailed introduction in relevant parts of the article.
It is assumed that the normal living worker bees are all individuals with the same volume and mass and have the same activity level in the same environmental conditions.
This means that the working time and efficiency of honey collection are constant in the same season and environmental conditions, regardless of the differences of each normal living worker bee.
In the study of hive planning, it is assumed that there are 50000 worker bees in each hive.
According to the given conditions, each typical hive contains 20000 to 80000 bees. Considering the actual situation and for the simplification of question 3, we assume that each hive contains 50000 bees.
Suppose the 81000 square meters of land is circular.
Notations
The key mathematical notations used in this paper are listed in Table 1.
Symbol Description
1 N_0 The initial number of bee population
2 N_i (t) the number of bees at different ages on day t
3 N(t) the number of bees changing with time
4 γ the natural growth rate of bees
5 α the natural birth rate of bees
6 β the natural mortality rate of bees
7 r the inherent growth rate of bees
8 K the environmental capacity
9 λ_i the proportion of age groups of bees at different ages
10 L the Leslie matrix
11 σ the net migration number of bees
12 ∅ the number of viable fertilized eggs of bees
13 ρ the survival rate of fertilized eggs of bees
14 k Proportion of female fertile bees on day t
15 σ(t) and net migration bees on day t
Establishment and solution of model
Analysis and Solution of Question 1
(1) A large number of adult bees in the hive are lost, but there are no corpses near the hive;(2) Availability of queen and hooded cubs;(3) The abandoned food supply will not be taken away by foraging species for a long time. In addition, it is sometimes claimed that (4) during the population collapse, the number of Varroa mites and Nosema populations did not reach the known level that led to the decline of typical populations (van Engelsdorp et al, 2009). In addition, the remaining bees are reluctant to use the food provided by beekeepers (Ellis et al., 2010). [1]
The evolution model of honeybee population
In the case of ignoring the external environment and intraspecific competition, we first establish a basic and simple Malthus model.
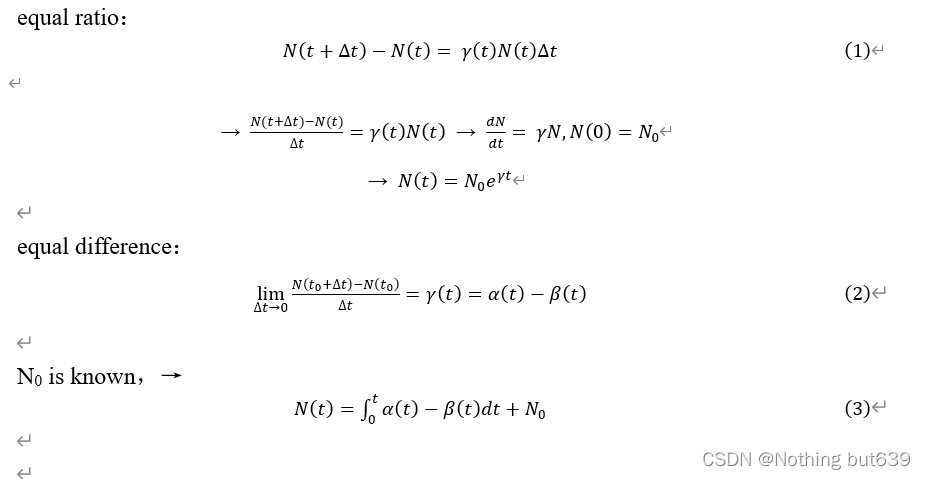
Model improvement
Study on Bee Colony Lifetime Based on Season and Other Environmental Factors
Research on environmental containment of swarming based on R-M model
Study on CCD problem based on typical viral impacts
Study on colony migration based on Leslie model
Expected curve of colony number change
We picked up a hive that had 50,000 bees when it was initially stable. And every two months as a point in time.
After programmatic analysis, we got the following results:
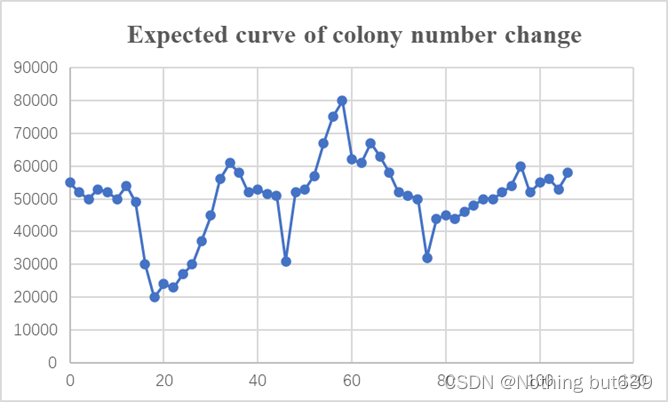
From the fitted results, three bee swarms crashed in more than a hundred months, that is, three CCD occurred.
References
[1]Atanasov, Atanas Zdravkov;Georgiev, Slavi G.;Vulkov, Lubin G..Reconstruction analysis of honeybee colony collapse disorder modeling[J].Optimization and Engineering,2021.
[2]Congrui_H. 蜜蜂数量减少的若干研究(数学建模)[EB/OL].(2022-12-09)[2022-12-15].https://blog.youkuaiyun.com/weixin_67797607/article/details/128244403.
[3]Andrzejak, R.G.;Ruzzene, G.;Malvestio, I..Generalized synchronization between chimera states[J].Chaos: An Interdisciplinary Journal of Nonlinear Science,2017,Vol.27(5): 053114.
[4]刘珊.中蜂囊状幼虫病病毒(CSBV)与转地饲养方式对蜜蜂健康的影响[D].中国农业科学院,2017.
[5]Šverko, Zoran;Vrankić, Miroslav;Vlahinić, Saša;Rogelj, Peter.Complex Pearson Correlation Coefficient for EEG Connectivity Analysis.[J].Sensors,2022,Vol.22(4): 1477.


 被折叠的 条评论
为什么被折叠?
被折叠的 条评论
为什么被折叠?
 到【灌水乐园】发言


