


 本文介绍了使用Python的matplotlib库进行绘图的基本操作,包括创建新窗口、绘制线性和散点图,以及保存图片。通过实例演示了如何使用`plt.figure()`、`plt.plot()`、`fig.savefig()`等函数,以及如何设置图形样式和标签。
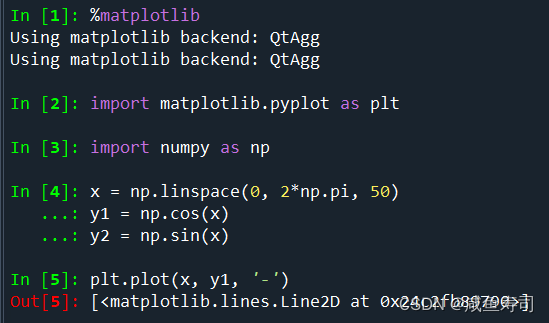
魔法绘图
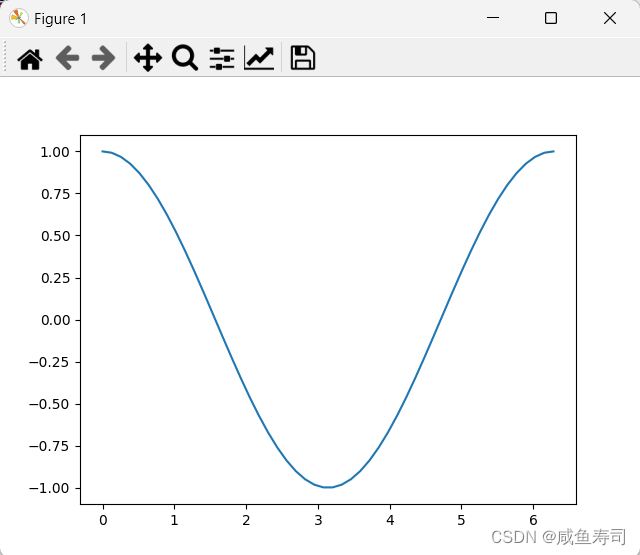
通过%matplotlib打开一个新的figure窗口,此后Ipython中关于plot的指令会在这个figure上逐步更新

绘图与保存
- plt.figure():创建新的画布
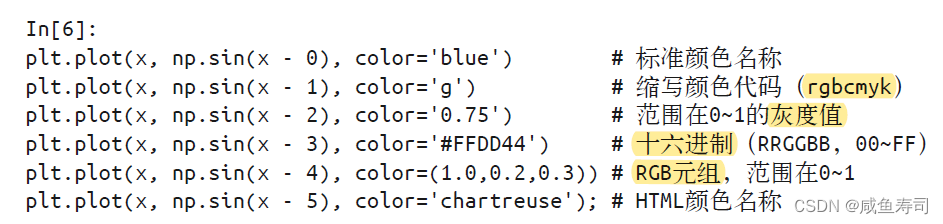
- plt.plot(x, y, '--'):绘图,第一个参数为横坐标,第二个参数为纵坐标,第三个参数为线条风格
- fig.savefig():保存图片到地址
import matplotlib as mpl
import matplotlib.pyplot as plt
import numpy as np
import seaborn
from PIL import Image
seaborn.set()
x = np.linspace(0, 2*np.pi, 50)
y1 = np.cos(x)
y2 = np.sin(x)
fig = plt.figure()
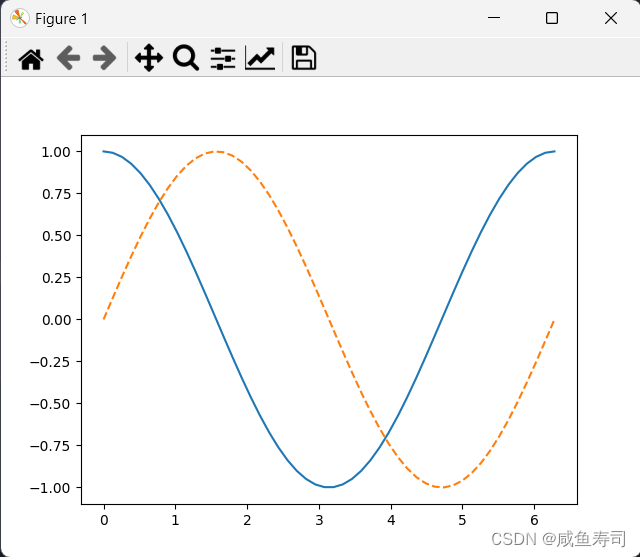
plt.plot(x, y1, '-')
plt.plot(x, y2, '--')
plt.show()
fig.savefig("三角函数.png")
img = Image.open("三角函数.png")
img.show()简易线形图
import numpy as np
import matplotlib.pyplot as plt
x = np.linspace(-2*np.pi, 2*np.pi, 1000)
fig = plt.figure()
plt.plot(x , x-2, "-c", label="x-2")
plt.plot(x , x-1, "--m", label="x-1")
plt.plot(x , x, "-.y", label="x")
plt.plot(x , x+1, ":k", label="x+1")
# plt.xlim(-7, 7)
# plt.ylim(-2, 2)
plt.axis([-7, 7, -2, 2])
# plt.axis('equal')
plt.xlabel("x")
plt.ylabel('y')
plt.title("Line")
plt.legend()
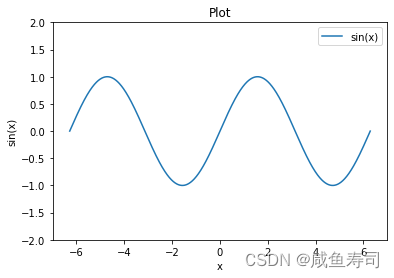
fig1 = plt.figure()
ax1 = plt.axes()
ax1.plot(x, np.sin(x), label="sin(x)")
ax1.set(xlim=(-7, 7), ylim=(-2, 2), xlabel="x", ylabel="sin(x)", title="Plot")
ax1.legend() 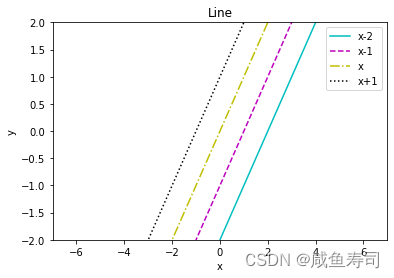
简易散点图
plt.plot()
import numpy as np
import matplotlib.pyplot as plt
rng = np.random.RandomState(114514)
for marker in ['o', '.', ',', 'x', '+', 'v', '^', '<', '>', 's', 'd']:
    # 必须指定maker以表示点而非线
    plt.plot(rng.rand(5), rng.rand(5), marker,
    label="marker='{0}'".format(marker))
    # numpoint为图例数量
    plt.legend(numpoints=1)
    plt.xlim(0, 1.8);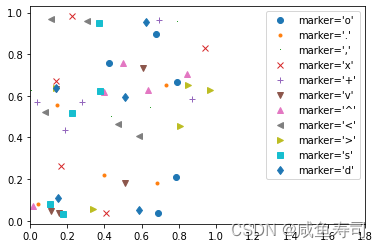
import numpy as np
import matplotlib.pyplot as plt
x = np.linspace(-2*np.pi, 2*np.pi, 20)
y = np.cos(x)
plt.plot(x, y, '-p', color='gray',
        markersize=15, linewidth=4,
        markerfacecolor='white',
        markeredgecolor='gray',
        markeredgewidth=2)
plt.ylim(-1.2, 1.2);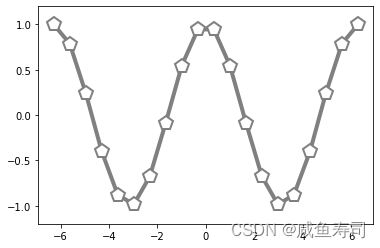
plt.scatter
from sklearn.datasets import load_iris
import matplotlib.pyplot as plt
iris = load_iris()
features = iris.data.T
plt.scatter(features[0], features[1], alpha=0.2,
            s=100*features[3], c=iris.target, cmap='viridis')
plt.xlabel(iris.feature_names[0])
plt.ylabel(iris.feature_names[1]);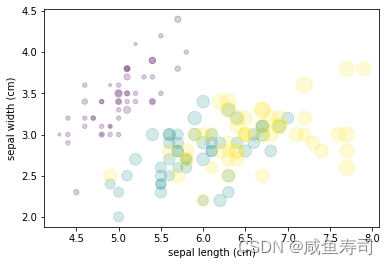


 975
975

 被折叠的 条评论
为什么被折叠?
被折叠的 条评论
为什么被折叠?
 到【灌水乐园】发言


