


前言
MATLAB曲线拟合的方法有许多种,大致分为两种,一种是自己编写代码调用函数的形式,另一种是用MATLAB已有的cftool拟合工具箱。按照上述的方法能解决大多数的问题,但是在一些特定情况下,需要自己定义的一些函数形式进行曲线拟合,这时候需要用到fittype函数来进行拟合。
一、fittype函数
自定义曲线和曲面拟合的拟合类型
二、使用方法
1.语法描述
1、aFittype = fittype(libraryModelName)
//creates the fittype object aFittype for the model specified by libraryModelName

2、aFittype = fittype(expression)
//creates a fit type for the model specified by the MATLAB® expression.
3、aFittype = fittype(expression,Name,Value)
//constructs the fit type with additional options specified by one or more Name,Value pair //arguments.

4、aFittype = fittype(linearModelTerms)
//creates a fit type for a custom linear model with terms specified by the expressions in //linearModelTerms.
5、aFittype = fittype(linearModelTerms,Name,Value)
//constructs the fit type with additional options specified by one or more Name,Value pair //arguments.

6、aFittype = fittype(anonymousFunction)
//creates a fit type for the model specified by anonymousFunction.
7、aFittype = fittype(anonymousFunction,Name,Value)
//constructs the fit type with additional options specified by one or more Name,Value pair //arguments.
2.官方实例
1、f = fittype('poly3')
   //运行结果
     f =
     Linear model Poly3:
     f(p1,p2,p3,p4,x) = p1*x^3 + p2*x^2 + p3*x + p4

2、f = fittype('rat33')
   //运行结果
     f =
     General model Rat33:
     f(p1,p2,p3,p4,q1,q2,q3,x) = (p1*x^3 + p2*x^2 + p3*x + p4) /
               (x^3 + q1*x^2 + q2*x + q3)

3、g = fittype('a*u+b*exp(n*u)',...
            'problem','n',...
            'independent','u')
   //运行结果
     g =
     General model:
     g(a,b,n,u) = a*u+b*exp(n*u)

4、g = fittype('a*time^2+b*time+c','independent','time','dependent','height')
   //运行结果
     g =
     General model:
     g(a,b,c,time) = a*time^2+b*time+c

5、x = linspace(1,100);
   y = 5 + 7*log(x);
   myfittype = fittype('a + b*log(x)',...
                       'dependent',{'y'},'independent',{'x'},...
                       'coefficients',{'a','b'})

   //运行结果
     myfittype =
     General model:
     myfittype(a,b,x) = a + b*log(x)
3.个人实例
实现功能为:调取excel表格中某些范围里的数据,将其中一些作为自变量输入,另一些作为因变量输入,编写自己的函数模型,之后定义横纵坐标范围,拟合曲线图并给出拟合参数值。
close all;
clc;
clear;
syms m1 m2 t n p;
m1='B1:F1';
m2='B1:F1';
x = xlsread('C:\packpage installation\MATLAB2016a\User_Yu\data20220611.xlsx',1,m1);
y = xlsread('C:\packpage installation\MATLAB2016a\User_Yu\data20220611.xlsx',1,m2);
plot(x',y','r*');
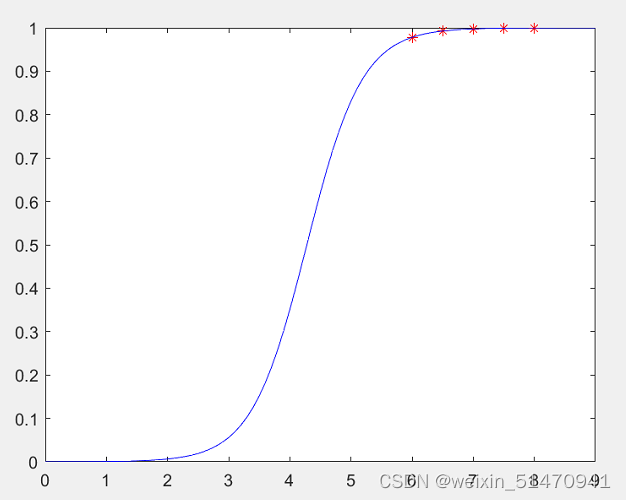
myfittype=fittype('1./(1+10.^(n.*(p-x)))','independent','x','dependent','y');
myfit = fit(x',y',myfittype,'StartPoint',[0.3 5]);
xi=0.4:0.5:9;
yi=myfit(xi);
plot(x',y','r*',xi,yi,'b-');结果为:
输出的位置参数值为:
>> myfit

myfit =

     General model:
     myfit(x) = 1./(1+10.^(n.*(p-x)))
     Coefficients (with 95% confidence bounds):
       n =      0.8775  (-0.1604, 1.915)
       p =       5.346  (4.365, 6.327)
曲线拟合成功


 8830
8830

 被折叠的 条评论
为什么被折叠?
被折叠的 条评论
为什么被折叠?
 到【灌水乐园】发言


