


1.导入pandas,定义DataFrame
import pandas as pd
example = pd.DataFrame({'Month': ["January", "January", "January", "January",
                                  "February", "February", "February", "February",
                                  "March", "March", "March", "March"],
                   'Category': ["Transportation", "Grocery", "Household", "Entertainment",
                                "Transportation", "Grocery", "Household", "Entertainment",
                                "Transportation", "Grocery", "Household", "Entertainment"],
                   'Amount': [74., 235., 175., 100., 115., 240., 225., 125., 90., 260., 200., 120.]})
example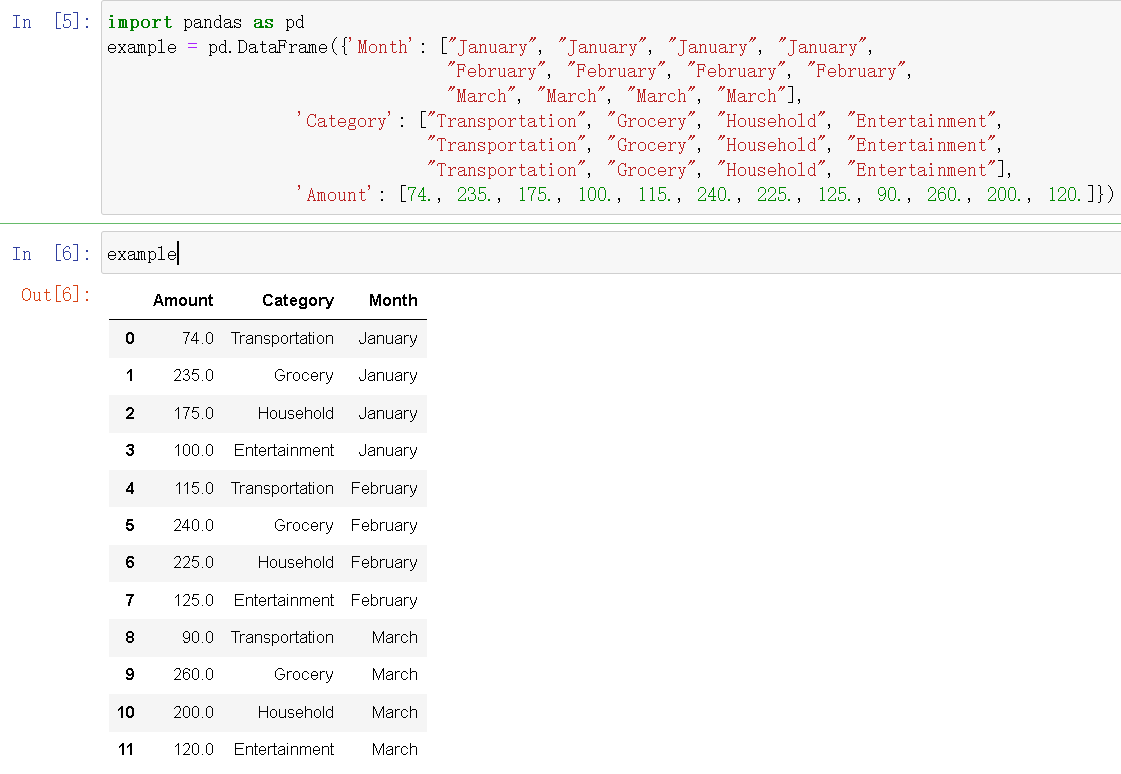
2.使用pivot进行数据统计
example_pivot = example.pivot(index = 'Category',columns= 'Month',values = 'Amount')
example_pivot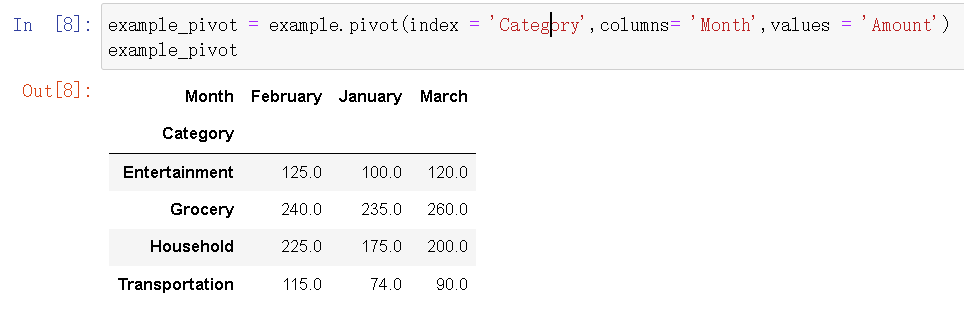
example_pivot.sum(axis = 1)
example_pivot.sum(axis = 0)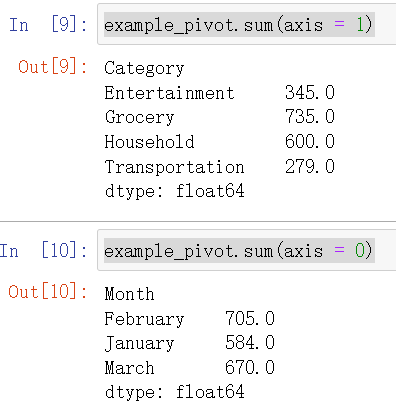
3.读取csv
df = pd.read_csv('./data/titanic.csv')
df.head()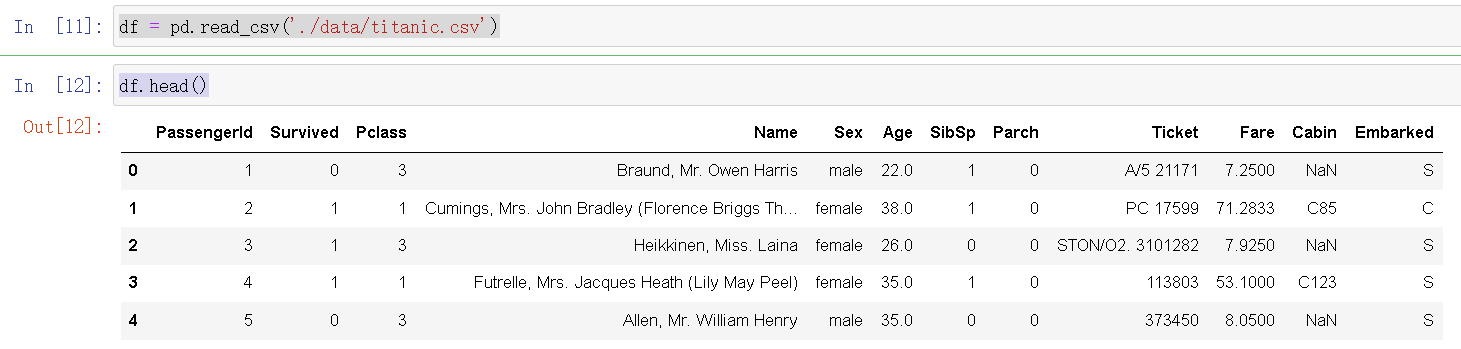
4.指定特征值类型(行表头、列表头、特征数据)绘制图表,图表中的数据默认为平均值
df.pivot_table(index = 'Sex',columns='Pclass',values='Fare')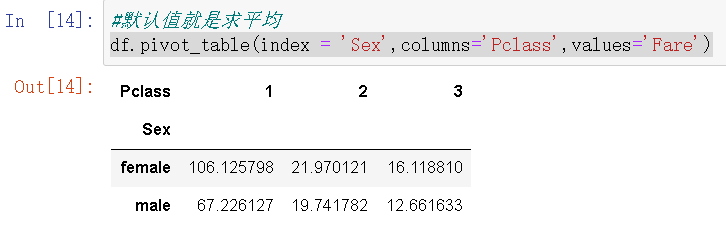
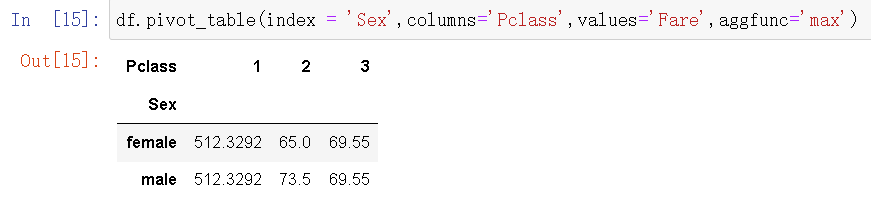
5.求最大值
6.统计数量
df.pivot_table(index = 'Sex',columns='Pclass',values='Fare',aggfunc='count')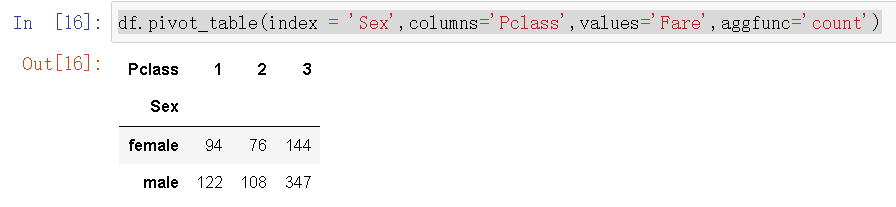
pd.crosstab(index = df['Sex'],columns = df['Pclass'])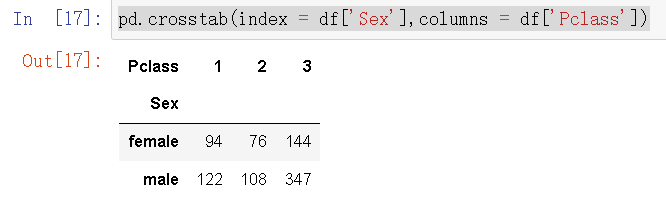
7.求平均值
df.pivot_table(index = 'Pclass',columns='Sex',values='Survived',aggfunc='mean')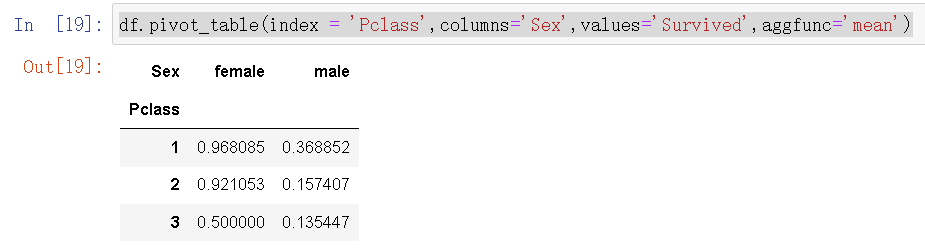
df['Underaged'] = df['Age'] <= 18
df.pivot_table(index = 'Underaged',columns='Sex',values='Survived',aggfunc='mean')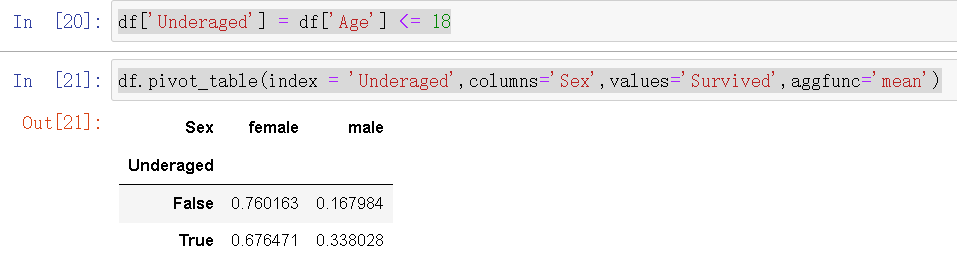


 5518
5518

 被折叠的 条评论
为什么被折叠?
被折叠的 条评论
为什么被折叠?
 到【灌水乐园】发言


