const chartRef = ref<HTMLDivElement | null>(null);
const { setOptions: setOptions } = useECharts(chartRef as Ref<HTMLDivElement>);
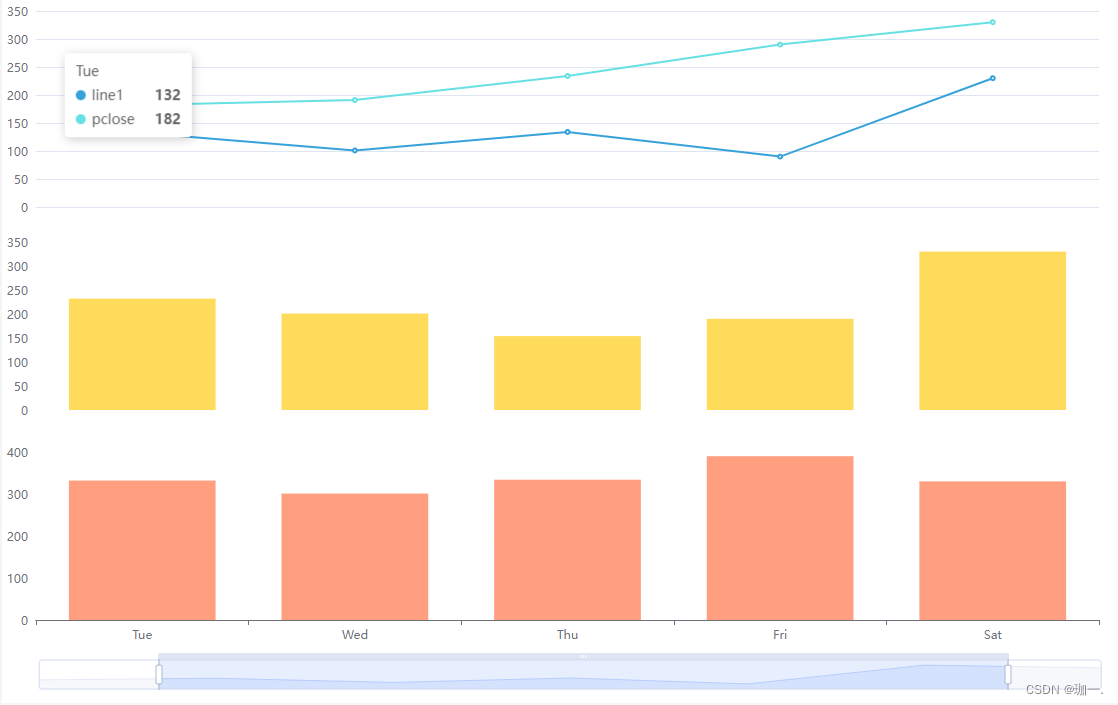
setOptions({
tooltip: {
trigger: 'axis',
confine: true, // 将tooltip控制在盒子内
backgroundColor: 'rgba(0, 0, 0, 0.5)', // 红色背景,70% 透明度
borderColor: '#000', // 边框颜色
borderWidth: 0, // 边框宽度
textStyle: {
color: '#fff', // 文本颜色
},
formatter: function (params) {
let result = '时间:' + date.value + ' ' + params[0].axisValue + '<br/><br/>';
params.forEach(function (item) {
if (item.seriesName) {
result += item.marker + item.seriesName + ':' + item.value + '<br/>';
}
});
return result;
},
},
grid: [
{
left: '5%',
right: '3%',
bottom: '0%',
top: '2%',
height: '23%',
containLabel: false,
},
{
left: '5%',
right: '3%',
bottom: '0%',
top: '33%',
height: '20%',
containLabel: false,
},
{
left: '5%',
right: '3%',
bottom: '3%',
height: '26%',
top: '62%',
containLabel: false,
},
],
xAxis: [
{
type: 'category',
gridIndex: 0, // 设置 y 轴所在的图表网格
data: ['Mon', 'Tue', 'Wed', 'Thu', 'Fri', 'Sat', 'Sun'],
show: false,
},
{
type: 'category',
gridIndex: 1, // 设置 y 轴所在的图表网格
data: ['Mon', 'Tue', 'Wed', 'Thu', 'Fri', 'Sat', 'Sun'],
show: false,
},
{
type: 'category',
gridIndex: 2, // 设置 y 轴所在的图表网格
data: ['Mon', 'Tue', 'Wed', 'Thu', 'Fri', 'Sat', 'Sun'],
},
],
yAxis: [
{
type: 'value',
position: 'left', // 设置 y 轴的位置
gridIndex: 0, // 设置 y 轴所在的图表网格
},
{
type: 'value',
position: 'left', // 设置 y 轴的位置
gridIndex: 1, // 设置 y 轴所在的图表网格
splitLine: { show: false }, // 不显示分割线
},
{
type: 'value',
position: 'left', // 设置 y 轴的位置
gridIndex: 2, // 设置 y 轴所在的图表网格
splitLine: { show: false }, // 不显示分割线
},
],
series: [
{
name: 'line1',
type: 'line',
xAxisIndex: 0,
yAxisIndex: 0,
data: [],
itemStyle: {
normal: {
color: '#FF9080', // 圆圈颜色
lineStyle: {
color: '#FF9080',
},
},
},
},
{
name: 'pclose',
type: 'line',
xAxisIndex: 0,
yAxisIndex: 0,
data: [],
itemStyle: {
normal: {
color: '#FCE630', // 圆圈颜色
lineStyle: {
color: '#FCE630',
},
},
},
},
{
name: 'bav2sub',
type: 'bar',
xAxisIndex: 1,
yAxisIndex: 1,
data: [150, 232, 201, 154, 190, 330, 410],
itemStyle: {
color: '#00CC33',
},
},
{
name: 'askv1',
type: 'bar',
xAxisIndex: 2,
yAxisIndex: 2,
data: [320, 332, 301, 334, 390, 330, 320],
itemStyle: {
color: '#FF9080',
},
},
],
dataZoom: [
{
show: true,
realtime: true,
start: 30,
end: 70,
xAxisIndex: [0, 1, 2],
},
{
type: 'inside',
realtime: true,
start: 30,
end: 70,
xAxisIndex: [0, 1, 2],
},
],
});


 1300
1300

 被折叠的 条评论
为什么被折叠?
被折叠的 条评论
为什么被折叠?
 到【灌水乐园】发言


