


 这篇博客详细介绍了如何使用Echarts在Vue.js环境中创建动态的折线柱状图,包括实现渐变色的marker效果,控制可视区域内展示的数据点个数,以及动态设置柱状图的圆角等高级特性。内容涉及到的数据格式为xData: ['2021Q1', '2021Q2', ...]和datas的相关配置。"
110701319,9620680,PAT甲级考试2020.12.5总结:边界bug与DFS挑战,"['算法', 'Java', '数据结构', 'DFS', '编程竞赛']
这篇博客详细介绍了如何使用Echarts在Vue.js环境中创建动态的折线柱状图,包括实现渐变色的marker效果,控制可视区域内展示的数据点个数,以及动态设置柱状图的圆角等高级特性。内容涉及到的数据格式为xData: ['2021Q1', '2021Q2', ...]和datas的相关配置。"
110701319,9620680,PAT甲级考试2020.12.5总结:边界bug与DFS挑战,"['算法', 'Java', '数据结构', 'DFS', '编程竞赛']

.vue
 import multiBarLineChart from '@/utils/echarts.js'

 drawChart (xData, datas) {


   this.myEchart = echarts.init(this.$refs.myChart)
   const countLimit = 8 // 可视范围展示个数
   this.myEchart.clear()
   this.myEchart.setOption(multiBarLineChart(xData, datas, countLimit))
   window.onresize = _.debounce(this.myEchart.resize, 500)
 }
echarts.js
xData的数据格式为[‘2021Q1’,‘2021Q2’,…]
datas的数据格式如下图
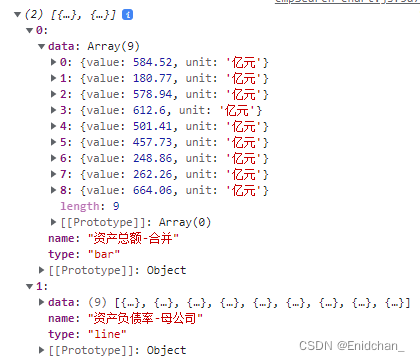
import * as echarts from 'echarts'

const axisLineTxTColor = '#666' // 轴和文字颜色
const splitLineColor = '#d9d9d9' // 分割线颜色
const gradientList = [ // 渐变色字典(最多是4个)
  {

    light: '#a4cbfd', dark: '#5c97ca' },
  {

    light: '#b4ecd0', dark: '#73deb3' },
  {

    light: '#ffe3a4', dark: '#fac858' },
  {

    light: '#ffa1a1', dark: '#ee6666' }
]

/** 动态柱状折线图
 * @xData 横坐标数据 ['','',...]
 * @datas 传过来的原始数据(用于处理legend,yAxis,series等)
 * @showCount 可视区域内展示的个数,超过则滑动(默认8)
 */
const multiBarLineChart = (xData, datas, showCount = 8) => {


  const obj = handleDatas(datas) // 处理数据获取legend等信息
  const {

    legend, yAxis, series } = obj

  // 赋值option
  const option = {


    title: {


      text: xData.length > showCount ? '(滑动查看更多)' : '',
      left: 48,
      textStyle: {


        fontSize: '12',
        color: '#999',
        fontWeight: 500
      }
    }
最低0.47元/天 解锁文章


 1079
1079

 被折叠的 条评论
为什么被折叠?
被折叠的 条评论
为什么被折叠?
 到【灌水乐园】发言


