


 本文详细介绍了JMeter中聚合报告的使用方法与各项指标含义,包括请求的平均响应时间、百分位数、吞吐量等关键性能指标,帮助读者深入理解性能测试结果。
1.Jmeter聚合报告介绍:
Jmeter聚合报告(Aggregate Report)是性能测试比较常用的监听器(Listener),用来聚合测试过程中请求的响应时长以及相关的百分位数据。
2.Add Aggregate Report:
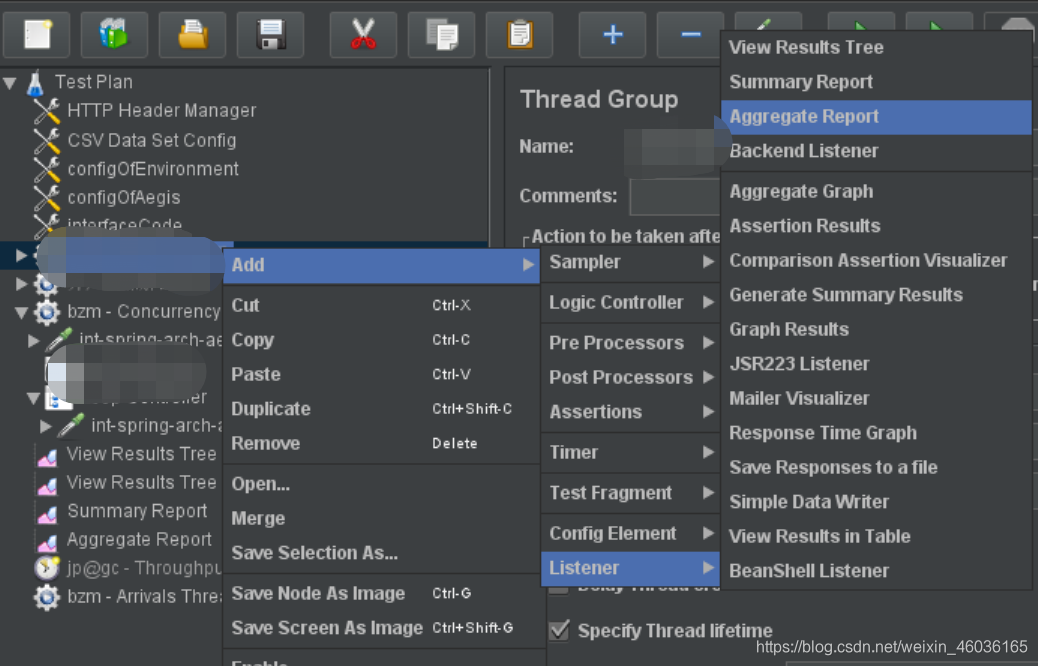
3.聚合报告值详解:
整体结构如图所示:
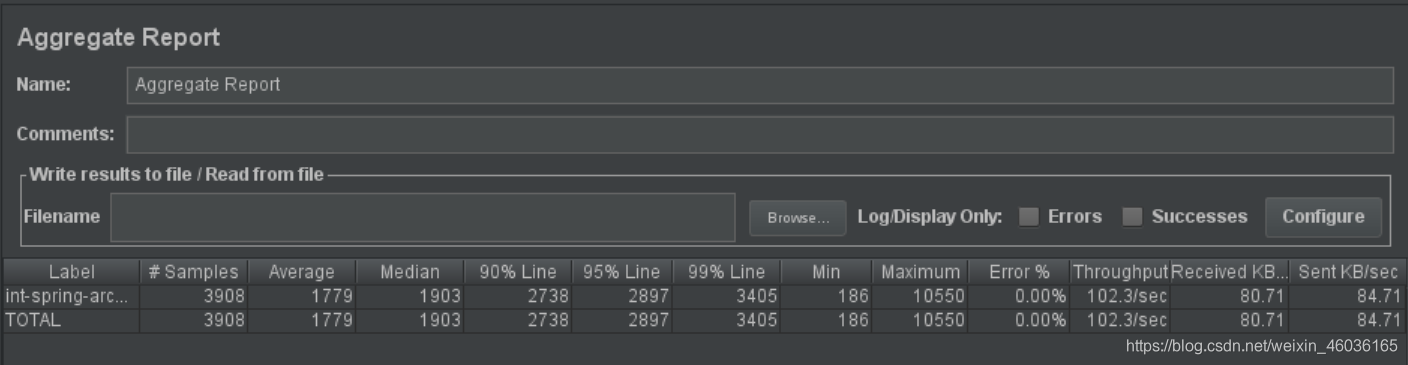
具体参数
Label:The label of the sample.请求的名称
#Samples:The number of the samples with the same label(请求的数量)
Average:The average time of a set of results(该请求的平均响应时长)
Median:The time in the middle of a set of results(50%的请求响应时长在该时间以内)
90%Line:90% of the samples took no more than this time(90%的请求响应时长在该时间以内)
95%Line:95% of the samples took no more than this time(95%的请求响应时长在该时间以内)
99%Line:99% of the samples took no more than this time(99%的请求响应时长在该时间以内)
Min:The shortest time for the samples with the same label(最小的响应时长)
Maximum:The longest time for the samples with the same label(最小的响应时长)
Error %:Percent of requests with errors(错误率)
Throughput:The throughput is measured in requests per second(吞吐量)
Received KB/sec:The throughput measured in received Kilobytes per second(每秒接受服务端的数据量)
Sent KB/sec:The throughput measured in sent Kilobytes per second(每秒发送给服务端的数据量)
注意:Median,90%Line,95%Line,99%Line是表示的统计百分位即:多少请求的响应时长是小于该时间的;而不是多少百分比的请求的平均响应时长。


 2862
2862

 被折叠的 条评论
为什么被折叠?
被折叠的 条评论
为什么被折叠?
 到【灌水乐园】发言


