


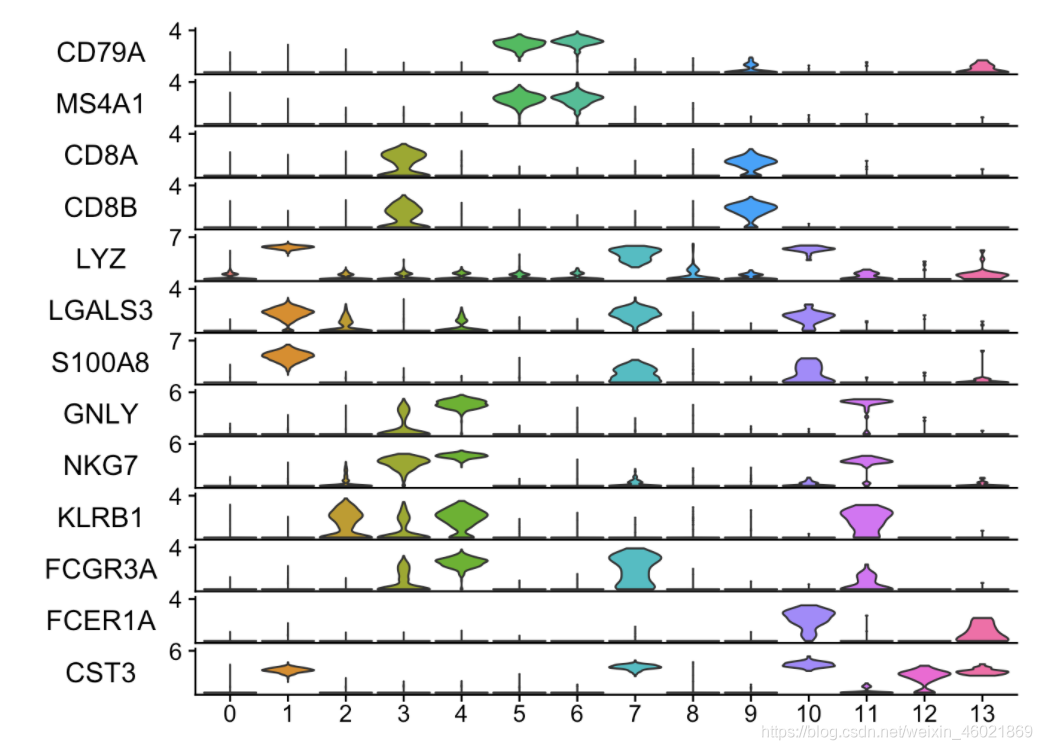
R 语言,Seurat object,想要实现多个小提琴图在一个图的效果,想要实现的效果如下所示:
library(Seurat)
library(SeuratData)
library(ggplot2)
library(ggpubr)

## remove the x-axis text and tick
## plot.margin to adjust the white space between each plot.
## ... pass any arguments to VlnPlot in Seurat
modify_vlnplot<- function(obj,
                          feature,
                          pt.size = 0,
                          plot.margin = unit(c(-0.75, 0, -0.75, 0), "cm"),
                          ...) {
  p<- VlnPlot(obj, features = feature, pt.size = pt.size, ... )  +
    xlab("") + ylab(feature) + ggtitle("") +
    theme(legend.position = "none",
          axis.text.x = element_blank(),
          axis.ticks.x = element_blank(),
          axis.title.y = element_text(size = rel(1), angle = 0),
          axis.text.y = element_text(size = rel(1)),
          plot.margin = plot.margin ) #+ rotate_x_text()
  return(p)
}

## extract the max value of the y axis
extract_max<- function(p){
  ymax<- max(ggplot_build(p)$layout$panel_scales_y[[1]]$range$range)
  return(ceiling(ymax))
}


## main function
StackedVlnPlot<- function(obj, features,
                          pt.size = 0,
                          plot.margin = unit(c(-0.75, 0, -0.75, 0), "cm"),
                          ...) {

  plot_list<- purrr::map(features, function(x) modify_vlnplot(obj = obj,feature = x, ...))

  # Add back x-axis title to bottom plot. patchwork is going to support this?
    # rotate_x_text() 转置横坐标的字体,ggpubr 包,在这里添加才会只出现一次横坐标,不会出现多个横坐标
  plot_list[[length(plot_list)]]<- plot_list[[length(plot_list)]] +
    theme(axis.text.x=element_text(), axis.ticks.x = element_line()) + rotate_x_text()

  # change the y-axis tick to only max value
  ymaxs<- purrr::map_dbl(plot_list, extract_max)
  plot_list<- purrr::map2(plot_list, ymaxs, function(x,y) x +
                            scale_y_continuous(breaks = c(y)) +
                            expand_limits(y = y))

  p<- patchwork::wrap_plots(plotlist = plot_list, ncol = 1)
  return(p)
}

# call function
features<- c("CD8A","CD14")

vlnplt <- StackedVlnPlot(obj = seurat_obj, features = features)
vlnplt
ggsave(filename = "./vlnplot.png", height = 18, width = 14, plot = vlnplt)
其中,rotate_x_text() 转置横坐标的字体,ggpubr 包


 被折叠的 条评论
为什么被折叠?
被折叠的 条评论
为什么被折叠?
 到【灌水乐园】发言


