


 该文章展示了如何使用pyecharts库来构建一个具有复古主题的柱状图,详细介绍了如何导入模块、设置数据、配置标题、图例、提示框和坐标轴等选项,并最终将图表渲染为HTML文件。
官方教程链接:链接
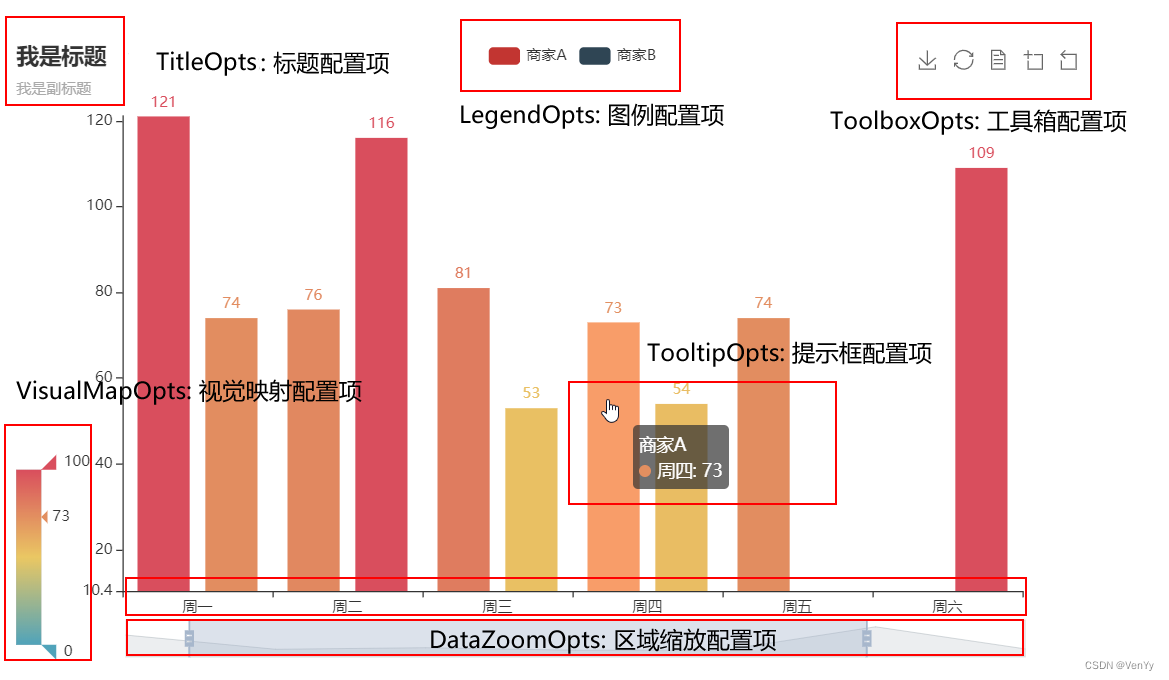
全局配置组件
导入所需模块
from pyecharts.charts import Bar
from pyecharts import options as opts
from pyecharts.globals import ThemeType
代码内容
x = ["周一", "周二", "周三", "周四", "周五", "周六"]
y1 = [43, 34, 45, 65, 23, 67]
y2 = [45, 54, 56, 47, 43, 12]
y3 = [44, 55, 66, 77, 66, 11]
bar = (
Bar(init_opts=opt.InitOpts(theme=ThemeType.VINTAGE))
.add_xaxis(x)
.add_yaxis("组1", y1)
.add_yaxis("组2", y2)
.add_yaxis("组3", y3)
.set_global_opts(
# 标题配置项
title_opts=opts.TitleOpts(
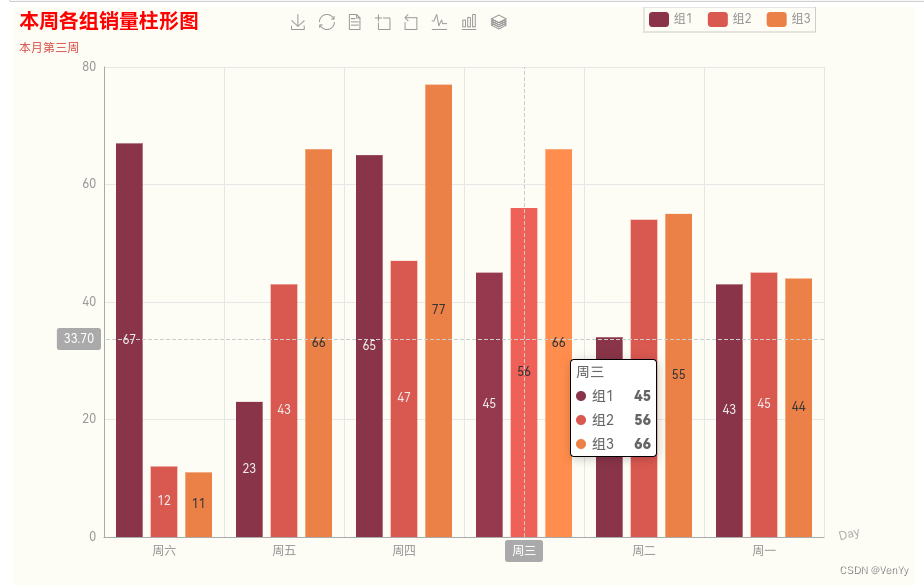
title="本周各组销量柱形图",
title_link="http://www.baidu.com", # 主标题跳转URL链接
subtitle="本月第三周", # 副标题
item_gap=10, # 主副标题的间距
pos_left="0",
# 主标题字体样式配置
title_textstyle_opts=opts.TextStyleOpts(**{
"color": "red",
"font_size": "20px"
}
)
),
# 图例配置项
legend_opts=opts.LegendOpts(
selected_mode="mutiple", # 是否可以通过点击图例改变系列的显示状态。single单选;multiple多选
orient="horizontal", # 图例的布局朝向。horizontal水平;vertical垂直
pos_left="70%",
item_gap=15, # 图例每项之间的间隔
item_width=20, # 图例的宽度
item_height=15 # 图例的高度
),
# 提示框配置项
tooltip_opts=opts.TooltipOpts(
trigger="axis", # 触发类型。item数据项图形触发;axis坐标轴触发;none什么都不触发
trigger_on="mousemove", # 提示框触发的条件。# mousemove鼠标移动时触发;click鼠标点击时触发;
axis_pointer_type="cross", # 指示器类型。line直线;shadow阴影;cross十字准心;none无
background_color="white", # 提示框浮层的背景颜色
border_color="black", # 提示框浮层的边框颜色
border_width=1 # 提示框浮层的边框宽度
),
# 坐标轴配置项
xaxis_opts=opts.AxisOpts(
name="Day", # 坐标轴名称
is_inverse=True, # 是否反向坐标轴
name_location="start", # 坐标轴显示位置。start、middle、center、end
name_gap=15, # 坐标轴名称与轴线之间的距离
name_rotate=15, # 坐标轴名称旋转角度值
# 坐标轴刻度配置项
axistick_opts=opts.AxisTickOpts(None),
# 坐标轴刻度线配置项
axisline_opts=opts.AxisLineOpts(None),
# 坐标轴标签配置项
axislabel_opts=opts.LabelOpts(None),
# 坐标轴指示器配置项
axispointer_opts=opts.AxisPointerOpts(None),
# 坐标轴名称文字样式
name_textstyle_opts=opts.TextStyleOpts(None)
)
)
)
# bar.render_notebook()
script = "alert('Welcome')"
# 添加js代码到html中执行
bar.add_js_funcs(script)
# 获取全局options,JsCode生成的函数不带引号
options = bar.get_options()
# JsCode生成的函数带引号
dump_options = bar.dump_options_with_quotes()
print(dump_options)
# 渲染图到html文件
bar.render("chart.html")
最终效果图


 3万+
3万+

 被折叠的 条评论
为什么被折叠?
被折叠的 条评论
为什么被折叠?
 到【灌水乐园】发言


