


setwd('D:\\tmp_single_cell')
library(readxl)
library(reshape2)
library(ggplot2)
library(dplyr)
library(forcats)
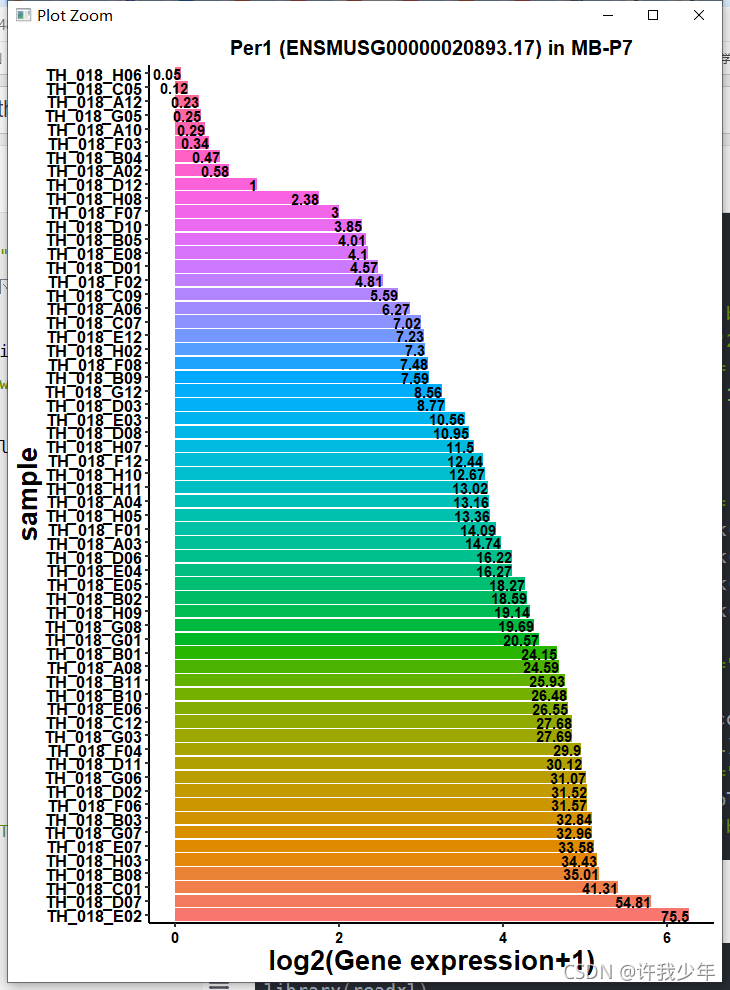
data<-read.table('per1_MB_P7_1.txt',header = 1)
data$value=round(data$ENSMUSG00000020893.17,2)
data %>%
mutate(gene = fct_reorder(gene, desc(value))) %>%
ggplot(aes(x=gene,y=log2(value+1),fill=gene))+
ylab("log2(Gene expression+1)")+xlab('sample')+
labs(title = 'Per1 (ENSMUSG00000020893.17) in MB-P7')+
geom_bar(stat="identity")+
geom_text(aes(label=value), position=position_dodge(width=0.9),#angle =90,
colour='black',hjust=1,vjust=0.5,
fontface = 'bold')+
theme_classic()+
coord_flip() +
scale_fill_hue('')+
theme(axis.title = element_text(face = 'bold',
size = "20",color = "black"),
axis.text.x = element_text(color = "black",face = 'bold',
size = 11, #hjust = 1, vjust = 1,angle = 45
),
axis.text.y = element_text(face = 'bold',size =13,color = "black"),
legend.text = element_text(face = 'bold',color = "black",size = 10),
legend.title = element_text(face = 'bold',color = "black",size = 10),
panel.grid.major.y = element_blank(),
panel.grid.minor.y = element_blank(),
panel.grid.major.x = element_blank(),
panel.grid.minor.x = element_blank(),
legend.position="none",
strip.text.x = element_text( face="bold",size = 14),
#size=8,angle=75
axis.line = element_line(size=1, colour = "black"), ##################### 坐标轴边框加粗(只能加粗左下轴)
axis.ticks = element_line(size = 1),
strip.text.y = element_text( face="bold",size = 14),
strip.background = element_rect(colour = "white", fill = "grey"),
plot.title = element_text(face = "bold",color = "black",lineheight=.8, hjust=0.5, size =15),)
结果如下:
setwd('D:\\12_G4NaK_PEG\\04_PQS')
library(readxl)
library(reshape2)
library(ggplot2)
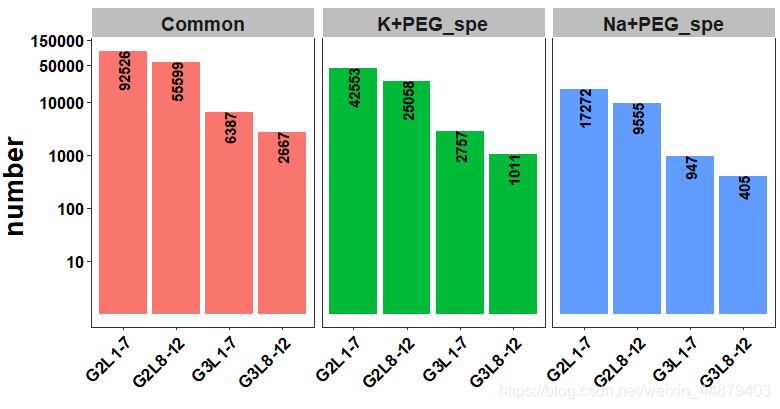
number<-read.table('1number.txt',header = 1)
colnames(number)
data<-melt(number,id.vars="sample",variable.name="Type",
value.name="value")
library(stringr)
data$Type=str_replace(data$Type,'_',"-")
> head(data)
sample Type value
1 Common G2L1-7 92526
2 K+PEG_spe G2L1-7 42553
3 Na+PEG_spe G2L1-7 17272
4 Common G2L8-12 55599
5 K+PEG_spe G2L8-12 25058
6 Na+PEG_spe G2L8-12 9555
ggplot(data,aes(x=Type,y=log10(value),fill=sample))+
ylab("number ")+xlab('')+
geom_bar(stat="identity")+
# geom_hline(aes(yintercept=1),colour='#990000',linetype='dashed')+
facet_grid(.~sample,scales="free")+
geom_text(aes(label=value), position=position_dodge(width=0.9),
angle =90,colour='black',hjust=1,vjust=0.5,
fontface = 'bold')+
theme_bw()+
scale_y_continuous(breaks =c(log10(10),log10(100),log10(1000),log10(10000),log10(50000),log10(150000)),
labels = c(10,100,1000,10000,50000,150000))+
# limits=c(0,6)
scale_fill_hue('')+
theme(axis.title = element_text(face = 'bold',
size = "20",color = "black"),
# legend.position = 'right',
axis.text.x = element_text(color = "black",face = 'bold',
size = 13, hjust = 1, vjust = 1,
angle = 45),
axis.text.y = element_text(face = 'bold',size =13,color = "black"),
legend.text = element_text(face = 'bold',color = "black",size = 10),
legend.title = element_text(face = 'bold',color = "black",size = 10),
panel.grid.major.y = element_blank(),
panel.grid.minor.y = element_blank(),
panel.grid.major.x = element_blank(),
panel.grid.minor.x = element_blank(),
legend.position="none",
strip.text.x = element_text( face="bold",size = 14),
#size=8,angle=75
strip.text.y = element_text( face="bold",size = 14),
strip.background = element_rect(colour = "white", fill = "grey"),
plot.title = element_text(face = "bold",color = "black",lineheight=.8, hjust=0.5, size =11),)
v2
setwd('D:\\11_NM_DNAmeth\\13_NM_G4_imotfi\\03_peaK_enrichment')
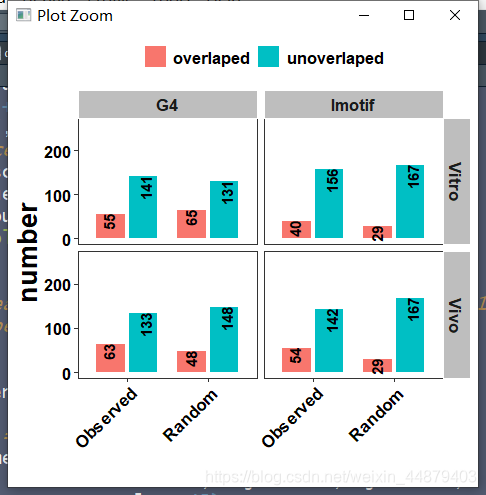
data<-read.table('./all_rich10.txt',sep = '\t',header = 1)
head(data)
library(readxl)
library(reshape2)
df1<-data[,c(1,2,3,5,6,7,8,9)]
head(df1)
df2<-melt(df1,id.vars=c('sample','type','regulated','pvalue'),variable.name="tmp",
value.name="value")
head(df2)
library(tidyverse)
df3=separate(data = df2, col = tmp, into = c("obser", "overlaped"), sep = "_")
head(df3)
df4=df3[which(df3$regulated=="Up flank 1k"),]
df5=df3[which(df3$regulated=="Down flank 1k"),]
head(df5)
ggplot(df4,aes(x=obser,y=value,fill=overlaped))+
ylab("number ")+xlab('')+
geom_bar(stat="identity",position=position_dodge(0.8),width=0.7)+
# geom_hline(aes(yintercept=1),colour='#990000',linetype='dashed')+
facet_grid(type~sample,scales="free")+
geom_text(aes(label=value), position=position_dodge(width=0.9),
angle =90,colour='black',hjust=1,vjust=0.5,
fontface = 'bold')+
ylim(0,260)+
theme_bw()+
# scale_y_continuous(breaks =c(log10(10),log10(100),log10(1000),log10(10000),log10(50000),log10(150000)),
# labels = c(10,100,1000,10000,50000,150000))+
# limits=c(0,6)
scale_fill_hue('')+
theme(axis.title = element_text(face = 'bold',
size = "20",color = "black"),
# legend.position = 'right',
axis.text.x = element_text(color = "black",face = 'bold',
size = 13, hjust = 1, vjust = 1,
angle = 45),
axis.text.y = element_text(face = 'bold',size =13,color = "black"),
legend.text = element_text(face = 'bold',color = "black",size = 13),
legend.title = element_text(face = 'bold',color = "black",size = 10),
panel.grid.major.y = element_blank(),
panel.grid.minor.y = element_blank(),
panel.grid.major.x = element_blank(),
panel.grid.minor.x = element_blank(),
legend.position="top",
strip.text.x = element_text( face="bold",size = 13),
#size=8,angle=75
strip.text.y = element_text( face="bold",size = 13),
strip.background = element_rect(colour = "white", fill = "grey"),
plot.title = element_text(face = "bold",color = "black",lineheight=.8, hjust=0.5, size =11),)
结果:


 被折叠的 条评论
为什么被折叠?
被折叠的 条评论
为什么被折叠?
 到【灌水乐园】发言


