前言
基于echarts5.x和vue2实现
记录以便日后查阅
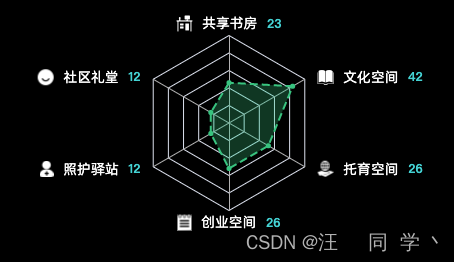
实现效果
代码实现
<template>
<div class="chart-wrap">
<div id="chart03" class="chart" />
</div>
</template>
<script>
export default {
name: 'Index',
data () {
return {
chart: null,
data: [
{ name: '共享书房', max: 50, data: 23, icon: 'gxsf' },
{ name: '社区礼堂', max: 50, data: 12, icon: 'sqlt' },
{ name: '照护驿站', max: 50, data: 12, icon: 'zhyz' },
{ name: '创业空间', max: 50, data: 26, icon: 'cykj' },
{ name: '托育空间', max: 50, data: 26, icon: 'tykj' },
{ name: '文化空间', max: 50, data: 42, icon: 'whkj' }
]
}
},
mounted() {
this.createChartHandler()
},
methods: {
createChartHandler () {
this.chart = this.$echarts.init(document.getElementById('chart03'))
this.chart.setOption(this.getChartOption(this.data))
window.addEventListener('resize', () => {
setTimeout(() => {
this.chart.resize()
})
})
},
getChartOption (data) {
return {
tooltip: {
position: ['50%', '50%'],
extraCssText:
'color:#fff;background: rgba(0, 38, 118, 0.5);border:none; box-shadow: 0px 0px 8px 1px rgba(0, 145, 255, 0.5);border-radius: 2px;z-index:99',
formatter: function (e) {
let str = '<div>'
e.value.forEach((item, index) => {
const d = `<p>${data[index].name}: ${item}</p>`
str += d
})
str += '</div>'
return str
}
},
radar: {
indicator: data,
radius: ['0%', '70%'],
nameGap: '4',
splitArea: {
show: false
},
axisName: {
formatter: (value, indicator) => {
return ` {${indicator.icon}|} {label|${value}} {value|${indicator.data}} `
},
rich: {
gxsf: {
backgroundColor: {
image: require('../../../assets/img/03/gxsf-icon.png')
},
align: 'center',
width: 16,
height: 16
},
sqlt: {
backgroundColor: {
image: require('../../../assets/img/03/sqlt-icon.png')
},
align: 'center',
width: 16,
height: 16
},
zhyz: {
backgroundColor: {
image: require('../../../assets/img/03/zhyz-icon.png')
},
align: 'center',
width: 14,
height: 16
},
cykj: {
backgroundColor: {
image: require('../../../assets/img/03/cykj-icon.png')
},
align: 'center',
width: 14,
height: 16
},
tykj: {
backgroundColor: {
image: require('../../../assets/img/03/tykj-icon.png')
},
align: 'center',
width: 16,
height: 16
},
whkj: {
backgroundColor: {
image: require('../../../assets/img/03/whkj-icon.png')
},
align: 'center',
width: 16,
height: 16
},
label: {
fontSize: '14',
color: '#fff',
lineHeight: 16,
align: 'center',
fontFamily: 'PingFangReg',
fontWeight: '400'
},
value: {
fontSize: '12',
color: '#00D7DA',
lineHeight: 16,
align: 'center',
fontFamily: 'PingFangBold',
fontWeight: 'bold'
}
},
color: '#fff',
fontSize: 14
}
},
series: [
{
name: '',
type: 'radar',
data: [{
value: data.map(item => item.data),
name: 'test'
}],
areaStyle: {
color: 'rgba(6,200,140,0.4)'
},
lineStyle: {
type: 'dashed',
color: '#06C88C'
},
itemStyle: {
color: '#06C88C'
},
symbolSize: 5
}
]
}
}
}
}
</script>


 2135
2135

 被折叠的 条评论
为什么被折叠?
被折叠的 条评论
为什么被折叠?
 到【灌水乐园】发言


